Hostname: page-component-848d4c4894-jbqgn Total loading time: 0 Render date: 2024-07-07T11:21:52.607Z Has data issue: false hasContentIssue false

Metabolic regulation of subcellular sucrose cleavage inferred from quantitative analysis of metabolic functions

Published online by Cambridge University Press:  13 June 2022

Thomas Nägele*
Affiliation:
Faculty of Biology, Plant Evolutionary Cell Biology, Ludwig-Maximilians-Universität München, Planegg-Martinsried, Germany
*
Author for correspondence: T. Nägele, E-mail: thomas.naegele@lmu.de

Abstract

Quantitative analysis of experimental metabolic data is frequently challenged by non-intuitive, complex patterns which emerge from regulatory networks. The complex output of metabolic regulation can be summarised by metabolic functions which comprise information about dynamics of metabolite concentrations. In a system of ordinary differential equations, metabolic functions reflect the sum of biochemical reactions which affect a metabolite concentration, and their integration over time reveals metabolite concentrations. Further, derivatives of metabolic functions provide essential information about system dynamics and elasticities. Here, invertase-driven sucrose hydrolysis was simulated in kinetic models on a cellular and subcellular level. Both Jacobian and Hessian matrices of metabolic functions were derived for quantitative analysis of kinetic regulation of sucrose metabolism. Model simulations suggest that transport of sucrose into the vacuole represents a central regulatory element in plant metabolism during cold acclimation which preserves control of metabolic functions and limits feedback-inhibition of cytosolic invertases by elevated hexose concentrations.

Type
Theories
Creative Commons
Creative Common License - CCCreative Common License - BY
This is an Open Access article, distributed under the terms of the Creative Commons Attribution licence (https://creativecommons.org/licenses/by/4.0/), which permits unrestricted re-use, distribution, and reproduction in any medium, provided the original work is properly cited.
Copyright
© The Author(s), 2022. Published by Cambridge University Press in association with The John Innes Centre

1. Introduction

The quantitative study of biochemical reaction networks represents an interdisciplinary research area of (bio)chemistry, physics and mathematics. Enzymes catalyse chemical reactions under physiologically relevant conditions. Enzyme activity directly depends on temperature, pH, ion strength and redox potential of a cell or compartment showing characteristic optima (Arcus & Mulholland, Reference Arcus and Mulholland2020; Bisswanger, Reference Bisswanger2017). In addition, enzyme activity in cellular systems is affected and regulated by diverse biochemical effectors, for example, comprising other proteins and metabolites (Atkinson, Reference Atkinson1969; Chen et al., Reference Chen, Inzé and Vanhaeren2021). As a result, cellular enzyme activity represents a variable of biochemical networks which is shaped by a large parameter space challenging experimental, but also theoretical, analysis. Enzyme kinetic models mathematically describe enzymatic reaction rates as a function of one or more parameters and variables. In general, biochemical kinetics is based on the mass action law assuming the reaction rate to be proportional to the probability of reactant collision (Waage & Gulberg, Reference Waage and Gulberg1864; Reference Waage and Gulberg1986). This probability is proportional (a) to the concentration of reactants, and (b) to the number of molecules of each reactant that participate in a reaction, that is, to the power of molecularity. The rate v of a reaction following the mass action law with molecularities mi and mj of substrates Si and products Pj , respectively, is described by the rate equation (equation (1)):

(1) $$\begin{align}v={v}_f-{v}_b={k}_f\prod \limits_{i=1}^{l_i}{S}_i^{m_i}-{k}_b\prod \limits_{j=1}^{l_j}{P}_j^{m_j}.\end{align}$$

Here, kf and kb represent the rate constants, that is, proportionality factors, for the forward (kf ) and backward (kb ) reaction. Introducing the reversible formation of an enzyme-substrate complex (E + S → ES), a release of product P from ES (ES → E + P), and the simplifying assumption that formation of ES is much faster than its decomposition into E and P, finally yields the Henri–Michaelis–Menten kinetics (Henri, Reference Henri1902; Henri & Hermann, Reference Henri and Hermann1903; Michaelis & Menten, Reference Michaelis and Menten1913). Due to its capability to accurately describe and quantify mechanisms of enzyme catalysis and regulation, the Michaelis–Menten equation is crucial for biochemical understanding (Cornish-Bowden, Reference Cornish-Bowden2015). It was derived based on experimental observations of sucrose hydrolysis, catalysed by invertase enzymes (Brown, Reference Brown1902; Michaelis & Menten, Reference Michaelis and Menten1913). Within this reaction, the glycosidic bond of sucrose is hydrolysed, and glucose and fructose are released (equation (2)):

(2) $$\begin{align}\overset{r_{\mathrm{in}}}{\to}\mathrm{Suc}\;\overset{r_{\mathrm{in}\mathrm{v}}}{\to}\;\mathrm{Glc}+\mathrm{Frc}\;\overset{\begin{array}{c}{r}_{\mathrm{out},\mathrm{Glc}}\\ {}{r}_{\mathrm{out},\mathrm{Frc}}\end{array}}{\longrightarrow }.\end{align}$$

In this kinetic model, r in represents the rate of sucrose biosynthesis, r inv the rate of invertase-driven hydrolysis and r out,Glc and r out,Frc hexose consuming processes, for example, phosphorylation by hexokinase enzymes. The corresponding ODE model of this reaction system describes sucrose, fructose and glucose dynamics by the sum of in- and effluxes (equations (3)(5)):

(3) $$\begin{align}\frac{d}{dt}\mathrm{Suc}={r}_{\mathrm{in}}-{r}_{\mathrm{in}\mathrm{v}}=f\left(\mathrm{Suc}\right),\end{align}$$
(4) $$\begin{align}\frac{d}{dt}\mathrm{Glc}={r}_{\mathrm{inv}}-{r}_{\mathrm{out},\mathrm{Glc}}=f\left(\mathrm{Glc}\right),\end{align}$$
(5) $$\begin{align}\frac{d}{dt}\mathrm{Frc}={r}_{\mathrm{inv}}-{r}_{\mathrm{out},\mathrm{Frc}}=f\left(\mathrm{Frc}\right).\end{align}$$

The right side of the ODEs, that is, the sum of reactions, is summarised by metabolic functions f and their integration yields the time course of metabolite concentrations. Dynamics of substrate and product concentrations can then be described by differential equations (DEs). If concentration dynamics are considered (only) over time, ordinary differential equations (ODEs) are applied while partial DEs account for more than one independent variable, for example, time and space.

In the following paragraph, invertase-catalysed sucrose hydrolysis is quantitatively explained and analysed down to a subcellular level applying an enzyme kinetic model based on Michaelis–Menten enzyme kinetics and experimental data of previous studies (further details about mathematical analysis are provided in the Supplementary Material). Invertases play a central role in diverse processes of plant metabolism, development and response to environmental stress (Koch, Reference Koch2004; Ruan, Reference Ruan2014; Vu et al., Reference Vu, Martins Rodrigues, Jung, Meissner, Klemens, Holtgrawe, Furtauer, Nagele, Nieberl, Pommerrenig and Neuhaus2020; Weiszmann et al., Reference Weiszmann, Fürtauer, Weckwerth and Nägele2018; Xiang et al., Reference Xiang, Le Roy, Bolouri-Moghaddam, Vanhaecke, Lammens, Rolland and Van den Ende2011). Plant invertases occur in different isoforms with different compartmental localisation and biochemical properties (Sturm, Reference Sturm1996; Tymowska-Lalanne & Kreis, Reference Tymowska-Lalanne and Kreis1998). Both plant vacuolar and extracellular invertases possess an acidic pH optimum between 4.5 and 5.0 while cytosolic invertase has a neutral pH optimum between 7.0 and 7.8 (Sturm, Reference Sturm1999). Acidic and neutral invertases hydrolyse sucrose with a K M in a low-millimolar range (Sturm, Reference Sturm1999; Unger et al., Reference Unger, Hofsteenge and Sturm1992). Invertases are product inhibited, with glucose acting as a non-competitive inhibitor and fructose as a competitive inhibitor (Sturm, Reference Sturm1999). While biochemistry and kinetics of plant invertase reactions have been analysed in numerous studies, the physiological role of different subcellular isoforms and their regulatory impact on plant stress and acclimation reactions remain elusive. Further, due to its participation in cyclic sucrose breakdown and re-synthesis, the experimental study of invertase reactions remains challenging, particularly under changing environmental conditions. Due to such cycling structures, it remains difficult to estimate metabolite amounts, their dynamics and effects on other segments of metabolic networks (Reznik & Segrè, Reference Reznik and Segrè2010). Previous work has suggested a dominant role of invertase-driven sucrose cycling in regulation and stabilisation of primary metabolism and photosynthesis (Geigenberger & Stitt, Reference Geigenberger and Stitt1991; Weiszmann et al., Reference Weiszmann, Fürtauer, Weckwerth and Nägele2018). Here, metabolic functions of sucrose and hexoses are quantified to analyse compartment-specific invertase reactions in context of subcellular metabolite transport during plant cold exposure to evaluate its impact on metabolic acclimation.

2. Results and discussion

Due to the regulatory plasticity of metabolism, metabolite concentrations may vary significantly under similar environmental conditions and without stress exposure. For example, sucrose and hexoses may accumulate significantly, and even double in amount, during the light period of a diurnal cycle (Brauner et al., Reference Brauner, Hörmiller, Nägele and Heyer2014; Seydel et al., Reference Seydel, Biener, Brodsky, Eberlein and Nägele2022; Sulpice et al., Reference Sulpice, Flis, Ivakov, Apelt, Krohn, Encke, Abel, Feil, Lunn and Stitt2014). Such strong dynamics of reaction product and substrate concentrations aggravate the quantitative analysis of metabolic regulation due to their non-linear impact on enzymatic rates. It follows that instead of analysing one (single) snapshot, a broad range of physiologically relevant metabolite concentrations and/or enzyme parameters needs to be analysed in order to cope with metabolic plasticity. Here, an example of such an analysis is provided applying a kinetic parameter set of invertase reactions (Table 1), which has previously been determined in Arabidopsis thaliana under ambient (22°C) and low (4°C) temperature (Kitashova et al., Reference Kitashova, Schneider, Furtauer, Schroder, Scheibenbogen, Furtauer and Nagele2021).

Table 1 Carbon uptake rates and kinetic parameters of invertase-catalysed sucrose hydrolysis in Arabidopsis thaliana, accession Col-0, at 22 and 4°C.

Data source: Kitashova et al. (Reference Kitashova, Schneider, Furtauer, Schroder, Scheibenbogen, Furtauer and Nagele2021).

Reaction rates of invertase enzymes, r inv, were calculated across different combinations of physiologically relevant sucrose and hexose concentrations to determine the metabolic function of sucrose, that is, f(Suc) = r in − r inv. Simulation results of different sucrose concentrations were plotted against glucose and fructose concentrations (Figure 1). Thus, each shown plane in the figure corresponds to solutions of f(Suc), J and H for one sucrose concentration (a detailed definition of concentrations is provided in the figure legend). Although sucrose concentrations used for 4°C simulations were up to 8-fold higher than under 22°C, resulting absolute values and dynamics of f(Suc) were significantly lower than under 22°C (Figure 1a,b). Reduced absolute values were due to a decreased input rate r in,4°C (based on experimental findings). As expected, under conditions of low product concentration, f(Suc) became minimal under both temperatures due to increased rates of sucrose cleavage (Figure 1a,b). However, reduced dynamics of f(Suc) was due to increased hexose concentrations (inhibitors) and a reduced V max of invertase (see Table 1). As a result, also the dynamic range of J and H decreased across all simulated scenarios by several orders of magnitude (10−1 → 10−4/10−5; Figure 1c–f). A main low temperature effect became visible in entries of Jacobian matrices which was a reduced degree of overlap between j 12 $\big(\frac{\partial \left(f\left(\mathrm{Suc}\right)\right)}{\partial \left(\mathrm{Glc}\right)}\big)$ and j 13 $\big(\frac{\partial \left(f\left(\mathrm{Suc}\right)\right)}{\partial \left(\mathrm{Frc}\right)}\big)$ (Figure 1c,d). Both terms describe changes of f(Suc) induced by (slight) changes of glucose and fructose concentrations, respectively. At 22°C, high glucose concentrations (~ 2.5−3 μmol gFW−1) minimise j 13 and, with this, also the regulatory effect of fructose dynamics on f(Suc) (see Figure 1c). At 4°C, high glucose concentrations (~ 14−15 μmol gFW−1) also lead to minimal values of j 13, which were, however, still significantly higher than j 12 (see Figure 1d; ANOVA, p < .001). This discrepancy became also visible in the curvature of f(Suc), that is, in the Hessian matrix (Figure 1e,f).

These observations suggest that, under ambient conditions and (increased) glucose concentrations, it is j 12  j 13, that is, $\frac{\partial \left(f\left(\mathrm{Suc}\right)\right)}{\partial \left(\mathrm{Glc}\right)}\approx \frac{\partial \left(f\left(\mathrm{Suc}\right)\right)}{\partial \left(\mathrm{Frc}\right)}$ , and ${h}_{f\left(\mathrm{Suc}\right),12}\approx {h}_{f\left(\mathrm{Suc}\right),13}$ , that is, $\frac{\partial^2\left({r}_{\mathrm{in}}-{r}_{\mathrm{in}\mathrm{v}}\right)}{\partial \left(\mathrm{Suc}\right)\partial \left(\mathrm{Glc}\right)}\approx \frac{\partial^2\left({r}_{\mathrm{in}}-{r}_{\mathrm{in}\mathrm{v}}\right)}{\partial \left(\mathrm{Suc}\right)\partial \left(\mathrm{Frc}\right)}$ . At low temperature, this similarity is not given even under (relatively) high glucose concentrations which might suggest a cold-induced switch of the regulatory role which fructose plays in plant metabolism (Klotke et al., Reference Klotke, Kopka, Gatzke and Heyer2004).

Fig. 1. Dynamics of f(Suc) under ambient and low temperature. (a) f(Suc) at 22°C under variable concentrations of fructose (x-axis), glucose (y-axis) and sucrose (planes). (b) f(Suc) at 4°C under variable concentrations of fructose (x-axis), glucose (y-axis) and sucrose (planes). Unit of f(Suc): (μmol Suc h−1 gFW−1). (c) Jacobian matrix entries of f(Suc) at 22°C under variable concentrations of glucose (x-axis), fructose (y-axis) and sucrose (planes; see equation S5 in the supplements; j 11: blue; j 12: green; j 13: grey). (d) Jacobian matrix entries of f(Suc) at 4°C under variable concentrations of glucose (x-axis), fructose (y-axis) and sucrose (planes). See equation S5 in the supplements; J 11: blue; J 12: green; J 13: grey. (e) Hessian matrix entries of f(Suc) at 22°C under variable concentrations of glucose (x-axis), fructose (y-axis) and sucrose (planes), see equation S11 in the supplements; h f(Suc,11): blue; h f(Suc,12): green; h f(Suc,13): grey. (f) Hessian matrix entries of f(Suc) at 4°C under variable concentrations of glucose (x-axis), fructose (y-axis) and sucrose (planes), see equation S11 in the supplements; h f(Suc,11): blue; h f(Suc,12): green; h f(Suc,13): grey. Each plane corresponds to a sucrose concentration which was varied between 1−3 μmol gFW−1 and 4−8 μmol gFW−1 for simulations at 22 and 4°C, respectively.

3. Vacuolar metabolite transport increases elasticity of the cellular sucrose function

To study a regulatory effect of hexose accumulation under low temperature in more detail, the model was extended to subcellular distribution of sugars and invertase isoforms (Figure 2). Effective cytosolic and vacuolar sugar concentrations in Arabidopsis leaf mesophyll cells were estimated as previously described assuming the cytosol to comprise 5% and the vacuole 80% of the total cell volume (Nägele & Heyer, Reference Nägele and Heyer2013). Further, subcellular sugar distribution at 22 and 4°C, respectively, was derived from a previous study (Fürtauer et al., Reference Fürtauer, Weckwerth and Nägele2016). Details about the relative distribution of sugars are provided below (see legend of Figure 2).

Fig. 2. Schematic overview of subcellular invertase reactions. Green colour indicates cytosolic metabolites and enzymes and blue colour indicates vacuolar metabolites and enzymes. For simulation of subcellular sucrose cleavage, effective metabolite concentrations were calculated based on assumptions and findings of previous studies (Kitashova et al., Reference Kitashova, Schneider, Furtauer, Schroder, Scheibenbogen, Furtauer and Nagele2021; Nägele & Heyer, Reference Nägele and Heyer2013). Based on previous findings (Fürtauer et al., Reference Fürtauer, Weckwerth and Nägele2016), subcellular sugar distribution was assumed as follows: cytosolic sucrose, 22°C: 50%; vacuolar sucrose, 22°C: 25%; cytosolic hexoses, 22°C: 30%; vacuolar hexoses, 22°C: 55%; cytosolic sucrose, 4°C: 40%; vacuolar sucrose, 4°C: 33%; cytosolic hexoses, 4°C: 30%; vacuolar hexoses, 4°C: 50%.

Assuming a volume of 1 ml H2O to equal (approximately) 1 g fresh weight of Arabidopsis leaf material (Nägele & Heyer, Reference Nägele and Heyer2013), effective sugar concentrations were derived from the sugar amounts used before (see Figure 1; Kitashova et al., Reference Kitashova, Schneider, Furtauer, Schroder, Scheibenbogen, Furtauer and Nagele2021). To simulate compartment-specific sucrose cleavage, neutral (cytosolic) and acidic (vacuolar) invertase activities were considered separately (Kitashova et al., Reference Kitashova, Schneider, Furtauer, Schroder, Scheibenbogen, Furtauer and Nagele2021). Subcellular simulations of f(Suc) across a physiologically feasible range of metabolite concentrations at 22°C revealed higher variability of vacuolar metabolic functions than in the cytosol (Figure 3a,d). Entries of Jacobian and Hessian matrices, which accounted for changes in substrate and/or product concentrations, differed by orders of magnitude between cytosolic and vacuolar reactions (Figure 3b,c,e,f).

Fig. 3. Estimated cytosolic and vacuolar dynamics of f(Suc) under ambient and low temperature at variable concentrations of fructose, glucose and sucrose. Planes represents simulations for different sucrose concentrations (sucrose concentration ranges: cytosol, 22°C: 8–24 mM; vacuole, 22°C: 0.25–0.75 mM; cytosol, 4°C: 25.6–51.2 mM; vacuole, 4°C: 1.32–2.64 mM). (a–f) estimations at 22°C, (g–l) estimations at 4°C. (a) cytosolic f(Suc) at 22°C, (b) Jacobian entries j 11 (blue), j 12 (green), j 13 (grey) of cytosolic f(Suc) at 22°C, (c) Hessian entries h f(Suc,11) (blue), h f(Suc,12) (green), h f(Suc,13) (grey) of cytosolic f(Suc) at 22°C, (d) vacuolar f(Suc) at 22°C, (e) Jacobian entries j 11 (blue), j 12 (green), j 13 (grey) of vacuolar f(Suc) at 22°C, (f) Hessian entries h f(Suc,11) (blue), h f(Suc,12) (green), h f(Suc,13) (grey) of vacuolar f(Suc) at 22°C, (g) cytosolic f(Suc) at 4°C, (h) Jacobian entries j 11 (blue), j 12 (green), j 13 (grey) of cytosolic f(Suc) at 4°C, (i) Hessian entries h f(Suc,11) (blue), h f(Suc,12) (green), h f(Suc,13) (grey) of cytosolic f(Suc) at 4°C, (j) vacuolar f(Suc) at 4°C, (k) Jacobian entries j 11 (blue), j 12 (green), j 13 (grey) of vacuolar f(Suc) at 4°C, (l) Hessian entries h f(Suc,11) (blue), h f(Suc,12) (green), h f(Suc,13) (grey) of vacuolar f(Suc) at 4°C. Colour bars in the left panel (a,d,g,j) indicate values of f(Suc).

These differences were due to 16-fold dilution of metabolites comparing the vacuolar and cytosolic volume (5 vs. 80% of the total cell volume). Hence, lowered effective metabolite concentrations in the vacuole resulted in higher elasticity of f(Suc) due to lowered invertase inhibition by glucose and fructose. At 4°C, the discrepancy between concentration effects on f(Suc) in cytosol and vacuole became stronger due to significant cold-induced sugar accumulation (Figure 3g,j). Under these conditions, f(Suc) in the cytosol was almost invariant across the simulated sucrose concentration range of 25.6–51.2 mM (Figure 3g) while dynamics were still observable for the vacuolar f(Suc) (Figure 3j). This was numerically reflected in Jacobian and Hessian matrix entries of the subcellular metabolic function of f(Suc) which revealed dynamics of vacuolar fructose concentration to have the strongest regulatory effect within the simulated scenario (Figure 3h,i,k,l).

Together with the findings of the whole cell model (Figure 1), these observations suggest that transport of sucrose into the vacuole maximise effects of metabolic regulation on f(Suc) and provide further evidence for a dominant role of fructose in regulation of sucrose cleavage under low temperature. Previous studies have shown that sugar accumulation, in general, plays a central role in plant cold response and acclimation (Guy et al., Reference Guy, Kaplan, Kopka, Selbig and Hincha2008; Hannah et al., Reference Hannah, Wiese, Freund, Fiehn, Heyer and Hincha2006; Seydel, Kitashova, et al., Reference Seydel, Kitashova, Fürtauer and Nägele2022). Fructose and its phosphorylation product, fructose 6-phosphate (F6P), have been found to significantly contribute to stabilisation of a plant metabolic homeostasis during cold exposure (Bogdanović et al., Reference Bogdanović, Mojović, Milosavić, Mitrović, Vučinić and Spasojević2008). F6P is a direct product of the Calvin Benson Cycle and serves as substrate for many other metabolic pathways, for example, starch biosynthesis, sucrose biosynthesis and glycolysis (Ruan, Reference Ruan2014). Thus, findings of the present study suggest that tight regulation of f(Suc) in the cytosol and vacuole by fructose directly connects sucrose dynamics with the stabilisation of many other cellular pathways. In future studies, a combination of the presented kinetic approach with subcellular sugar analysis of mutants being affected in sucrose cleavage and subcellular sugar transport might reveal further detailed insights into the regulatory network of plant sucrose metabolism.

4. Conclusions

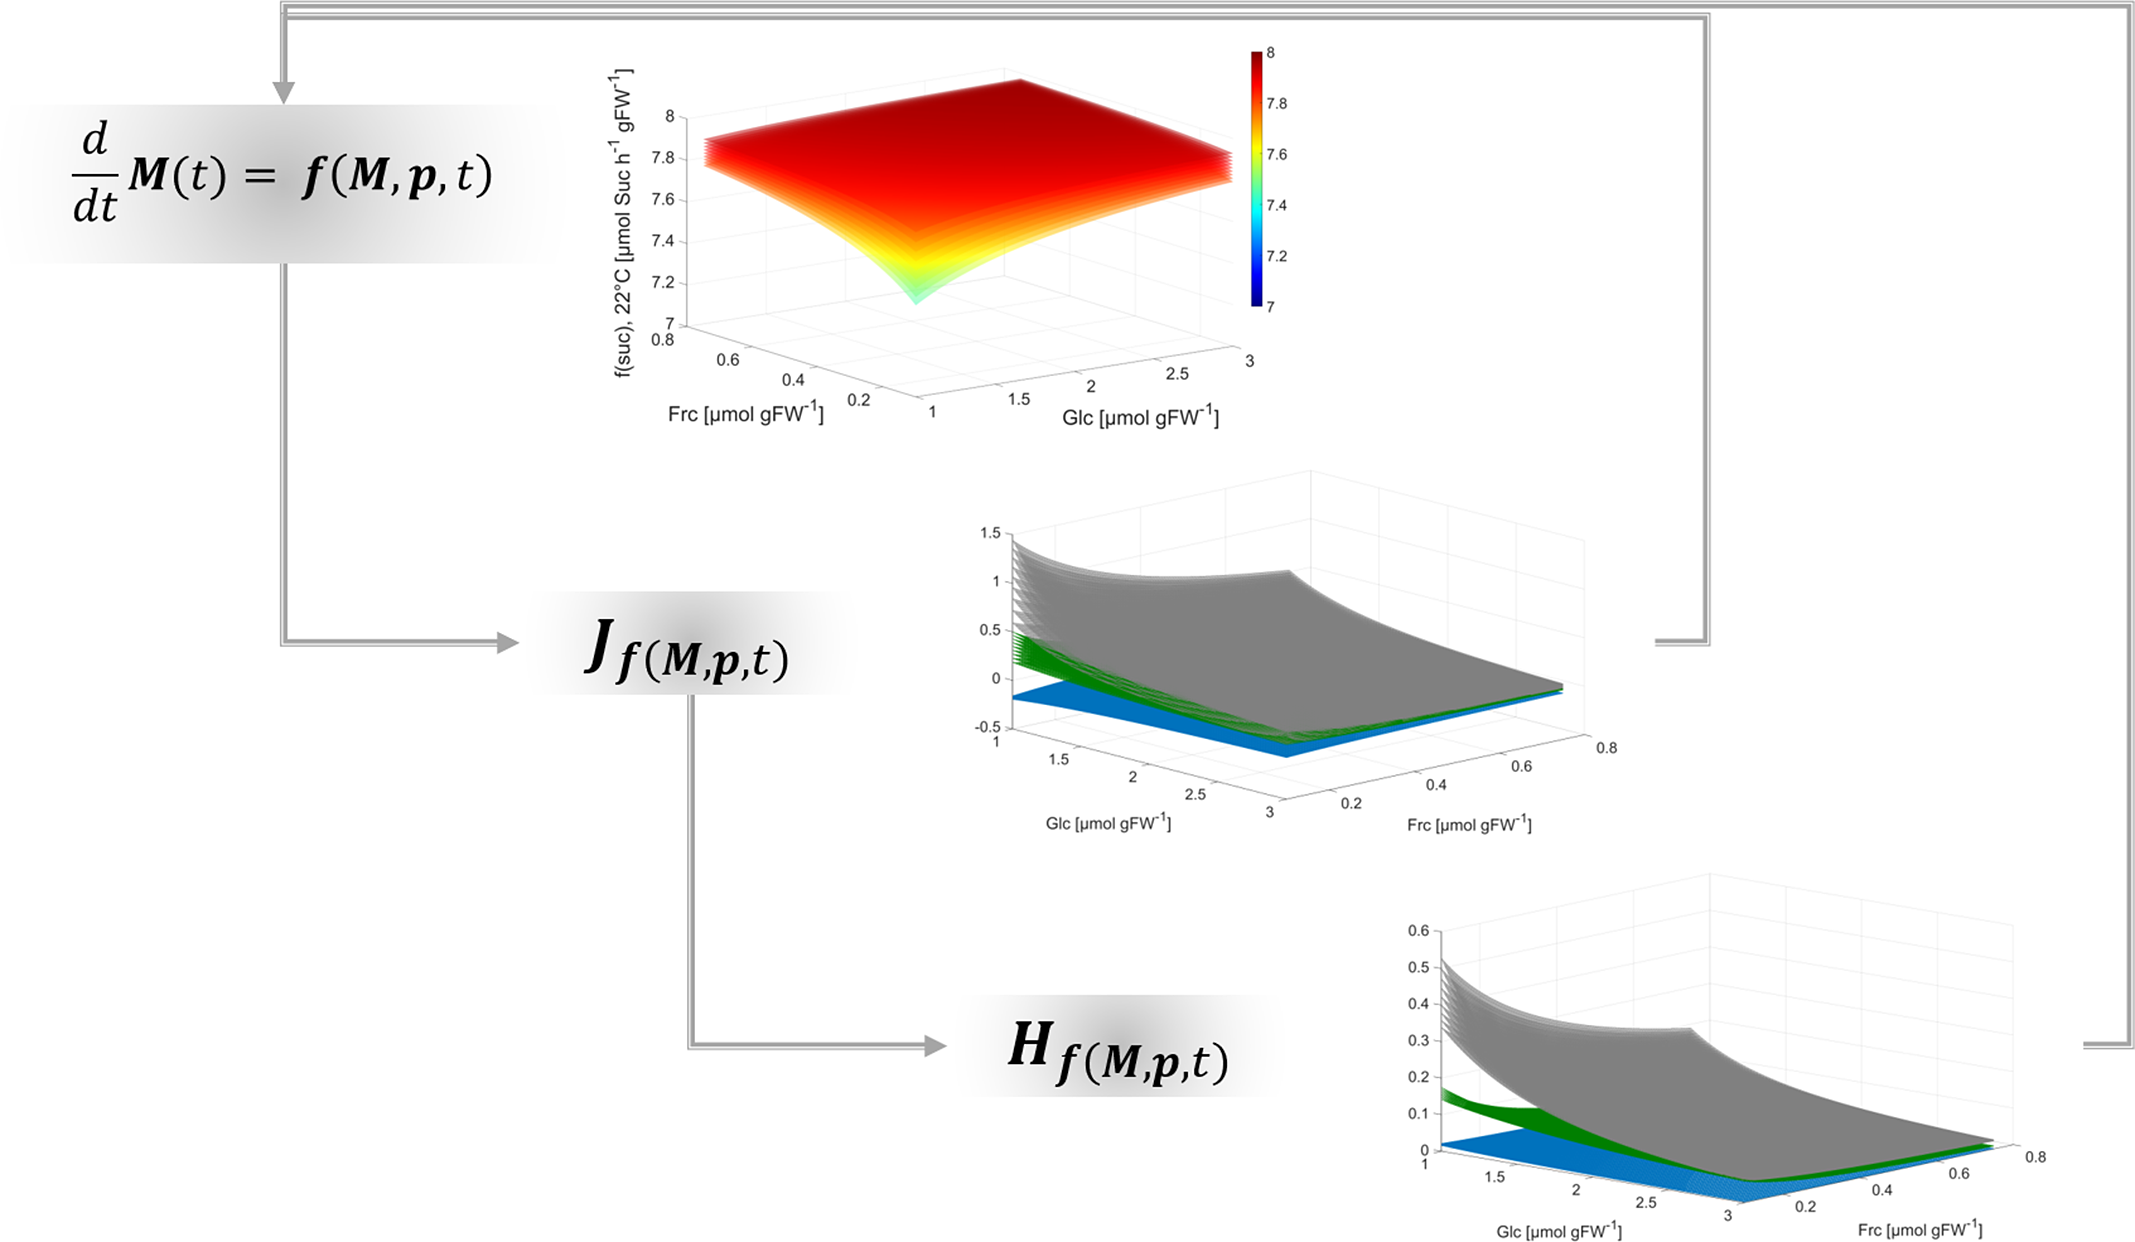
Together with the Jacobian matrix, Hessian matrices are commonly applied to study n-dimensional functions and surfaces, their extrema and their curvature (see e.g., (Basterrechea & Dacorogna, Reference Basterrechea and Dacorogna2014; Ivochkina & Filimonenkova, Reference Ivochkina and Filimonenkova2019). In context of the presented theory for analysis of biochemical metabolic functions, this suggests that metabolism can be summarised by a multi-dimensional function which supports the analysis of complex metabolic regulation, for example, of metabolic cycling. Although calculation of metabolic functions, Jacobian and Hessian matrices is straight forward, it essentially supports quantitative analysis of multi-dimensional dynamics, shape and curvature of a metabolic landscape (Figure 4).

Fig. 4. Workflow for deriving regulatory principles of metabolism.

Findings of the present study emphasise the necessity to resolve eukaryotic metabolism to a subcellular level in order to reliably estimate dynamics of metabolite concentrations in terms of reaction rates and transport processes. Finally, applying such analysis to dynamic metabolic systems can unravel non-intuitive regulatory patterns. This supports the quantitative interpretation of experimental observations on metabolism within a dynamic environment.

Acknowledgements

I would like to thank all members of Plant Evolutionary Cell Biology, LMU Munich, for many fruitful seminars and discussions. Special thanks go to Lisa Fürtauer, RWTH Aachen, and AG Weckwerth, University of Vienna, as well as Jakob Weiszmann and Matthias Nagler for constructive advice, support and discussion. Finally, I thank the SFB/TR175 consortium for a supportive research environment and fruitful discussions.

Financial support

This work was supported by Deutsche Forschungsgemeinschaft (DFG), grants TR175/D03 and NA 1545/4-1.

Conflict of interest

The author declares no conflicts of interest.

Data availability statement

The main data supporting the findings of this study are contained within the article and cited literature.

Supplementary Materials

To view supplementary material for this article, please visit http://doi.org/10.1017/qpb.2022.5.

References

Arcus, V. L., & Mulholland, A. J. (2020). Temperature, dynamics, and enzyme-catalyzed reaction rates. Annual Review of Biophysics, 49, 163180. https://doi.org/10.1146/annurev-biophys-121219-081520 CrossRefGoogle ScholarPubMed
Atkinson, D. E. (1969). Regulation of enzyme function. Annual Review of Microbiology, 23, 4768. https://doi.org/10.1146/annurev.mi.23.100169.000403 CrossRefGoogle ScholarPubMed
Basterrechea, S., & Dacorogna, B. (2014). Existence of solutions for Jacobian and Hessian equations under smallness assumptions. Numerical Functional Analysis and Optimization, 35, 868892. https://doi.org/10.1080/01630563.2014.895746 CrossRefGoogle Scholar
Bisswanger, H. (2017). pH and temperature dependence of enzymes. In Enzyme kinetics (pp. 145152). Wiley-VCH. https://doi.org/10.1002/9783527806461.ch6 CrossRefGoogle Scholar
Bogdanović, J., Mojović, M., Milosavić, N., Mitrović, A., Vučinić, Ž., & Spasojević, I. (2008). Role of fructose in the adaptation of plants to cold-induced oxidative stress. European Biophysics Journal, 37, 12411246. https://doi.org/10.1007/s00249-008-0260-9 CrossRefGoogle ScholarPubMed
Brauner, K., Hörmiller, I., Nägele, T., & Heyer, A. G. (2014). Exaggerated root respiration accounts for growth retardation in a starchless mutant of Arabidopsis thaliana. The Plant Journal, 79, 8291. https://doi.org/10.1111/tpj.12555 CrossRefGoogle Scholar
Brown, A. J. (1902). Enzyme action. Journal of the Chemical Society, 81, 373388.CrossRefGoogle Scholar
Chen, Y., Inzé, D., & Vanhaeren, H. (2021). Post-translational modifications regulate the activity of the growth-restricting protease DA1. Journal of Experimental Botany, 72, 33523366. https://doi.org/10.1093/jxb/erab062 CrossRefGoogle ScholarPubMed
Cornish-Bowden, A. (2015). One hundred years of Michaelis–Menten kinetics. Perspectives in Science, 4, 39. https://doi.org/10.1016/j.pisc.2014.12.002 CrossRefGoogle Scholar
Fürtauer, L., Weckwerth, W., & Nägele, T. (2016). A benchtop fractionation procedure for subcellular analysis of the plant metabolome [methods]. Frontiers in Plant Science, 7, 1912. https://doi.org/10.3389/fpls.2016.01912 CrossRefGoogle Scholar
Geigenberger, P., & Stitt, M. (1991). A “futile” cycle of sucrose synthesis and degradation is involved in regulating partitioning between sucrose, starch and respiration in cotyledons of germinating Ricinus communis L. seedlings when phloem transport is inhibited. Planta, 185, 8190. https://doi.org/10.1007/BF00194518 Google ScholarPubMed
Guy, C., Kaplan, F., Kopka, J., Selbig, J., & Hincha, D. K. (2008). Metabolomics of temperature stress. Physiologia Plantarum, 132, 220235. https://doi.org/10.1111/j.1399-3054.2007.00999.x Google ScholarPubMed
Hannah, M. A., Wiese, D., Freund, S., Fiehn, O., Heyer, A. G., & Hincha, D. K. (2006). Natural genetic variation of freezing tolerance in Arabidopsis. Plant Physiology, 142, 98112. https://doi.org/10.1104/pp.106.081141 CrossRefGoogle ScholarPubMed
Henri, V. (1902). Théorie générale de l’action de quelques diastases. Comptes Rendus de l’Académie des Sciences, 135, 916919.Google Scholar
Henri, V., & Hermann, A. (Eds.). (1903). Lois générales de l’action des diastases. Librairie Scientifique.Google Scholar
Ivochkina, N., & Filimonenkova, N. (2019). Differential geometry in the theory of Hessian operators. Preprint, https://doi.org/10.48550/arXiv.1904.04157.CrossRefGoogle Scholar
Kitashova, A., Schneider, K., Furtauer, L., Schroder, L., Scheibenbogen, T., Furtauer, S., & Nagele, T. (2021). Impaired chloroplast positioning affects photosynthetic capacity and regulation of the central carbohydrate metabolism during cold acclimation. Photosynthesis Research, 147, 4960. https://doi.org/10.1007/s11120-020-00795-y CrossRefGoogle ScholarPubMed
Klotke, J., Kopka, J., Gatzke, N., & Heyer, A. G. (2004). Impact of soluble sugar concentrations on the acquisition of freezing tolerance in accessions of Arabidopsis thaliana with contrasting cold adaptation - evidence for a role of raffinose in cold acclimation. Plant Cell and Environment, 27, 13951404. https://doi.org/10.1111/j.1365-3040.2004.01242.x CrossRefGoogle Scholar
Koch, K. (2004). Sucrose metabolism: Regulatory mechanisms and pivotal roles in sugar sensing and plant development. Current Opinion in Plant Biology, 7, 235246. https://doi.org/10.1016/j.pbi.2004.03.014 CrossRefGoogle ScholarPubMed
Michaelis, L., & Menten, M. L. (1913). Die Kinetik der Invertinwirkung. Biochemische Zeitschrift, 49, 333369.Google Scholar
Nägele, T., & Heyer, A. G. (2013). Approximating subcellular organisation of carbohydrate metabolism during cold acclimation in different natural accessions of Arabidopsis thaliana. The New Phytologist, 198, 777787. https://doi.org/10.1111/nph.12201 CrossRefGoogle ScholarPubMed
Reznik, E., & Segrè, D. (2010). On the stability of metabolic cycles. Journal of Theoretical Biology, 266, 536549. https://doi.org/10.1016/j.jtbi.2010.07.023 CrossRefGoogle ScholarPubMed
Ruan, Y. L. (2014). Sucrose metabolism: Gateway to diverse carbon use and sugar signaling. Annual Review of Plant Biology, 65, 3367. https://doi.org/10.1146/annurev-arplant-050213-040251 CrossRefGoogle ScholarPubMed
Seydel, C., Biener, J., Brodsky, V., Eberlein, S., & Nägele, T. (2022). Predicting plant growth response under fluctuating temperature by carbon balance modelling. Communications Biology, 5, 164. https://doi.org/10.1038/s42003-022-03100-w CrossRefGoogle ScholarPubMed
Seydel, C., Kitashova, A., Fürtauer, L., & Nägele, T. (2022). Temperature-induced dynamics of plant carbohydrate metabolism. Physiologia Plantarum, 174, e13602. https://doi.org/10.1111/ppl.13602 CrossRefGoogle ScholarPubMed
Sturm, A. (1996). Molecular characterization and functional analysis of sucrose-cleaving enzymes in carrot (Daucus carota L.). Journal of Experimental Botany, 47, 11871192.CrossRefGoogle Scholar
Sturm, A. (1999). Invertases. Primary structures, functions, and roles in plant development and sucrose partitioning. Plant Physiology, 121, 18. http://www.ncbi.nlm.nih.gov/pubmed/10482654 CrossRefGoogle ScholarPubMed
Sulpice, R., Flis, A., Ivakov, A. A., Apelt, F., Krohn, N., Encke, B., Abel, C., Feil, R., Lunn, J. E., & Stitt, M. (2014). Arabidopsis coordinates the diurnal regulation of carbon allocation and growth across a wide range of photoperiods. Molecular Plant, 7, 137155. http://doi.org/10.1093/mp/sst127 CrossRefGoogle ScholarPubMed
Tymowska-Lalanne, Z., & Kreis, M. (1998). The plant invertases: Physiology, biochemistry and molecular biology. Advances in Botanical Research, 28, 71117.CrossRefGoogle Scholar
Unger, C., Hofsteenge, J., & Sturm, A. (1992). Purification and characterization of a soluble β-fructofuranosidase from Daucus carota. European Journal of Biochemistry, 204, 915921. https://doi.org/10.1111/j.1432-1033.1992.tb16712.x CrossRefGoogle ScholarPubMed
Vu, D. P., Martins Rodrigues, C., Jung, B., Meissner, G., Klemens, P. A. W., Holtgrawe, D., Furtauer, L., Nagele, T., Nieberl, P., Pommerrenig, B., & Neuhaus, H. E. (2020). Vacuolar sucrose homeostasis is critical for plant development, seed properties, and night-time survival in Arabidopsis. Journal of Experimental Botany, 71, 49304943. https://doi.org/10.1093/jxb/eraa205 CrossRefGoogle ScholarPubMed
Waage, P., & Gulberg, C. M. (1864). Studies concerning affinity. Forhandlinger, Videnskabs-Selskabet, 35.Google Scholar
Waage, P., & Gulberg, C. M. (1986). Studies concerning affinity. Journal of Chemical Education, 63, 1044. https://doi.org/10.1021/ed063p1044 CrossRefGoogle Scholar
Weiszmann, J., Fürtauer, L., Weckwerth, W., & Nägele, T. (2018). Vacuolar sucrose cleavage prevents limitation of cytosolic carbohydrate metabolism and stabilizes photosynthesis under abiotic stress. The FEBS Journal, 285, 40824098. https://doi.org/10.1111/febs.14656 CrossRefGoogle ScholarPubMed
Xiang, L., Le Roy, K., Bolouri-Moghaddam, M.-R., Vanhaecke, M., Lammens, W., Rolland, F., & Van den Ende, W. (2011). Exploring the neutral invertase–oxidative stress defence connection in Arabidopsis thaliana. Journal of Experimental Botany, 62 38493862. https://doi.org/10.1093/jxb/err069 CrossRefGoogle ScholarPubMed
Figure 0

Table 1 Carbon uptake rates and kinetic parameters of invertase-catalysed sucrose hydrolysis in Arabidopsis thaliana, accession Col-0, at 22 and 4°C.

Data source: Kitashova et al. (2021).
Figure 1

Fig. 1. Dynamics of f(Suc) under ambient and low temperature. (a) f(Suc) at 22°C under variable concentrations of fructose (x-axis), glucose (y-axis) and sucrose (planes). (b) f(Suc) at 4°C under variable concentrations of fructose (x-axis), glucose (y-axis) and sucrose (planes). Unit of f(Suc): (μmol Suc h−1 gFW−1). (c) Jacobian matrix entries of f(Suc) at 22°C under variable concentrations of glucose (x-axis), fructose (y-axis) and sucrose (planes; see equation S5 in the supplements; j11: blue; j12: green; j13: grey). (d) Jacobian matrix entries of f(Suc) at 4°C under variable concentrations of glucose (x-axis), fructose (y-axis) and sucrose (planes). See equation S5 in the supplements; J11: blue; J12: green; J13: grey. (e) Hessian matrix entries of f(Suc) at 22°C under variable concentrations of glucose (x-axis), fructose (y-axis) and sucrose (planes), see equation S11 in the supplements; hf(Suc,11): blue; hf(Suc,12): green; hf(Suc,13): grey. (f) Hessian matrix entries of f(Suc) at 4°C under variable concentrations of glucose (x-axis), fructose (y-axis) and sucrose (planes), see equation S11 in the supplements; hf(Suc,11): blue; hf(Suc,12): green; hf(Suc,13): grey. Each plane corresponds to a sucrose concentration which was varied between 1−3 μmol gFW−1 and 4−8 μmol gFW−1 for simulations at 22 and 4°C, respectively.

Figure 2

Fig. 2. Schematic overview of subcellular invertase reactions. Green colour indicates cytosolic metabolites and enzymes and blue colour indicates vacuolar metabolites and enzymes. For simulation of subcellular sucrose cleavage, effective metabolite concentrations were calculated based on assumptions and findings of previous studies (Kitashova et al., 2021; Nägele & Heyer, 2013). Based on previous findings (Fürtauer et al., 2016), subcellular sugar distribution was assumed as follows: cytosolic sucrose, 22°C: 50%; vacuolar sucrose, 22°C: 25%; cytosolic hexoses, 22°C: 30%; vacuolar hexoses, 22°C: 55%; cytosolic sucrose, 4°C: 40%; vacuolar sucrose, 4°C: 33%; cytosolic hexoses, 4°C: 30%; vacuolar hexoses, 4°C: 50%.

Figure 3

Fig. 3. Estimated cytosolic and vacuolar dynamics of f(Suc) under ambient and low temperature at variable concentrations of fructose, glucose and sucrose. Planes represents simulations for different sucrose concentrations (sucrose concentration ranges: cytosol, 22°C: 8–24 mM; vacuole, 22°C: 0.25–0.75 mM; cytosol, 4°C: 25.6–51.2 mM; vacuole, 4°C: 1.32–2.64 mM). (a–f) estimations at 22°C, (g–l) estimations at 4°C. (a) cytosolic f(Suc) at 22°C, (b) Jacobian entries j11 (blue), j12 (green), j13 (grey) of cytosolic f(Suc) at 22°C, (c) Hessian entries hf(Suc,11) (blue), hf(Suc,12) (green), hf(Suc,13) (grey) of cytosolic f(Suc) at 22°C, (d) vacuolar f(Suc) at 22°C, (e) Jacobian entries j11 (blue), j12 (green), j13 (grey) of vacuolar f(Suc) at 22°C, (f) Hessian entries hf(Suc,11) (blue), hf(Suc,12) (green), hf(Suc,13) (grey) of vacuolar f(Suc) at 22°C, (g) cytosolic f(Suc) at 4°C, (h) Jacobian entries j11 (blue), j12 (green), j13 (grey) of cytosolic f(Suc) at 4°C, (i) Hessian entries hf(Suc,11) (blue), hf(Suc,12) (green), hf(Suc,13) (grey) of cytosolic f(Suc) at 4°C, (j) vacuolar f(Suc) at 4°C, (k) Jacobian entries j11 (blue), j12 (green), j13 (grey) of vacuolar f(Suc) at 4°C, (l) Hessian entries hf(Suc,11) (blue), hf(Suc,12) (green), hf(Suc,13) (grey) of vacuolar f(Suc) at 4°C. Colour bars in the left panel (a,d,g,j) indicate values of f(Suc).

Figure 4

Fig. 4. Workflow for deriving regulatory principles of metabolism.

Supplementary material: PDF

Nägele supplementary material

Nägele supplementary material

Download Nägele supplementary material(PDF)
PDF 334 KB

Author comment: Metabolic regulation of subcellular sucrose cleavage inferred from quantitative analysis of metabolic functions — R0/PR1

Comments

Dear Dr. Hamant,

Dear Dr. Fleck,

I am submitting a theories article to be considered for publication in your journal Quantitative Plant Biology. The article is entitled “Metabolic regulation inferred from Jacobian and Hessian matrices of metabolic functions”. It presents a theoretical approach to develop first-order and second-order partial derivatives of metabolic functions summarised by Jacobian and Hessian matrices. Applying a simple kinetic model of invertase-driven sucrose hydrolysis, an approach was developed for quantitative analysis of kinetic regulation of sucrose metabolism based on partial derivatives of metabolic functions. Based on previously published experimental observations, metabolite dynamics were quantitatively explained in context of underlying metabolic functions and enzyme kinetics. I applied this approach to explain differential regulation of sucrose and hexose concentrations in Arabidopsis thaliana during cold acclimation. Finally, a switch of the metabolic role of fructose metabolism is suggested to be involved in metabolic reprogramming during plant cold acclimation. The manuscript has been made publicly available on the bioRxiv pre-print server (https://doi.org/10.1101/2021.10.05.463227).

In summary, I am convinced that this article is of high interest for the readership of Quantitative Plant Biology. I would be pleased to publish it within your journal and thank you in advance for editing my manuscript.

Sincerely yours,

Thomas Nägele

Review: Metabolic regulation of subcellular sucrose cleavage inferred from quantitative analysis of metabolic functions — R0/PR2

Conflict of interest statement

Reviewer declares none.

Comments

Comments to Author: Prof. Nägele presents a theoretical study in which he applies the Jacobian and Hessian matrix of metabolic functions to analyse a simple model of invertase-driven sucrose hydrolysis. Using a recently published set of carbon uptake rates and kinetic parameters from Arabidopsis thaliana, accession Col-0 at ambient temperature and cold stress the author studies the potential regulatory role of metabolite dynamics during plant cold acclimation. The manuscript is well written and sound. However, as the concept of applying partial derivatives to study metabolite dynamics is not novel, the manuscript is currently lacking convincing insights that can be gained from the presented analysis. Thus, I have a few major and minor suggestions, most importantly:

The manuscript would gain matter if the author elaborated more on the biological insights of this computational analysis and how sucrose hydrolysis affects metabolism under normal conditions and cold stress.

Minor points:

The term “metabolic function” can have different meanings in different scientific communities and contexts. Thus, defining this term even more explicitly, both in the abstract and the introduction, could avoid confusing the reader.

It would be insightful for the reader if this analysis was placed in a larger context and to learn in which other studies the Jacobian and/or Hessian matrix has been used to study metabolite dynamics.

Although the manuscript is well written and enjoyable for an expert reader it might be challenging to follow for a non-expert reader. However, I guess that might be expected from a manuscript to be published in Quantitative Plant Biology.

Review: Metabolic regulation of subcellular sucrose cleavage inferred from quantitative analysis of metabolic functions — R0/PR3

Conflict of interest statement

Reviewer declares none.

Comments

Comments to Author: The paper of Nägele entitled “Metabolic regulation inferred from Jacobian and Hessian matrices of metabolic functions” introduces a mathematical modeling framework based on the estimation of Jacobian and Hessian matrices of a metabolic network at a steady state to describe influences of metabolites and conditions on fluxes and metabolite concentrations. It is applied to a simple model of invertase-driven sucrose hydrolysis using literature data under two different temperatures.

The interdisciplinary combination of experiments and systems theoretic analysis is generally interesting and promising. However, while reading the paper, I had several difficulties in understanding the overall aim of the study and to follow the line of argumentation. I was not able to extract the main research results. I suggest to re-structure the paper in this respect and hope that my detailed comments below help to do so. Moreover, I recommend considering teaming up with a partner from the mathematical/modeling field, to clarify the issues on the mathematical side.

Major points:

I found the paper difficult to read, mainly due to the structure and line of argumentation:

- The introduction contains a short explanation the complexity of enzyme activities in cellular systems, explains the well known law of mass action and states that metabolic systems can be described by differential equations.

In an introduction, I would rather expect that the intro describes current state of work in the field, their limitations and open research questions / problems, and then states how (some of) these are addressed in the paper and which methods are used, and probably a short outlook on the main results of the paper.

- The section “Deriving a Jacobian matrix to study ….” (p4ff) still reads as a kind of introduction / review for a derivation of the MM kinetics. When the sucrose hydrolysis system was introduced as a model (Eq4), it was not clear to me that this is the particular application system for the paper. In the following, product inhibition of invertases are described (which means that hexoses inhibit r_inv in the model, if I am not mistaken). Since this is crucial also for the following, I suggest to improve the reaction scheme to make this dependence clear, and probably cast it into a Figure, which illustrates the example system that is analyzed here. In connection with the mathematical model (Eq 8-11).

- I also suggest to design a figure that illustrates the methodological pipeline. Key messages do not become clear from only one Figure in the end of the paper.

- p6: are equations 8,9 extracted from other literature sources? Please clearly indicate

-p7, first line: Now that the model is introduced, one expects the description of questions and goals in the context of this model latest; instead, a description of linearization to study stability of a steady state follows. I do not understand the message of this paragraph. The model introduced on p6 clearly reaches a dynamic steady state with constant in- and effluxes, if I am not mistaken. The time scale of this convergence of course depends on initial concentrations and parameter values for rate constants and Michaelis constants. Now it is stated that plant metabolism can hardly be described as in steady state due to its external and internal dynamics, which is, however, not included in the model. The motivation why the analysis via Jacobian and Hessian matrices makes sense at all if the steady state assumption is not fulfilled is not clear to me. Moreover, the assumption that the velocity of an enzymatic reaction linearly depends on substrate concentration is in contrast to the before mentioned MM kinetics, where the order of the reaction velocity with respect to the substrate changes from one to zero with increasing substrate concentration.

- It is not completely clear what the Jacobian matrix can be used for. It is argued that the spectrum of J_f indicates stability of a steady state, but is stability really a relevant issue for the particular system at hand? Without knowing the Jacobian matrix and the exact dynamics, I would intuitively say that this is a stable system with respect to perturbations of any concentrations of species in the network in a steady state.

- A critical discussion of limitations of the method / results is missing. How do results relate to other similar studies? Is this approach e.g. related to Modular response analysis, which is to my knowledge derived from Metabolic Control Analysis?

- The application in connection with the data gathered in Table 1 is interesting, but the description is not sufficient to understand the key points: what is the goal of this application / what are the questions, how are r_inv rates exactly calculated, what do we learn from the results?

Minor

- p3: explanation mass action law: “This probability is proportional to (I) the concentration of reactants, (ii) to the number of molecules which participate in a reaction”: this is a misleading wording. The number of molecules usually appears in stochastic descriptions, where molecule numbers are low. Otherwise, concentrations are used in the law of mass action.

- p3, Equation 1, similarly: what are S_i and P_j, are these concentrations or molecule numbers?

-p7, Jacobian matrix: I would rather explain linearization by the ODE system for the dynamics of a small perturbation from a steady state, i.e. \dot (\Delta x)=J_f(\bar x)\Delta x, where \Delta x=x-\bar x is the deviation from the steady state \bar x and J_f(\bar x) is the Jacobian matrix of the ODE system evaluated at the steady state (which is important but missing in the text).

- p8, sentence: Further, these equations show:… is this clear from the equations? I think this is generally intuitively clear when using MM kinetics to describe substrate conversions

- p8: what is a “square decrease towards zero”?

-p8, equ. 16 not clear to me. If hexose is present in large amounts, this inhibits r_inv and, if r_in is constant, this leads to an accumulation of Suc, right? Can’t this be seen just by the reaction scheme with known feedback influences?

Recommendation: Metabolic regulation of subcellular sucrose cleavage inferred from quantitative analysis of metabolic functions — R0/PR4

Comments

Comments to Author: Dear Prof. Nägele,

we have now received the required number of review reports. Unfortunately, both reports are critical and request major rewriting of your manuscript.

I suggest that you take into account the comments of the reviewers and revise the manuscript accordingly. In its current form the manuscript is not appropriate for publication in Quantitative Plant Biology.

Kind regards,

Christian Fleck

Decision: Metabolic regulation of subcellular sucrose cleavage inferred from quantitative analysis of metabolic functions — R0/PR5

Comments

No accompanying comment.

Author comment: Metabolic regulation of subcellular sucrose cleavage inferred from quantitative analysis of metabolic functions — R1/PR6

Comments

Dear Dr. Hamant,

Dear Dr. Fleck,

I am submitting a fully revised theories article to be considered for publication in your journal Quantitative Plant Biology. Based on reviewer comments, the article is now entitled “Metabolic regulation of subcellular sucrose cleavage inferred from Jacobian and Hessian matrices of metabolic functions”. I have addressed all comments raised by both reviewers and have extended my theoretical analysis to a subcellular level of metabolism. My findings provide strong evidence for an important role of vacuolar sucrose transport during cold acclimation. To my opinion, this provides strong evidence for the applicability and usefulness of my approach. I have further added a methodological pipeline graph to indicate how metabolic functions and their dynamics might be numerically analysed to reveal detailed insights into metabolic regulation. To facilitate further review activities, I have highlighted all changes made (yellow background).

In summary, I am convinced that this revision has improved article is of high interest for the readership of Quantitative Plant Biology. I would be pleased to publish it within your journal and thank you in advance for editing my manuscript.

Sincerely yours,

Thomas Nägele

Review: Metabolic regulation of subcellular sucrose cleavage inferred from quantitative analysis of metabolic functions — R1/PR7

Comments

Comments to Author: The author has addressed all my suggestions and questions in a satisfying manner. The revised version of the manuscript has much gained from the addition of more biological context. I only have two minor comments left.

Axis labels of Figure 1 and especially Figure 3 are fairly small and could be increased for better readability.

Figure 2 seems to be corrupted during the submission process.

Recommendation: Metabolic regulation of subcellular sucrose cleavage inferred from quantitative analysis of metabolic functions — R1/PR8

Comments

Comments to Author: I apologise for the considerable time it took to review the manuscript, but we had difficulties to find the needed number of reviews. One reviewer decided to stay anonymous. I therefore attach the review below.

I recommend to carefully consider the comments of this reviewer. In particular, I would like to remind the author that a research article is not a review article. I suggest to shorten the introductory material as also proposed by the reviewer.

Report from anonymous reviewer:

In my opinion, the revised manuscript has improved compared to the original one. In particular, some of the newly added paragraphs about the interpretation of the findings of the study in the biological context are helpful. However, I still think that the manuscript needs some major revisions in order to make it accessible to a broad readership.

My major concern is about the structure of the paper. While this has partly improved in the revised version, I still think that it contains too much text about „standard knowledge“ (Michaelis Meinten kinetics, definition and calculation of Jacobian and Hessian matrices…). It takes the reader a long time until the first results are presented. Moreover, at this point the „study design“ (i.e. which questions are to be answered, with which methods and why) is still not completely clear. I could also not find a concise summary of the major findings of the paper.

To my knowledge, the theory about metabolic networks is vast, and interpretations of Jacobian (and maybe also Hessian?) matrices can also be found elsewhere. So I suggest to re-structure the content of the paper and to 1. shorten standard knowledge considerably, 2. think about how to even more emphasize and illustrate the major findings, 3. refer to existing literature about using J and H for an analysis of metabolic networks.

It is also still not completely clear to me what is to be estimated. The Jacobian and Hessian matrix of a steady state are just matrixes with fixed entries that can readily be calculated if all model parameters are given. And if I understand correctly, this is what is done to produce the results. However, the author elaborates on estimating Jacobian matrices from experimental data, which is a much harder problem. I do not see the connection to his results.

The added paragraph on p7 about why a steady state assumption is justified is helpful, but should be integrated earlier in the manuscript.

Decision: Metabolic regulation of subcellular sucrose cleavage inferred from quantitative analysis of metabolic functions — R1/PR9

Comments

No accompanying comment.

Author comment: Metabolic regulation of subcellular sucrose cleavage inferred from quantitative analysis of metabolic functions — R2/PR10

Comments

Dear Dr. Hamant,

Dear Dr. Fleck,

based on your and reviewer comments, I have revised my article entitled “Metabolic regulation of subcellular sucrose cleavage inferred from quantitative analysis of metabolic functions”. I have addressed all comments raised by you and both reviewers. I have added a supplemental file to explain the mathematical basics behind the analysis to prevent having too much text in the main manuscript/introduction.

I hope I can convince you that this revision has improved the article and can be considered for publication in Quantitative Plant Biology.

Thank you very much for editing my manuscript!

Sincerely yours,

Thomas Nägele

Recommendation: Metabolic regulation of subcellular sucrose cleavage inferred from quantitative analysis of metabolic functions — R2/PR11

Comments

Comments to Author: Dear Dr. Nägele,

I find your manuscript now sufficiently improved and ready for publication in QPB.

Kind regards,

Christian Fleck

Decision: Metabolic regulation of subcellular sucrose cleavage inferred from quantitative analysis of metabolic functions — R2/PR12

Comments

No accompanying comment.