


1 INTRODUCTION
The investigation of short-period contact binary systems is important for the modern astrophysics because they are natural laboratories for study of the late stage of the stellar evolution connected with the processes of mass and angular momentum loss, merging or fusion of the stars (Martin et al. Reference Martin, Spruit and Tata2011). Moreover, the period–colour–luminosity relation makes them useful tracers of distance on small scales (Rucinski Reference Rucinski1994; Klagyivik & Csizmadia Reference Klagyivik and Csizmadia2004; Eker, Demircan, & Bilir Reference Eker, Demircan and Bilir2008).
But the statistics of W UMa stars with short and ultrashort periods (P ⩽ 0.23 d) is relatively poor (Norton et al. Reference Norton2011; Terrell, Gross, & Cooney Reference Terrell, Gross and Cooney2012; Lohr et al. Reference Lohr2013) due to a very sharp decline of the period distribution of binaries with periods below 0.27 d (Drake et al., Reference Drake2014) as well as faintness of these late stars.
This paper is continuation of our study of ultrashort-period binaries (Dimitrov & Kjurkchieva Reference Dimitrov and Kjurkchieva2010, Reference Dimitrov and Kjurkchieva2015; Kjurkchieva, Dimitrov, & Ibryamov Reference Kjurkchieva, Dimitrov and Ibryamov2015; Kjurkchieva & Dimitrov Reference Kjurkchieva and Dimitrov2015; Kjurkchieva et al. Reference Kjurkchieva, Popov, Vasileva and Petrov2016). It presents results of our photometric and low-resolution spectral observations of 10 binaries with orbital periods within 5.1–5.5 h: NSVS 2175434; NSVS 2607629; NSVS 5038135; NSVS 8040227; NSVS 9747584; NSVS 4876238; ASAS 071829-0336.7 (further ASAS 0718-03); SWASP 074658.62+224448.5 (further SWASP 0746+22); NSVS 2729229; NSVS 10632802. The targets were selected mainly as a result of searching for short-period eclipsing binaries (Dimitrov Reference Dimitrov2009) from the NSVS database (Woźniak et al. Reference Woźniak2004). Additionally, we included in the sample the known ultrashort-period stars ASAS 0718-03 (Pribulla et al. Reference Pribulla, Vanko and Hambalek2009) and SWASP 0746 + 22 (Norton et al. Reference Norton2011) for follow-up observations.
Table 1 presents the coordinates of our targets and available information for their light variability.
Table 1. Preliminary information about the targets.
Reference: 1 - VSX (Shaw); 2 – Molnar et al. Reference Molnar2013; 3 – Lohr et al. Reference Lohr2013; 4 – Butters et al. Reference Butters2010; 5 – Kazarovets et al. Reference Kazarovets, Samus, Durlevich, Kireeva and Pastukhova2015; 6 – Pribulla et al. Reference Pribulla, Vanko and Hambalek2009; 7 – Pojmanski Reference Pojmanski2002; 8 – Norton et al. Reference Norton2011; 9 – Rucinski Reference Rucinski2007; 10 – Drake et al. Reference Drake2014; 11 – Devor et al. Reference Devor2008; 12 – Palaversa et al. Reference Kjurkchieva, Dimitrov and Ibryamov2013; 13 – Gurol & Michel Reference Gurol and Michel2017.
2 OBSERVATIONS
Our photometric observations of the targets in V, I bands were carried out in 2010 and 2011 (Table 2) at Rozhen Observatory with the 60-cm Cassegrain telescope using CCD camera FLI PL09000 (3 056 × 3 056 pixels, 12 μm pixel−1) or with 50/70-cm Schmidt telescope equipped by CCD camera FLI PL16803 (4 096 × 4 096 pixels, 9 μm pixel−1). The mean photometric error for each target and each filter are given in Table 3.
Table 2. Journal of the Rozhen observations.
Table 3. Target spectral type and temperatures T m, and mean precision σ of our VI photometric observations.
The photometric data were reduced in a standard way with the software package maximdl by dark substraction and flat-field division. We performed aperture photometry using more than six comparison stars in the observed field of each target. The photometric data were phased with the periods from Table 1 and the corresponding folded curves are presented in Figures 1–2. The period of the newly discovered ultrashort-period binary NSVS 2729229 was determined by the software persea.
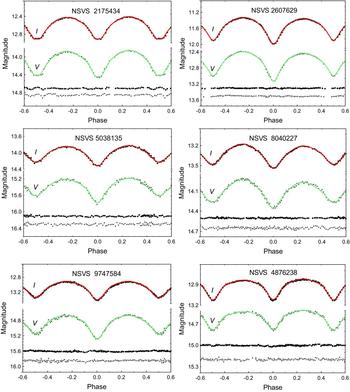
Figure 1. The folded light curves with their fits and the corresponding residuals (shifted vertically by different amount to save space) for the first six targets.
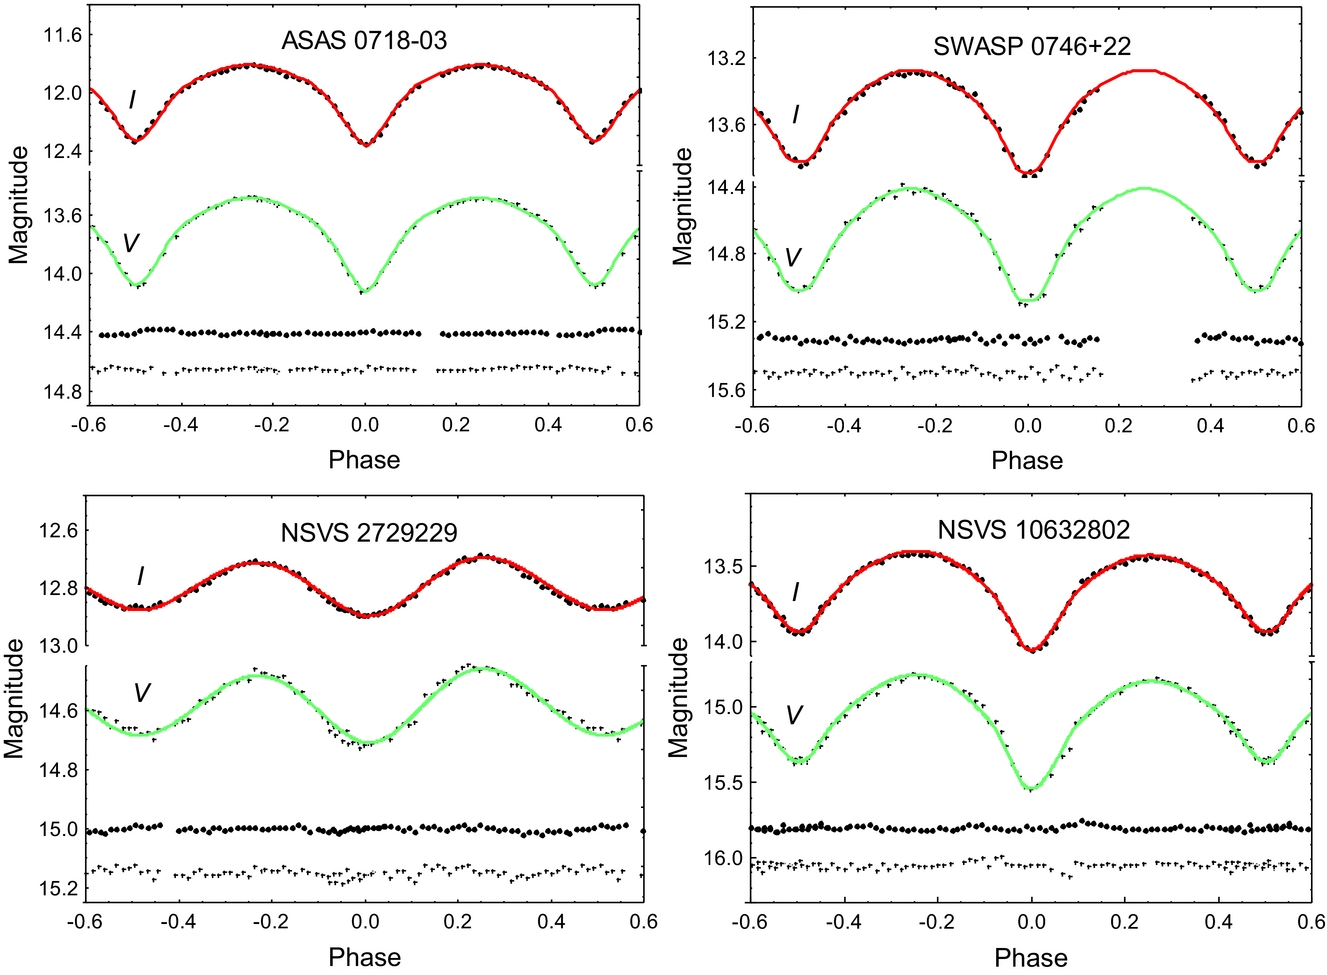
Figure 2. The same as in Figure 1 for the last four targets.
We noted that the amplitudes of half of our light curves differ from the earlier values (Table 1): those of NSVS 2175434 and NSVS 2607629 are smaller while those of NSVS 8040227 and NSVS 9747584 are bigger (Figures 1–2). The most amazing case is NSVS 2175434 whose amplitude turned out twice smaller than the earlier value.
The low-resolution spectral observations were carried out during five nights in 2011 (Table 2) by the 2-m RCC telescope of Rozhen Observatory equipped with focal reducer FoReRo-2 and CCD camera VersArray (512 × 512 pixels, 24 μm pixel−1). We used grism with 300 lines mm−1 that gives resolution 5.223 A pixel−1 in the range 5 000–7 000 A. The reduction of the spectra was performed with iraf package by bias subtraction, flat fielding, cosmic ray, and nebular lines removal and one-dimensional spectrum extraction. The emission night-sky lines as well as Rb source of emission spectrum were used for wavelength calibration.
The original photometric data and reduced spectra are available at http://astro.shu.bg/obs-data/10stars/.
The low-resolution spectra (Figure 3) do not allow radial velocity measurement and mass ratio determination but are very useful indicators of temperature and stellar activity. All of the objects were spectrally classified by the software package hammer of Covey et al. (Reference Covey2007) and the corresponding target temperatures T m were determined (Table 3). For ASAS 0718-03, we adopted the photometric temperature from Pribulla et al. (Reference Pribulla, Vanko and Hambalek2009) determined by its 2MASS colour index J − K.
Figure 3. Low-resolution spectra.
3 LIGHT CURVE SOLUTIONS
We carried out the modelling of our data by the package phoebe (Prsa & Zwitter Reference Prsa and Zwitter2005) based on the Wilson–Devinney code (Wilson & Devinney Reference Wilson and Devinney1971).
The procedure of the light curve solutions consists of several steps. First, we adopted primary temperature T 1 = T m and assumed that the stellar components are MS stars. Then we calculated initial (approximate) values of secondary temperature T 2, mass ratio q, and ratio of relative stellar radii k = r 2/r 1, based on the empirical relation of MS stars (Ivanov, Kjurkchieva, & Srinivasa Rao Reference Ivanov, Kjurkchieva and Srinivasa Rao2010): T 2 = T 1(d 2/d 1)1/4, q = (T 2/T 1)1.6, k = q 0.75.
Further we searched for best fit varying: T 2 and q around their initial values; orbital inclination i in the range 60–90° (appropriate for eclipsing stars); potentials Ω1, 2 in such way that the ratio r 2/r 1 to correspond to its initial value. We adopted coefficients of gravity brightening 0.32 and reflection effect 0.5 appropriate for late stars (Table 3). The limb-darkening coefficients were chosen according to the tables of Van Hamme (Reference Van Hamme1993). In order to reproduce the light curve distortions, we added cool spots on the primary and varied their parameters (longitude λ, latitude β, angular size α, and temperature factor κ).
After reaching the best solution (corresponding to the minimum of χ2), we adjusted the stellar temperatures T 1 and T 2 around the value T m by the formulae (Kjurkchieva & Vasileva Reference Kjurkchieva2015):
 $$\begin{equation}
T_{1}^{f} = T_{\rm {m}} + \frac{c \Delta T}{c+1},
\end{equation}$$\\
$$\begin{equation}
T_{1}^{f} = T_{\rm {m}} + \frac{c \Delta T}{c+1},
\end{equation}$$\\
 $$\begin{equation}
T_{2}^{f} = T_{1}^{f}-\Delta T,
\end{equation}$$
$$\begin{equation}
T_{2}^{f} = T_{1}^{f}-\Delta T,
\end{equation}$$
The formal phoebe errors of the fitted parameters were unreasonably small. That is why, we estimated the parameter errors manually by the procedure proposed by Dimitrov, Kjurkchieva, & Iliev (Reference Dimitrov, Kjurkchieva and Iliev2017). After reaching the best fit, the parameter b was changed around its value b f (corresponding to the best fit), while the rest parameters remained fixed until the biggest deviation of the new synthetic curve from the best-fit synthetic curve became 3σ (σ is the photometric error of the target from Table 3). Then the difference between the new value of b and b f gives the precision of this parameter. Figure 4 illustrates our method for determination of precision of fitted parameters.
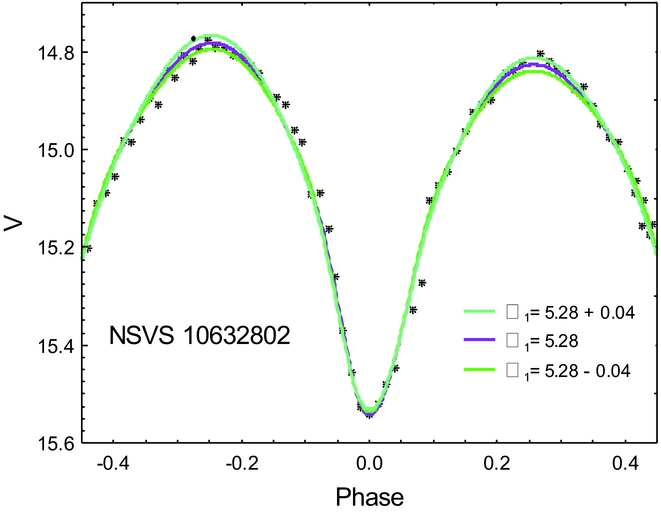
Figure 4. The three synthetic fits used for determination of the precision of Ω1 of NSVS 10632802.
Table 4 contains the final values of the fitted stellar parameters and their uncertainties: initial epoch T 0; secondary temperature T 2; potentials Ω1, 2; inclination i; mass ratio q and parameters λ and α of equatorial spots with κ = 0.9. The synthetic curves corresponding to the parameters of our light curve solutions are shown in Figures 1–2 as continuous lines while Figure 5 exhibits 3D configurations of the targets.
Table 4. Fitted parameters.
phoebe gives a possibility to calculate all values (polar, point, side, and back) of the relative radius r i = R i /a of each component (R i is linear radius and a is orbital separation). Moreover, phoebe yields as output parameters bolometric magnitudes Mi bol of the two components in conditional units (when radial velocity data are not available) but their difference M 2 bol − M bol 1 determines the true luminosity ratio c = L 2/L 1.
Table 5 exhibits the calculated parameters: stellar temperatures Tf 1, 2; relative stellar radii r 1, 2 (back values); ratio of stellar luminosities L 2/L 1; fill-out factor f. Using the empirical relation P, a for short- and ultrashort-period W UMa type systems (Dimitrov & Kjurkchieva Reference Dimitrov and Kjurkchieva2015), we calculated target orbital axis a (in solar radii) and thus we were able to estimate masses M i , radii R i , and luminosities L i of the stellar components in solar units as well as target distance d. Their values are given in Table 6.
Table 5. Calculated parameters.
Table 6. Global parameters.
4 ANALYSIS OF THE RESULTS AND DISCUSSION
The main result from the modelling of our photometric and spectral observations of 10 ultrashort-period eclipsing binaries is determination of (i) initial epoch T 0 of all targets; (ii) orbital period of NSVS 2729229; (iii) spectral types and temperatures; (iv) orbital inclination, mass ratio, temperatures, and relative radii of stellar components.
The analysis of the obtained parameter values led to the following results:
-
(1) NSVS 2175434 and SWASP 0746+22 exhibit total eclipses and their photometric mass ratios are reliable (Terrell & Wilson Reference Terrell and Wilson2005).
-
(2) Eight targets (NSVS 2175434, NSVS 2607629, NSVS 5038135, NSVS 8040227, NSVS 9747584, SWASP 0746+22, NSVS 2729229, NSVS 10632802) have overcontact configurations (Figure 5, Table 5) with considerable fill-out factor. NSVS 4876238 and ASAS 0718-03 are almost contact configuration (with small fill-out factor) with partial eclipses and their photometric mass ratios are worse determined.
-
(3) NSVS 4876238 is rare case of detached ultrashort-period binary, similar to BX Tri (Dimitrov & Kjurkchieva Reference Dimitrov and Kjurkchieva2010) and BW3 V38 (Maceroni & Montalbán Reference Maceroni and Montalbán2004).
-
(4) The temperature differences between the target components are small (up to 400 K) that is expected for overcontact systems. But the almost equal component temperatures of the (slightly) detached binary NSVS 4876238 were not so expected. This result may mean that NSVS 4876238 is a binary oscillating around a marginal-contact state predicted by the thermal relaxation theory (Qian Reference Qian2002).
-
(5) All stellar components are K dwarfs excluding the primary of NSVS 2607629 which is slightly hotter star. The components of NSVS 9747584, NSVS 4876238, and NSVS 2729229 are very late K dwarfs (the secondary of NSVS 2729229 is rather M dwarf).
-
(6) Light curve asymmetries of seven targets were reproduced by cool spots on the side surfaces of their primary components. Surface inhomogeneities are also appearance of stellar activity of late stars.
-
(7) NSVS 2729229 shows emission in Hα line (Figure 3). This is another appearance (besides the spot) of stellar activity of this cool star.
-
(8) We searched for empirical relations of the global stellar parameters of our ultrashort-period overcontact binaries. It turned out that there is not well-apparent relation mass–luminosity (Figure 6). It may be approximated roughly by the linear function L ≈ 0.32 M. In opposite, the relation mass–radius is quite precise (Figure 5) and could be described by the linear function R = 0.33 + 0.55 M.
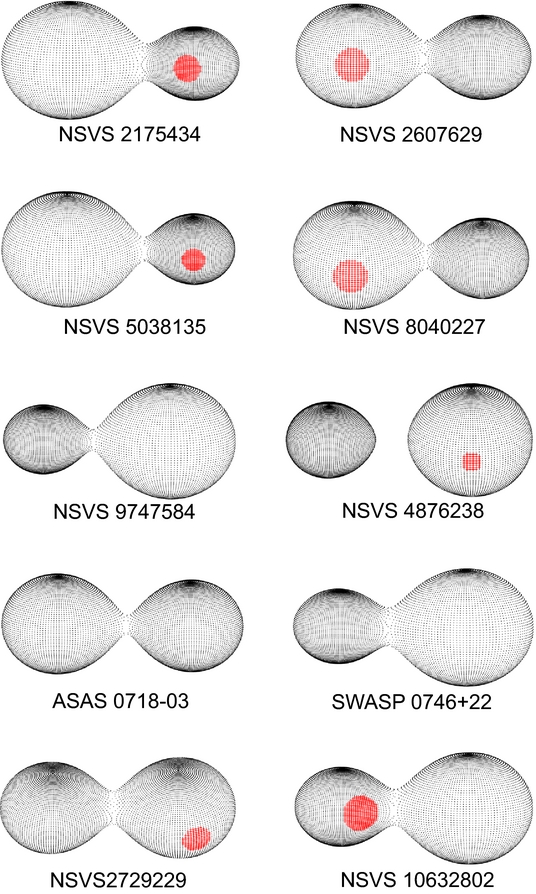
Figure 5. 3D configurations of the targets
Figure 6. Relations mass–luminosity and mass–radius for the target components.
Two of our targets were studied earlier and we present comparison with our results.
-
(i) Pribulla et al. (Reference Pribulla, Vanko and Hambalek2009) carried out RI photometric observations of ASAS 0718-03 and obtained estimations of some parameters: mass ratio q ~ 0.65; orbital inclination i ~ 76.8°; fill-out factor f ~ 0. For comparison, by detailed light curve solution of our VI data, we obtained for the same parameters: q = 0.83; i = 76.4°; f = 0.08. The different values of mass ratio support insensitivity of the light curve solutions of the partially eclipsed binaries to this parameter.
-
(ii) Based on BVR c light curves and their modelling Gurol & Michel (Reference Gurol and Michel2017) obtained parameters of NSVS 2607629 (first row of Table 7). The comparison with our values (second row of Table 7) illustrates the duplicity of the solutions of overcontact systems: A-subtype configuration corresponding to q (1) < 1 and r (1) 1 > r 2 (1) and W-subtype configuration corresponding to q (2) ≈ 1/q (1) > 1, r (2) 1 ≈ r 2 (1) and r (2) 2 ≈ r 1 (1). The supposition about such W/A ambiguity was made first by van Hamme (Reference Van Hamme1982) and Lapasset & Claria (Reference Lapasset and Claria1986) who noted that sometimes both A and W configurations can fit well the photometric observations and the right choice between the two solutions requires spectral mass ratio.
Table 7. Two sets of parameters of NSVS 2607629.

Another difference between the two solutions of NSVS 2607629 was that Gurol & Michel (Reference Gurol and Michel2017) used a large hot spot on the secondary component while we obtained considerably smaller cool spot on the primary. Although the two solutions reproduce the same effect (the light at the first quadrature to be smaller than that at the second quadrature, true for the two runs of observations, in 2011 march and in 2016 March), we assume that cool spots are physically more reasonable for late stars. This result illustrates another ambiguity of the light curve solution: hot spot on the primary has the same effect as appropriate cool spot on the secondary and viceversa.
5 CONCLUSION
We presented photometric and low-resolution spectral observations of 10 ultrashort-period eclipsing binaries. The target temperatures were determined by their spectral type while the orbital inclination and mass ratio as well as relative radii and temperatures of stellar components were derived from the light curve solutions. The stellar masses, radii, and luminosities were estimated by the empirical relation for short- and ultrashort-period binaries.
This study enriches the poor statistics of ultrashort-period binaries with known parameters and improved our understanding of these late stars. Target NSVS 2729229 from our sample of 10 ultrashort-period binaries is newly discovered member of this family.
ACKNOWLEDGEMENTS
This study is supported by projects DN 08-20/2016, DN 08-1/2016, and DM 08-02/2016 of National Science Foundation of Bulgarian Ministry of education and science as well as by projects RD 08-102 and RD 08-80 of Shumen University. The authors are very grateful to the anonymous referee for the valuable recommendations and notes.
This research makes use of the SIMBAD database, VizieR service, and Aladin previewer operated at CDS, Strasbourg, France, and NASA’s Astrophysics Data System Abstract Service.


