


Excessive sugar intake, particularly added and free sugars, has become an emerging public health issue. Observational and experimental studies indicate an association between high intake of added/free sugars and excessive adiposity(Reference Te Morenga, Mallard and Mann1), along with an increased risk for dental caries(Reference Moynihan2). Cardiometabolic risk factors(Reference Te Morenga, Mallard and Mann1,Reference Yang, Zhang and Gregg3) , namely type 2 diabetes(Reference Greenwood, Threapleton and Evans4), are also other outcomes related to higher dietary sugar intake reported in the previous literature.
There is a growing concern that high intake of added sugars is associated with poorer diet quality(Reference Louie and Tapsell5) and might contribute to an unbalanced energy expenditure(Reference Ruiz, Rodriguez and Valero6) and excessive energy intake(Reference Te Morenga, Mallard and Mann1,Reference Azaïs-Braesco, Sluik and Maillot7–Reference Kahn and Sievenpiper9) . Currently, the most consistent association reported by prospective cohort studies and randomized controlled trials appears to be the relationship between sugar-sweetened beverages and weight gain, both in children and adults(Reference Zheng, Rangan and Olsen10–Reference Gibson13).
Total sugars comprise all mono- and disaccharides present in foods. According to the European Food Safety Authority, added sugars comprise all sugars which are added to food by the manufacturer, cook or consumer, such as glucose, fructose, sucrose, starch hydrolysates and other isolated sugar preparations(14). Free sugars are defined, according to the WHO, as added sugars plus sugars naturally present in honey, syrups, fruit juices and fruit juice concentrates(15,16) .
In 2015, WHO updated the dietary guidelines and recommended ‘reducing the intake of free sugars to less than 10 % of total energy intake (E%)’ as a ‘strong recommendation’, along with a ‘conditional recommendation’ to further reduce free sugars to below 5 E%(16). Within a European framework, the Scientific Advisory Committee on Nutrition in the UK advised that ‘the average population intake of free sugars should not exceed 5 E%’(17) and the Nordic Nutrition Recommendations 2012 advised an intake of added sugars below 10 E%(18). More recently, in the USA, the Scientific Report of the 2015 Dietary Guidelines Advisory Committee also suggested the maximum intake from added sugars as 10 E%(19).
Sugar intake estimates across the world have been assessed, but there is still little comparable descriptive information on added and free sugar intakes and their main food sources in different population age groups. In part, this may be due to the lack of a systematic approach to estimate dietary sugar intake in the population and added/free sugar content in foods, along with the inconsistency on ‘sugars’ definitions across surveys and differences in study design(Reference Newens and Walton20,Reference Mis, Braegger and Bronsky21) . Hence, most food composition tables do not present information on added or free sugar content of foods, nor do labels on pre-packaged foods have such descriptive information.
Therefore, using data from a national dietary survey and considering a harmonized methodology of dietary assessment(22), we aimed to estimate total, added and free sugar intakes, adherence to current recommendations, the main food sources by age group, as well as characteristics associated with consumption of naturally present sugars and free sugars.
Methods
Participants
The protocol and methodology of the National Food, Nutrition and Physical Activity Survey of the Portuguese Population (IAN-AF 2015–2016) have been described in detail elsewhere(Reference Lopes, Torres and Oliveira23,Reference Carla, Duarte and Andreia24) .
In summary, this survey was conducted among the Portuguese population, covering infants (3 months old) to the elderly (84 years old). Selection of participants was performed by multistage sampling: stratification by the seven Portuguese Statistical Geographical Regions (NUTSII); random selection of a Primary Health Care Unit in each region; and random selection of individuals in each Primary Health Care Unit, according to sex and age group (<1 year, 1–2 years, 3–9 years, 10–17 years, 18–34 years, 35–64 years, 65–74 years, 75–84 years).
A total of 6553 individuals were evaluated at the first appointment (participation rate among eligible individuals: 33·4 %). From those, 5811 completed two dietary assessment interviews 8–15 d apart (participation rate among eligible individuals: 29·6 %; 40·0 % in children and adolescents; 21·0 % in adults and the elderly). As previously described(Reference Lopes, Torres and Oliveira23), individuals who refused to participate were older (over 65 years: 22 v. 13 %) and had a lower educational level (over 12 years: 19 v. 27 %). No significant differences were observed for the other tested variables: fruit and vegetable consumption (≥5 portions/d: 18·6 v. 18·1 %), practise of regular leisure-time or physical activity (33 v. 39 %) and obesity (12·4 v. 12·7 %).
Dietary assessment
Data were collected from October 2015 to September 2016, through 12 months in order to minimize seasonal variability of food consumption, by trained interviewers, using an electronic platform (You eAT&Move). The eAT24 (Electronic Assessment Tool for 24-hours recall) software(Reference Carla, Duarte and Andreia24) was used to collect detailed consumption data by 24 h recall or food diaries. Face-to-face interviews were conducted at a health-care centre or at the participant’s home (according to their choice).
In children aged under 10 years, dietary intake was obtained by two non-consecutive one-day food diaries (8–15 d apart), filled in by the main caregiver(s), which was followed by a face-to-face interview with parents or other caregivers for supplementary details related to food description and quantification. For the other age groups, two non-consecutive 24 h recalls were obtained (8–15 d apart). For those aged 10 to 14 years, the 24 h recall was administered in the presence of one of the parents or other caregiver. For adolescents from 15 to 17 years old, the presence of a parent or other caregiver was not mandatory.
Food consumption data were collected with the eAT24 software, which allowed to collect detailed information and quantification of foods, recipes and food supplements reported, and to convert foods into nutrients at the ingredient level. Food portions were estimated by using: a photographic method (a digital colour food picture book was developed based on a previously validated one(Reference Vilela, Lopes and Guiomar25)); a predefined household measure list; the weight or volume method; the standard unit method (for foods with various standard weights); and a list of default mean portions when participants selected the option ‘unknown’ to quantify a specific food item. All foods reported by the participants were categorized into food groups and subgroups for analysis purposes. The definition of each food group and the food items included are described in detail in the online supplementary material (Supplemental Table S1). Food items and disaggregated recipes were organized by food group, except for sweets, cakes and soups.
Estimation of total, added and free sugars
The eAT24 software converted foods into nutrients, using by default the Portuguese Food Composition Table(26), originally composed by 962 food items. The composition database was continuously adapted during the survey fieldwork, using mostly data from the European Food Information Resource (EuroFIR) network databases(Reference Roe, Bell and Oseredczuk27). When data were missing, direct analyses of nutritional composition from Portuguese foods and food labelling information were used, subsequently ending up with 2479 food items, 1696 recipes and 117 food supplement items.
In the current study, the term ‘total sugars’ comprises all mono- and disaccharides (such as glucose, fructose, lactose, sucrose and maltose). The values of total sugars for each food item were those included in the food composition database. Nutritional composition of recipes was calculated according to the methodology proposed by EuroFIR(Reference Reinivuo, Bell and Ovaskainen28). Each recipe reported was disaggregated into food ingredients which were listed in the food composition database and total sugar estimation of recipes was based on raw edible portions of ingredients.
To estimate added sugar content, the systematic method proposed by Louie et al.(Reference Louie, Moshtaghian and Boylan29) was adopted. Hence, added sugar content of each food item was assigned according to the following steps: (step 1) to foods with 0 g of total sugars, 0 g of added sugars was assigned (n 625); (step 2) to foods unprocessed or minimally processed with no added sugars, 0 g of added sugars was assigned (n 949); (step 3) to foods that contained minimal amounts of naturally occurring sugars, 100 % of total sugars was assigned as added sugars (n 47); (step 4) calculated a formula based on a standard recipe used in the food composition database, where added sugar contents of all ingredients were available from the previous steps (n 352); (step 5) calculated a formula based on comparison with values from the unsweetened variety (n 65); (step 10) if estimation of added sugars was impossible from the previous steps, 50 % of total sugars was assigned as added sugars (n 118). Steps 6–9 were not used for the purpose of the present study. Lactose present in foods counted as naturally present sugars. To estimate free sugars, we used the WHO definition(15,16) , considering added sugars plus all sugars naturally present in honey, syrups, fruit juices and fruit juice concentrates. The food sources of sugar dietary intake were estimated using food groups based on disaggregated food items, except for sweets, cakes and soups.
Other variables
As part of the survey, participants were asked about demographic and socio-economic characteristics, health-related data and lifestyle behavioural characteristics. The following demographic and socio-economic characteristics were used at the present study: sex, age, educational level (none, primary or preparatory/middle school or secondary/tertiary), degree of urbanization (predominantly urban/mostly urban/predominantly rural) and household size (≤3 members/ ≥4 members). Household income in Euros per month was used only in adults (total budget of all household members). In children and adolescents, having siblings was also assessed, and parental educational level was considered according to the parent with the highest educational level.
Health-related data and lifestyle behavioural characteristics were considered only in participants above 3 years of age. Health-related data were assessed as having a chronic disease previously diagnosed and, solely in adults, participant’s own perception of health was considered. The lifestyle behavioural characteristics assessed among adults were current smoking status and alcohol consumption in grams per day. At all ages, leisure-time or physical activity was also assessed and classified as ‘yes’ or ‘no’. Parents reported whether their child had regular practise of physical activity (excluding school activities) and adults self-reported whether they had regular practise of programmed leisure-time physical activity.
Statistical analysis
Intakes of total, added and free sugars (in grams per day), contribution to total energy intake (E%) and proportion of adherence to recommendations were estimated by sex, age and geographical region. All the estimates were calculated according to the complex sampling design, using the weighting of the sample. SPADE software(Reference Dekkers, Verkaik-Kloosterman and van Rossum30) was used to estimate usual intakes of sugars from the two-day dietary assessments, adjusting for intraindividual day-to-day variability and using survey weights, to assure nationally representative estimates. For comparisons across sex, age groups and geographical regions, estimates were standardized for the proportions of sex and age considering the distribution of the Portuguese population.
To evaluate the association of usual mean intake of naturally present sugars (calculated as total sugars minus free sugars) and intake of free sugars with demographic, socio-economic, health-related data and behavioural characteristics, linear mixed-effects models’ regression coefficients (β) and respective percentile bootstrap 95 % CI were obtained by using bootstrapping weights with 200 replications. Three separate models were fitted: crude model (model 1); a second model adjusted for sex, age and education level (model 2); and to assess if energy intake mediates the effect of the tested variables on the intakes of naturally present sugars and free sugars, a third model additionally adjusted for total energy intake (model 3) was performed. The R software version 3.4.0 for Windows(31) was used. A significance level of 5 % was assumed.
Results
Total, added and free sugar usual intakes
Table 1 shows the total, added and free sugar intakes in the overall population and according to sex, age and geographical region. The mean daily intake of total sugars was 84·3 g/d (18·5 E%). The mean daily intake of added sugars was 32·1 g/d and of free sugars was 35·3 g/d, contributing 6·8 and 7·5 E%, respectively. Mean values of total, added and free sugar intakes (g/d) were higher in males than in females, although the contribution to total energy intake was higher among females. Compared with other age groups, children aged <5 years showed the highest energy contribution from total sugars (28·0 E%). The mean daily intake and percentage of energy from added and free sugars peaked in children aged 5–9 years (9·6 E% from added and 10·6 E% from free sugars) and adolescents aged 10–17 years (9·5 E% from added and 10·5 E% from free sugars). The intakes did not differ significantly by geographical region.
Table 1 Usual mean and median intakes (g/d) of total, added and free sugars and contribution to the total energy intake (E%) in the population, by sex, age group and region; National Food, Nutrition and Physical Activity Survey (IAN-AF 2015–2016), Portugal (n 5811)

P25, 25th percentile; P75, 75th percentile.
Usual intake modelling (SPADE method) was used to construct the usual intake distributions.
Adherence to recommendations
Table 2 shows the adherence to dietary recommendations. Approximately, 81 % of the Portuguese population adhered to the recommendation of an intake below 10 E% for added sugars and no remarkable differences were found by sex. Regarding free sugars <10 E%, 73·7 % of females and 79·9 % of males adhered, while the percentage of adherence to <5 E% was considerably smaller, both for females (28·3 %) and males (39·8 %). Except for children aged <5 years (who showed higher adherence than children aged 5–9 years and adolescents), adherence to recommendations increased according to age. The lowest adherence to both recommendations of added and free sugars <10 E% or <5 E% was found in children aged 5–9 years (59·3 and 51·6 %, respectively) and adolescents aged 10–17 years (60·0 and 51·3 %, respectively), while the elderly showed the highest percentage of adherence (94·7 and 92·6 %, respectively). The proportion of adherence to recommendations for added or free sugars was similar across the different studied groups.
Table 2 Adherence (%) to added and free sugar recommendations by sex, age group and region; National Food, Nutrition and Physical Activity Survey (IAN-AF 2015–2016), Portugal (n 5811)

E%, percentage of total energy intake.
Usual intake modelling (SPADE method) was used to construct the usual intake distributions.
* Dietary Guidelines for Americans (2015–2020)(19) and value recommended by the Nordic Nutrition Recommendations (2012)(18).
† Strong recommendation by WHO (2015) for free sugars(16).
‡ Conditional recommendation by WHO (2015)(16) and recommendation by the Scientific Advisory Committee on Nutrition (2015)(17) for free sugars.
§ Values weighted for the Portuguese population distribution and standardized for age.
‖ Values weighted for the Portuguese population distribution and standardized for sex.
¶ Values weighted for the Portuguese population distribution, standardized for sex and for age.
Food sources of total, added and free sugars
Figure 1 shows the main food sources of the total, added and free sugar intakes in the Portuguese population. Fresh fruit was the leading dietary source of total sugars (21·9 %), whereas table sugar, sweets and soft drinks were the main dietary sources of added and free sugars.

Fig. 1 Contribution (%) of the main dietary sources to the daily intake of (a) total sugars, added sugars and (c) free sugars in the population; National Food, Nutrition and Physical Activity Survey (IAN-AF 2015–2016), Portugal (n 5811). Food groups: ‘Milkshakes’ includes drinks made of milk and chocolate milk. ‘Milk alternatives’ includes rice, soya, almond, rye and coconut drinks; vegan or soya yoghurt and desserts. ‘Meat and charcuterie’ includes red and white meat, ham, chorizo, bacon, sausages. ‘Breakfast cereals’ includes wholegrain cereals; wheat flakes; chocolate cereals; fruit and fibre cereals; granola; cereal bars. ‘Cakes’ includes all types of cakes and pastry (homemade or confectioner’s). ‘Sweets’ includes honey; syrups; liquid sugar; all types of candies, gums; chocolate snacks; ice creams. ‘Table sugar’ includes glucose, white and brown sugar added by the participant
Table 3 presents the percentage contributions of the main food sources of the total, added and free sugars by age group. In children and adults, fresh fruit made the highest contribution to total sugar intake. Nevertheless, in adolescents the major dietary source of total sugars was soft drinks. Soft drinks also led the top contribution of added and free sugars in adolescents’ intakes and were a major contributor at all ages, but mostly at younger ones.
Table 3 Main dietary sources of total, added and free sugars (%), by age group; National Food, Nutrition and Physical Activity Survey (IAN-AF 2015–2016), Portugal (n 5811)
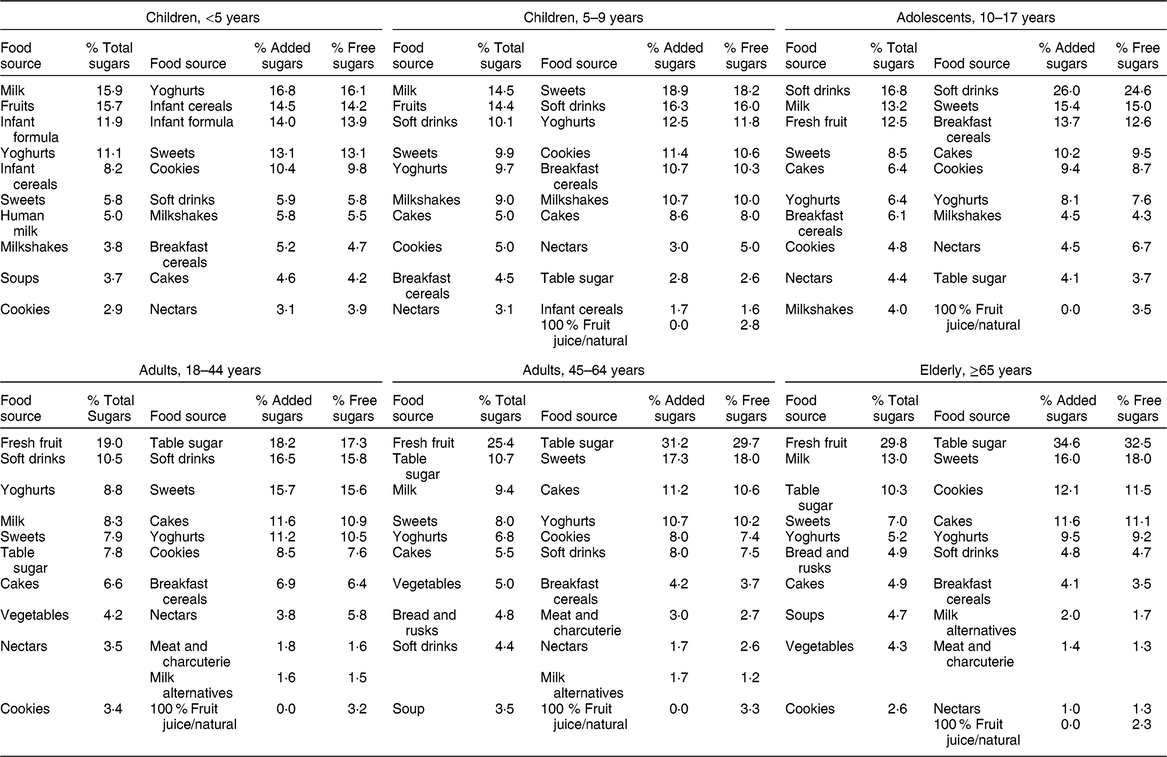
Food groups: ‘Milkshakes’ includes drinks made of milk and chocolate milk. ‘Milk alternatives’ includes rice, soya, almond, rye and coconut drinks; soya yoghurt and desserts. ‘Meat and charcuterie’ includes red, white meat, ham, chorizo, bacon, sausages. ‘Infant cereals’ include baby cereal with/without milk; single grain and multigrain. ‘Breakfast cereals’ includes wholegrain cereals; wheat flakes; chocolate cereals; fruit and fibre cereals; granola; cereal bars. ‘Cakes’ includes all types of cakes and pastry (homemade or confectioner’s). ‘Sweets’ includes honey; syrups; liquid sugar; candies, gums; chocolate snacks; ice creams. ‘Table sugar’ includes glucose, white and brown sugar added by the participant.
Throughout all ages, despite having different percentage contributions at each age group, yoghurts not only contributed to total sugar intake, but were also the major dietary source of added and free sugars in children aged <5 years, the third major dietary source in children aged 5–9 years and a substantial dietary source in adults. Breakfast cereals showed different contributions depending on age. In adults and the elderly, table sugar accounted for above 30 % of added and free sugar intakes (approximately). Across all ages, sweets, cakes and cookies were in the top food sources of added and free sugars.
Associated characteristics of naturally present and free sugar usual intakes
Table 4 illustrates the three models fitted to estimate associations between the studied variables among children and adolescents. In multivariate analysis (model 2), boys and those with more educated parents had significantly higher intake of naturally present sugars and lower intake of free sugars.
Table 4 Association of usual mean intakes of naturally present sugars and free sugars with demographic, socio-economic, health-related data and behavioural characteristics in children and adolescents; National Food, Nutrition and Physical Activity Survey (IAN-AF 2015–2016), Portugal

β, regression coefficient; Ref., reference category.
Usual intake modelling (SPADE method) was used to construct the usual intake distributions. CI were estimated using bootstrapping. Statistically significant associations are highlighted in bold.
* Model 1: crude model.
† Model 2: adjusted for sex, age and parental education level.
‡ Model 3: adjusted for sex, age, parental education level and energy intake.
Increasing age among children and adolescents was positively associated with free sugar intake. The practise of leisure-time/physical activity was significantly and positively associated with intake of naturally present sugars (β = 3·6; 95 % CI 1·5, 5·5); however, no statistical difference was found regarding free sugar intake. Children and adolescents living in households with four or more members were associated with lower intake of free sugars (β = –3·7; 95 % CI –6·6, –0·4). No associations were found with the degree of urbanization, having siblings or a chronic disease. After additional adjustment for energy intake (model 3), the effect was similar for the same variables, except for the consumption of free sugars by sex, age and physical activity. The higher consumption in boys and adolescents was energy-dependent, as was the lower intake of free sugars in those who practised physical activity.
Table 5 illustrates the three models fitted to estimate associations between the studied variables among adults and the elderly. Naturally present sugar and free sugar intakes were higher in males, although the association was dependent on energy intake. Also, naturally present sugar intake was positively associated with age, while an inverse association was found regarding free sugar intake. Intake of natural sugars was also positively associated with higher education level and income, but no statistical differences were found concerning free sugar intake, except in individuals with middle school and secondary education (β = 5·9; 95 % CI 3·8, 7·8). Having a chronic disease was negatively associated with both natural and free sugar intakes (β = –2·3; 95 % CI –4·2, –0·7 and β = –4·2; 95 % CI –6·1, –2·5, respectively).
Table 5 Association of usual mean intakes of naturally present sugars and free sugars with demographic, socio-economic, health-related data and behavioural characteristics in adults and the elderly; National Food, Nutrition and Physical Activity Survey (IAN-AF 2015–2016), Portugal
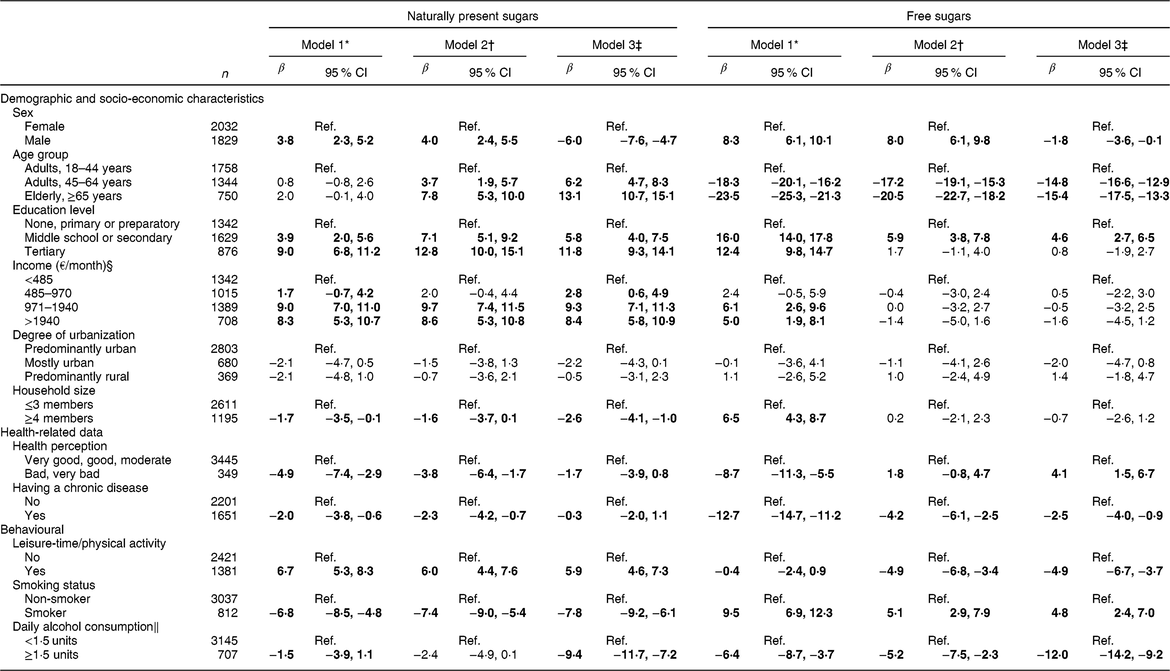
β, regression coefficient; Ref., reference category.
Usual intake modelling (SPADE method) was used to construct the usual intake distributions. CI were estimated using bootstrapping.
Statistically significant associations are highlighted in bold.
* Model 1: crude model.
† Model 2: adjusted for sex, age and education level.
‡ Model 3: adjusted for sex, age, education level and energy intake
§ Income was not adjusted for education level.
‖ 1·5 units correspond to 12 g/d for females and 24 g/d for males.
Individuals who practised leisure-time/physical activity regularly showed significantly higher intake of naturally present sugars (model 3: β = 5·9; 95 % CI 4·6, 7·3) and significantly lower intake of free sugars (model 3: β = –4·9; 95 % CI –6·7, –3·7), independently of energy. Smokers showed lower intake of naturally present sugars and higher intake of free sugars. Daily alcohol consumption above 1·5 units was inversely associated with free sugars (β = –5·2; 95 % CI –7·5, –2·3), partially dependent on energy intake (model 3: β = –12·0; 95 % CI –14·2, –9·2).
Discussion
The present national dietary survey has provided for the first time a detailed description of the total, added and free sugar intakes in a representative sample of the Portuguese general population, considering a systematic methodology to estimate added sugar content and using a harmonized methodology of dietary assessment.
The intake of total sugars accounted for 18·5 E%, added sugars 6·8 E% and free sugars 7·5 E%. Despite the difficulty of comparing results between dietary surveys due to different methods of dietary analysis and assessment, our findings are in accordance with studies performed over the past years in Spain and the Netherlands. In the Spanish population (ANIBES study)(Reference Ruiz, Rodriguez and Valero6), from 9 to 75 years of age, total sugars contributed 17·0 E% and added/free sugars contributed 7·3 E%. In the Dutch population(Reference Sluik32), from 7 to 69 years of age, the mean contribution was slightly higher: total sugars accounted for 22 E%, 12 E% from added sugars and 14 E% from free sugars.
In the present study, the mean total, added and free sugar intakes (g/d) were higher in males, but this difference disappeared when the contribution to total energy intake was considered. School-aged children, including children aged 5–9 years and adolescents aged 10–17 years, showed the highest percentage of total energy intake from added sugars (9·6 and 9·5 E%, respectively) and free sugars (10·6 and 10·5 E%, respectively). From adults aged 18–44 years to the elderly, the contributions of total, added and free sugars to total energy intake declined with age. These reported trends are aligned with those previously described in a review of total and added sugar consumption across the world(Reference Newens and Walton20), although added sugar intake was estimated only in five studies.
Regarding the main sources of sugar intake by age group, infants and young children (<5 years) had the highest energy contribution from total sugars (28 E%) achieved mainly from milk, fruit, infant formula and yoghurts. Beyond this age, the main food sources of total sugars changed, along with the initiation of a broader variety of foods and drinks in the diet. Then, in children from 5 years of age to adolescence, processed foods, such as soft drinks and sweets, in addition to breakfast cereals in adolescents, increased their contribution. This might justify the significant lower intake of naturally present sugars and higher intake of free sugars of Portuguese adolescents, when compared with other age groups.
Regarding the free sugar intake, in children aged <5 years, yoghurts, infant cereals and formulas were the main food sources of free sugars, while in children aged 5–9 years and adolescents aged 10–17 years, the main food sources were sweets and soft drinks. Even though we adopted different age categories than other studies, we found similarities in foods contributing the most to added and free sugar intakes. In the Spanish population, the main sources of free sugars in children and adolescents were chocolates, soft drinks, bakery/pastry, yoghurt/fermented milk and juices and nectars, while in the elderly table sugar was also the main contributor(Reference Ruiz, Rodriguez and Valero6). Likewise, sugar-sweetened beverages (including soft drinks, lemonades, energy drinks) were described as one of the major contributors to free sugar intake in the Dutch National Food Consumption Survey (mostly in children) and to added sugar intake in the Australian National Children Nutrition and Physical Activity Survey(Reference Sluik32,Reference Louie, Moshtaghian and Rangan33) , along with cakes, biscuits, pastries, butter-based products, sugar and sweet spreads. In the current study, in adults and the elderly, table sugar represented the major contributor of energy from added and free sugars (approximately 30–35 %), along with soft drinks in young adults and sweets in individuals aged more than 45 years.
Foods items such as yoghurts, nectars and milkshakes/chocolate milk were also listed in the main sources of added and free sugars throughout most of the age categories. It could be hypothesized that those foods could be perceived as healthy choices by the population, despite the contribution to energy from added and free sugars they may contain. These findings reinforce the importance of interventions regarding food labelling, by clarifying information on total and added sugars, and also by educating consumers on how to interpret food labels.
Regarding the recommendations, almost 90 % of the Portuguese population adhered to <10 E% from added sugars, 76 % adhered to <10 E% from free sugars and only one-third adhered to <5 E% from free sugars. Considering the ‘conditional recommendation’ by WHO (<5 E% from free sugars), we evidenced a substantial drop in adherence in all age groups and geographical regions.
However, in comparison with other countries, the Portuguese population had higher percentage of adherence to free sugars <10 E% than the Dutch population, which observed 19 % of adherence(Reference Sluik32). Considering only adults, a larger percentage of adherence to free sugars intake <10 E% was found among Portuguese adults (69–85 %) compared with 59 % of adherence among French adults (aged 18–79 years)(Reference Lluch, Maillot and Gazan34). Across all recommendations, the percentage of adherence was consistently lower in children and adolescents compared with adults and the elderly, as reported in other studies(Reference Sluik32,Reference Lei, Rangan and Flood35) . Nevertheless, Portuguese children and adolescents still showed higher values of adherence to free sugars intake of <10 E% compared with Australian children from 2 to 6 years old (18 %)(Reference Louie, Moshtaghian and Rangan33) and Dutch children and adolescents from 7 to 18 years (5 %)(Reference Sluik32).
Our findings showed that parental educational level was associated with higher intake of naturally present sugars and lower intake of free sugars in children and adolescents. Previous studies among children showed that sugar intake from fruit/fruit products was lower for those whose mothers had lower education level(Reference Pawellek, Grote and Theurich36,Reference Kranz and Siega-Riz37) . Similarly, among Portuguese adults, less educated individuals also showed higher inadequate consumption of fruits and vegetables(Reference Oliveira, Maia and Lopes38,Reference Moreira and Padrão39) . Additionally, we found a higher intake of naturally present sugars and lower intake of free sugars among more educated individuals. These results seem to enhance the important role of socio-economic indicators, such as education level and income, not only in the consumption of naturally present sugars, but also free sugar intake.
Healthier behavioural characteristics were associated with a lower intake of sugar. In the present study, adults who practised regular leisure-time or physical activity and smoked less had higher intake of naturally present sugars and lower intake of free sugars. Similarly, in a recent population-based study among Finnish adults, the practise of physical activity was also associated with higher intakes of naturally occurring sucrose and fructose(Reference Kaartinen, Similä and Kanerva40). These results are aligned with previous knowledge regarding the role of healthy lifestyle behaviours and dietary choices(Reference Khan and Sievenpiper41–Reference Gibson and Neate43). Conversely, in the present study, adults with higher alcohol intake had lower consumption of free sugars. This could be related to the direct replacement of soft drinks by alcoholic beverages, as also suggested by other studies(Reference Kaartinen, Similä and Kanerva40,Reference Moshtaghian, Louie and Charlton44,Reference Sieri, Krogh and Saieva45) .
The present study was strengthened by the data obtained from a representative sample of the Portuguese population and by the use of individual intake data from a national dietary survey, following a harmonized methodology of dietary assessment proposed by the European Food Safety Authority(22). Despite the low participation rate, results were similar to other dietary surveys’ participation rate. Even though non-participants were older and less educated, as usual in dietary surveys, for the main areas of interest of this survey (diet, physical activity and nutritional status) the differences were not significant. In order to assure representativeness, participants were compared with the distribution of the population living in Portugal according to information from the National Statistics Institute (Census 2011-INE). As previously described(Reference Carla, Duarte and Andreia24), after weighting, the final sample of the IAN-AF showed a similar distribution to the population living in Portugal, with the largest difference not exceeding three percentage points in relation to the distribution of the age group of the very elderly (75–84 years). The possibility of using an electronic platform (eAT24) to collect dietary intake, integrating the conversion of nutrients at ingredient level and the food classification system FoodEx, constitutes a strength of the present study. Also, the use of five methods to estimate food portions (as previously described) increased the precision of our estimates. Moreover, the use of two non-consecutive 24 h recalls for dietary assessment allows to consider the intraindividual variation and the estimation of usual intake using a proper statistical software (SPADE).
To estimate total sugar intake, we used by default the Portuguese Food Composition Table(26). When information was insufficient, we used other food composition tables and food labelling. Even though we have accessed food composition tables included in the EuroFIR FoodEXplorer(Reference Roe, Bell and Oseredczuk27), we cannot discard as a limitation the different food formulations between countries. Nutritional composition of recipes was calculated according to the methodology proposed by EuroFIR(Reference Reinivuo, Bell and Ovaskainen28) and each recipe was disaggregated at the ingredient level, which allowed to harmonize data estimation. Since information available from packaging was used, the constant changes in product reformulation and ingredients should be considered, which can lead to under- and overestimation of added sugar content in foods. Despite these limitations, using a systematic methodology to estimate added sugar content as proposed by Louie et al.(Reference Louie, Moshtaghian and Boylan29), including the estimation at ingredient level, was a major strength in the present study.
Conclusions
Mean estimates of total, added and free sugar intakes in the Portuguese population and the main food sources varied notably according to age. School-aged children, including children aged 5–9 years and adolescents aged 10–17 years, had the lowest adherence to added and free sugar recommendations and processed foods, such as soft drinks, yoghurts, breakfast cereals, cakes and sweets, were their main food contributors. Considering the present results that added and free sugar intakes were mainly due to manufactured or processed foods, intervention measures must be planned towards decreasing added sugar intake by reformulation of sugar content in foods and reduction of consumption of energy-dense food/drinks, such as soft drinks, but also yoghurts and breakfast cereals, particularly among children and adolescents. The development of food policies like Portugal has been implementing(46), towards taxation of sugary beverages and regulating the availability of food with high sugar content in schools and health units, should be reinforced and continuously promoted.
Parents’ higher education level contributed to higher intake of naturally present sugars and lower intake of free sugars in children and adolescents, as did the regular practise of leisure-time or physical activity and having a chronic disease in adults. Inversely, smokers showed higher free sugar intake.
Taking into account that only 34 % of the general population adhered to the WHO recommendation to further limit free sugar intake to <5 E%, intervention measures and food policies, specifically on added and free sugars, should be a priority encompassing all age groups, targeting the main food contributors, and considering the role of social and lifestyle-behavioural characteristics of the population.
Acknowledgements
Acknowledgements: The project had institutional support from the General Directorate of Health (DGS), the Regional Health Administration Departments, the Central Administration of the Health System (ACSS) and from the European Food Safety Authority (CFT/EFSA/DCM/2012/01-C03). The authors gratefully acknowledge these institutions, all persons involved in the different phases of the survey, all researchers and all participants enrolled. Financial support: The IAN-AF 2015–2016 was supported by funding received from the EEA Grants Program, Public Health Initiatives (PT06-000088SI3). Funders had no role in the design, analysis or writing of this article. Conflict of interest: None. Authorship: The authors’ contributions to the study were as follows. A.R.M. conducted the statistical analysis, interpretation of data and wrote the draft of the initial manuscript. M.S. and D.C. contributed to data statistical analysis and interpretation. L.L. and S.V. contributed to data acquisition, analysis and interpretation. E.R. contributed to the interpretation and discussion of results. C.L., D.T. and A.O. were responsible for the study design, coordinated the data collection and contributed to the discussion of results. C.L. conceptualized the study design and critically supervised data interpretation. All authors approved the final version to be published. Ethics of human subject participation: This study was conducted according to the guidelines laid down in the Declaration of Helsinki and all procedures involving human subjects were approved by the National Commission for Data Protection, the Ethical Committee of the Institute of Public Health of the University of Porto and the Ethical Committee of each Regional Health Administration. Written informed consent was obtained from all participants or their legal caregiver (for children and adolescents below 18 years old). In the case of adolescents aged 10–17 years, both caregivers and participants signed the written informed consent.
Supplementary material
To view supplementary material for this article, please visit https://doi.org/10.1017/S1368980019002519.
Appendix
Members of the IAN-AF Consortium
Carla Lopes, Andreia Oliveira, Milton Severo (Faculty of Medicine, University of Porto); Duarte Torres, Sara Rodrigues (Faculty of Nutrition and Food Sciences, University of Porto); Elisabete Ramos, Sofia Vilela (EPIUnit, Institute of Public Health, University of Porto); Sofia Guiomar, Luísa Oliveira (National Health Institute Doutor Ricardo Jorge); Violeta Alarcão, Paulo Nicola (Institute of Preventive Medicine and Public Health, Faculty of Medicine, University of Lisbon); Jorge Mota (CIAFEL, Faculty of Sports, University of Porto); Pedro Teixeira (Faculty of Human Kinetics, CIPER, University of Lisbon), Simão Soares (SilicoLife, Lda, Portugal); Lene Frost Andersen (Faculty of Medicine, University of Oslo).


