


Malnutrition in every clinical form poses a significant risk to children’s health( Reference de Onis and Branca 1 ). Alarming trends in overweight/obesity of school-aged children in many developed and transitional countries usually focus attention on this public health issue( Reference Ng, Fleming and Robinson 2 ). On the other hand, thinness (or underweight) in children has received less scientific scrutiny although it may affect child health, growth and well-being in various ways, including nutritional deficiencies, menstrual irregularity, impaired immune system, osteoporosis, anaemia, anorexia nervosa, hypotension, and decreased cognitive and work capacity( Reference Scrimshaw and SanGiovanni 3 – Reference Nyaradi, Li and Hickling 6 ). Parents of thin children reported them to be more often treated adversely or feel insecure because of their weight, to visit the general practitioner and have abdominal pain and allergies more frequently, and to have lower scores on general health in comparison to their normal-weight peers( Reference van Grieken, Renders and Wijtzes 7 ). In addition, underweight children demonstrate poorer global health and special health-care needs, with this tendency particularly noticeable in young children( Reference Wake, Clifford and Patton 8 ). However, it was not until 2007 that Cole and co-workers proposed international cut-offs for childhood overweight, obesity and thinness (International Obesity Task Force (IOTF))( Reference Cole, Flegal and Nicholls 9 ), thus providing a criterion that makes thinness prevalence countable and comparable. According to national studies using the original or revised IOTF reference system( Reference Cole and Lobstein 10 ), thinness prevalence in young school-aged children in European countries ranges from 1–4 % in Portugal, France and Ireland( Reference Péneau, Salanave and Rolland-Cachera 11 – Reference Heinen, Murrin and Daly 13 ), to 6–9 % in England, Sweden, the Netherlands and Lithuania( Reference Moraeus, Lissner and Sjöberg 14 – Reference Nilsen, Yngve and Sjöberg 18 ). As reported by the IDEFICS study( Reference Ahrens, Pigeot and Pohlabeln 19 ), thinness prevalence in children aged 2·0–9·9 years from eight European countries (Sweden, Germany, Hungary, Italy, Cyprus, Spain, Belgium, Estonia) varied from 5·7 % in Italian boys to 16·6 % in Hungarian girls. Cross-sectional data on thinness prevalence trends are rather consistent, with a slight decline of thinness rate observed in most European countries since the onset of the obesity epidemic( Reference Pearce, Rougeaux and Law 15 , Reference Schönbeck, van Dommelen and HiraSing 16 , Reference Boddy, Hackett and Stratton 20 – Reference Chirita-Emandi, Barbu and Cinteza 22 ). However, limited data are currently available for thinness prevalence among school-aged children in Eastern European countries, considering the dynamic transitional changes in this region that may affect different aspects of children’s health( Reference Pillas, Marmot and Naicker 23 ). Therefore, the main aim of the present cross-sectional study was to collect reliable and internationally comparable data about the prevalence of thinness among 6–9-year-old schoolchildren in Serbia.
Methods
The present study is based on the first WHO European Childhood Obesity Surveillance Initiative (COSI) in Serbia, which took place during the 2015/16 school year. A detailed description of the Serbian WHO COSI protocol, as well as data on overweight and obesity prevalence, are available elsewhere( Reference Djordjic, Radisavljevic and Milanovic 24 ). Briefly, a cross-sectional study targeted schoolchildren aged 6·00–8·99 years, with cluster sampling employed and primary schools and classes selected randomly from the list of all primary schools provided by the education ministry. Stratification by the school district was applied to ensure a nationally representative sample of primary schools. Trained examiners carried out anthropometric measurements in private rooms in participating schools. Children were measured without shoes, in their everyday clothes, with body weight additionally corrected for an average weight of the clothes worn. Body weight was measured to the nearest 0·1 kg with portable digital scales (Omron BF214, Kyoto, Japan), while height was measured to the nearest 0·1 cm using a portable stadiometer (Seca 213, Hamburg, Germany). BMI was calculated as the weight in kilograms divided by the square of height in metres. For the current report, children were classified as thin according to the revised IOTF cut-off points( Reference Cole and Lobstein 10 ). These international gender- and age-specific cut-offs for BMI are defined to pass through BMI of 16, 17 and 18·5 kg/m2 at age 18 years (thinness grade I, II and III, respectively). Gender and age differences between groups for thinness prevalence were analysed by Pearson’s χ 2 test for categorical variables. In addition, we compared the prevalence of thinness among children living in regions with different economic development (North–South divide), attending schools with and without a health-focused educational programme, or having meals available in school settings. The risk of being thin is presented with OR and 95 % CI. Statistical significance was established at P<0·05. The data were analysed using the statistical software package IBM SPSS Statistics version 21.0.
Results
During the data collection phase, we recruited 5102 children from forty-two public primary schools. After initial quality control, 214 children were excluded due to missing or inaccurate data. In addition, twenty-seven children younger than 6·00 years or older than 8·99 years were eliminated because they were out of the target age range. In total, 4861 children (95·3 % of initial sample) entered the final analysis. Study participants’ characteristics are given in Table 1.
Table 1 Characteristics of the study sample of 6–9-year-old schoolchildren in Serbia (n 4861), September–November 2015

* At the NUTS 1 (Nomenclature of territorial units for statistics) level of European Union territorial classification, Serbia is divided into two regions: Serbia – North (comprising Vojvodina and Belgrade) and Serbia – South (comprising other three regions).
The overall prevalence of thinness was 9·6 (95 % CI 8·8, 10·4) %. Thinness grade I (mild thinness) was clearly the largest category with a prevalence of 7·6 (95 % CI 6·9, 8·4) %, thinness grade II (moderate thinness) was present in 1·7 (95 % CI 1·4, 2·1) % of children, while thinness grade III (severe thinness) was found in 0·3 (95 % CI 0·2, 0·5) % of children (Fig. 1). No significant difference in thinness prevalence was found between boys and girls in the 6 years age group (P= 0·43). Significant gender differences were demonstrated in 7 years and 8 years age groups, with girls more frequently thin than boys (P=0·00 and P=0·02, respectively). In addition, no significant differences were reported between boys of different ages (P=0·73) nor between girls across the age groups (P=0·60). The highest prevalence of thinness was reported in 8-year-old girls (11·9 %, 95 % CI 9·5, 14·3 %), while 7-year-old boys demonstrated the lowest prevalence of thinness in our cohort (7·6 %, 95 % CI 6·1, 9·1 %). As for the relative risk, unadjusted OR indicated a significant risk of being thin for female children (1·44 times higher risk compared with male children) and children attending schools where no health-focused educational programmes were available (1·57 times more likely to be thin than peers enrolled in schools with such programmes). In addition, OR for thinness tended to be higher in children living in an economically disadvantaged region of South Serbia (1·23 times higher compared with North Serbia residents). No significant risk was associated with certain age group or school meals availability (Table 2).
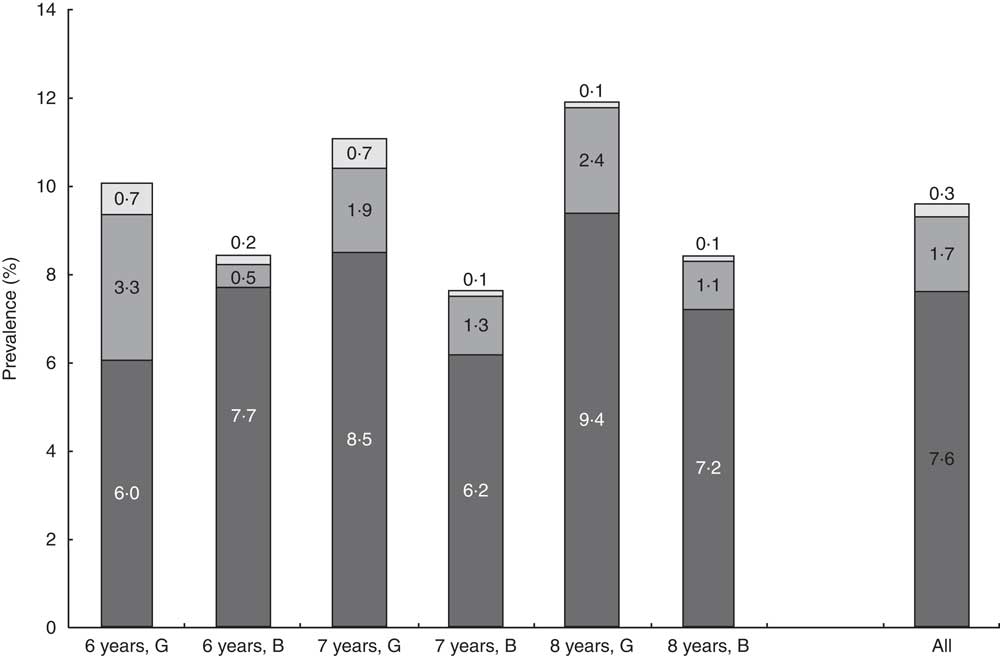
Fig. 1 Prevalence rates (%) of thinness among 6–9-year-old schoolchildren in Serbia (n 4861), September–November 2015. Thinness grades are defined as International Obesity Task Force gender- and age-specific cut-offs for BMI (calculated as weight in kilograms divided by the square of height in metres) to pass through BMI of 18·5 kg/m2 (grade I or mild thinness; ![]() ), 17·0 kg/m2 (grade II or moderate thinness;
), 17·0 kg/m2 (grade II or moderate thinness; ![]() ) and 16·0 kg/m2 (grade III or severe thinness;
) and 16·0 kg/m2 (grade III or severe thinness; ![]() ) at age 18 years (G, girls; B, boys)
) at age 18 years (G, girls; B, boys)
Table 2 OR for thinness based on International Obesity Task Force criteria, by age, gender, living place, and health-focused educational programme and meal availability in school settings, among 6–9-year-old schoolchildren in Serbia (n 4861), September–November 2015

Ref., reference category.
Discussion
In the era of the obesity pandemic, thinness has received less consideration in public health research. Nevertheless, it might have significant health consequences in children and adolescents. Since there was a lack of reliable and internationally comparable data on thinness in young Serbian school-aged children, the present study has focused on thinness prevalence in a nationally representative sample of Serbian 6–9-year-old schoolchildren according to revised IOTF cut-offs. A rather high overall prevalence of thinness reported in our study (9·6 %) highlights this malnutrition disorder as an emerging health issue that should trigger public health policies to tackle thinness, especially in girls of young age.
In comparison to thinness prevalence in several high-income European countries( Reference Péneau, Salanave and Rolland-Cachera 11 – Reference Schönbeck, van Dommelen and HiraSing 16 , Reference Nilsen, Yngve and Sjöberg 18 ), Australia( Reference O’Dea and Dibley 25 ) and USA( Reference Lazzeri, Rossi and Kelly 21 ), the prevalence of thinness in Serbia is moderately higher, and it is particularly applicable to girls. It appears that over 10 % of Serbian girls in all age groups were underweight, with up to 4 % of girls suffering from moderate and severe thinness. The present study was not designed to explore the attributable causes of thinness among children, although the high prevalence is likely driven by possible exposure of all children (girls in particular) to specific sociocultural pressures to achieve and maintain a thin figure even at the youngest age. Cultural ideals of beauty and physical attractiveness stereotypes may be reaching very young girls through popular videos and books, and thus affect their body image, development of body dissatisfaction and drive for thinness( Reference Herbozo, Tantleff-Dunn and Gokee-Larose 26 ). A thinness bias has been found in pre-adolescent girls, with thinness being associated with femininity, good looks and other positive personality traits( Reference Herbozo, Tantleff-Dunn and Gokee-Larose 26 , Reference Pine 27 ). Another reason that drives high underweight rates among Serbian schoolchildren might be related to poor nutritional habits shaped by low economic power or poor dietary education of affected families, which requires further investigation. Our results confirm that living in an economically disadvantaged region may expose children to a higher risk of being thin, since participants from economically disadvantaged South Serbia were more likely to be underweight than their counterparts from the North region. Regional disparities in Serbia have increased significantly during the socio-economic transition, resulting in a North–South divide( Reference Mijacic and Paunovic 28 ). Furthermore, it turned out that school health education programmes might have a protective effect in terms of thinness prevalence, probably by teaching children about healthy lifestyle behaviours, including diet. In addition, some cases of undernutrition might be explained by the intergenerational transmission of thinness, where children’s low weight-for-height is within the healthy zone and is related to hereditary factors( Reference Whitaker, Jarvis and Boniface 29 ). Moreover, we found that the percentage of thin children in our study (9·6 %) exceeded the percentage of obese children (6·9 %) reported previously in the same cohort of boys and girls( Reference Djordjic, Radisavljevic and Milanovic 24 ), suggesting a possible double burden of childhood malnutrition at the population level in Serbia. This double burden of malnutrition implies the coexistence of both undernutrition (thinness) and overnutrition (overweight and obesity) in the same population across the life course( Reference Shrimpton and Rokx 30 ). Actually, thinness and obesity may share very similar causal mechanisms related to diet, physical activity and sociodemographic environment( Reference Doak, Adair and Monteiro 31 ). As a middle-income country with its economy in transition, Serbia might fit the profile of a country susceptible to the double burden of malnutrition( Reference Doak, Adair and Bentley 32 ), so integrated action tackling all forms of malnutrition should be provided by health and public authorities.
However, several limitations must be considered when the present study’s findings are interpreted. The study population included only 6–9-year-old children; it remains unknown whether thinness prevalence changes throughout childhood. With a limited number of variables evaluated, possible causes or cofactors of thinness profiles in children could not be reliably identified. In particular, future studies should correlate additional indices of malnutrition (e.g. biochemical markers, advanced anthropometric variables) with children’s health profiles (e.g. blood pressure, lipid profiles, dietary habits, level of physical activity) to understand health risks associated with thinness in young age.
Conclusion
In conclusion, it appears that thinness affects approximately one in ten Serbian schoolchildren aged 6–9 years, with young girls and children from economically disadvantaged areas particularly susceptible to this condition. Our study describes the overlooked yet rather prevalent phenomenon of childhood thinness in Serbia, and invites the collection of additional information from other resources to address research gaps. A systematic approach to health education and regular monitoring of thinness prevalence in children is of special importance given the role undernutrition in this age has for modelling the long-term health of individuals and populations.
Acknowledgements
Financial support: This study was partly supported by the WHO (grant number 2015-540940); the Serbian Ministry of Education, Science and Technological Development (grant number 175037); the Provincial Secretariat for Higher Education and Scientific Research (grant number 114-451-710); the Faculty of Sport and PE, University of Novi Sad (2016 Annual Award); and the Center for Health, Exercise and Sports Sciences (grant number 16-08-15). The funders had no role in the design, analysis or writing of this article. Conflict of interest: None. Authorship: V.D. acquired the data, conducted data analysis, interpreted the data, assisted in the conception of the article and drafted the article. J.J. assisted in the conception and design of the study, interpreted the data and revised the article critically for important intellectual content. S.R. acquired the data, assisted in the interpretation of the data and revised the article critically for important intellectual content. I.M. acquired the data, assisted in the interpretation of the data and revised the article critically for important intellectual content. P.B. acquired the data, assisted in the interpretation of the data and revised the article critically for important intellectual content. S.M.O. conceived and designed the study, acquired the data, assisted in the analysis and interpretation of the data, drafted the article and revised the article critically. Ethics of human subject participation: This study was conducted according to the guidelines laid down in the Declaration of Helsinki and all procedures involving human subjects were approved by the Serbian Ministry of Health and Ministry of Education, Science and Technological Development (337-00-00122/2015-06). Written informed parental consent was obtained prior to the child’s enrolment in the study.


