Good nutrition is essential for health, equity and prosperity. Collectively, dietary risk factors (high salt intake, high saturated fat intake, low vegetable and fruit intake, and excess energy intake) accounted for 11 % of health loss in New Zealand in 2006( 1 ). Similarly, the leading risk factors for disease in Australia are related to diet( 2 ). Improving diets and reducing sodium intakes were identified as priorities for global action at the United Nations High-Level Meeting on non-communicable diseases in 2011( Reference Beaglehole, Bonita and Alleyne 3 ) and recommended by the WHO as ‘best buys’ for reducing deaths from non-communicable diseases( Reference Zarocostas 4 ).
Processed foods contribute approximately three-quarters of dietary energy and nutrients consumed in high-income countries( Reference Slimani, Deharveng and Southgate 5 ). Therefore, consumer food choices and the nutritional composition of processed foods have substantial potential to influence dietary intakes. Effective front-of-pack nutrition labelling has been identified as a potentially cost-effective strategy to improve population diets( Reference Gortmaker, Swinburn and Levy 6 ) and health claims, which are present on substantial numbers of packaged, processed food products in New Zealand( Reference Devi, Eyles and Rayner 7 ) and Australia( Reference Hughes, Wellard and Lin 8 ), increase consumers’ perceptions of the healthiness of packaged and processed foods( Reference Kozup, Creyer and Burton 9 , Reference Van Trijpa and Van der Lansa 10 ).
Nutrient profile models can be used to classify foods as ‘healthy’ and ‘less healthy’ based on their nutritional content( Reference Scarborough, Arambepola and Kaur 11 ). Nutrient profiling has been used to support nutrition labelling schemes, regulate the broadcast advertising of foods to children and regulate health claims on foods( Reference Scarborough, Arambepola and Kaur 11 , Reference Sacks, Rayner and Stockley 12 ). In 2009, a nutrient profiling model was proposed by the European Commission for regulation of nutrition and health claims on foods in the EU( 13 ).
In January 2013, a new Standard was introduced in Australia and New Zealand to regulate nutrition content claims and health claims on food labels and in advertisements( 14 ). The standard specifies that nutrition content claims are claims about the content of certain nutrients or substances in a food, for example ‘low in fat’ or ‘good source of calcium’, while health claims refer to a relationship between a food and health. Food Standards Australia New Zealand (FSANZ) developed the Nutrient Profiling Scoring Criterion (NPSC) system to determine the eligibility of foods to make health claims. The NPSC model is based on the UK Ofcom model used to differentiate foods on the basis of their nutritional composition in the context of television advertising of foods to children( 15 ). Both models use the same simple across-the-board scoring system where points are awarded on the basis of the nutrient content per 100 g of a food or drink( 15 ). The key difference between the Ofcom and NPSC models is one additional category in the FSANZ model for cheese, edible oils, spreads and butter( 14 ). All foods carrying health claims in Australia and New Zealand must now meet the NPSC except special-purpose foods (infant formula products, infant foods, formulated meal replacements, supplementary sports foods and foods for special medical purposes), which are regulated separately in the Code( 14 ). The use of nutrient profiling to underpin New Zealand and Australia’s health claims standard has been highlighted as an example of effective food policy( 16 ).
In NPSC, each product is first classified into one of three categories: (i) beverages (Category 1); (ii) cheese, oil, margarine and butter (Category 3); and (iii) any food other than those included in the previous two categories (Category 2). The NPSC score is then calculated by allocating baseline points for levels of risk-associated nutrients in a food (energy, saturated fat, total sugars and sodium); V points based on content of fruits, vegetables, nuts and legumes; protein points (P points); and, in the case of Category 2 and 3 foods, fibre points (F points). The final score is derived using the formula: baseline points – (V points) – (P points) – (F points) (see Appendix)( Reference Dunford, Trevena and Goodsell 17 ). To qualify to display a health claim, Category 1 foods must have NPSC score less than 1, Category 2 foods must score less than 4, and Category 3 foods must score less than 28. Lower scores therefore indicate a healthier product.
Our aim was to assess and compare the nutrient profile of packaged foods and non-alcoholic beverages available for sale in Australia and New Zealand in 2012. Eligibility to carry health claims and the relationship between NPSC score and the nutritional content of foods and beverages were evaluated.
Methods
Nutritional composition data were collected from labels of all packaged foods and non-alcoholic beverages available in two Auckland and four Sydney supermarkets during field surveys undertaken between February and December 2012. Standardised data collection methods were developed for an international collaborative project to compare and monitor the nutritional composition of packaged foods and have been described in detail previously( Reference Dunford, Webster and Metzler 18 ). Supermarkets chosen for data collection in 2012 represented the biggest retail brands of the main supermarket retailers in each country( Reference Euromonitor 19 ) (Foodstuffs (54 % of grocery market share) and Progressive Enterprises (38 % market share) in New Zealand; and Coles (25 %), Woolworths (32 %), Aldi (4 %) and IGA (9 %) in Australia) and were the largest stores in Auckland and Sydney for each brand. Nutrition information was recorded for all packaged supermarket products displaying a nutrition information panel, using smartphone tools developed by investigators( 20 ). Products that did not carry a nutrition information panel, for example fresh produce, bakery and delicatessen items, were excluded. For each packaged product with a nutrition information panel, the brand name, product name and content of energy, protein, total fat, saturated fat, total carbohydrate, sugars, fibre and sodium per 100 g or 100 ml were recorded electronically and subsequently converted to a Microsoft® Excel spreadsheet for analysis. Nutritional information recorded was for products ‘as sold’ (i.e. not ‘as prepared’) in order to maximise within-category product comparability (since preparation instructions vary and can have a significant impact on final composition); different pack sizes of the same product were recorded as separate items.
All data were checked and cleaned before analysis. Any data entry errors identified by value range and random sample checks were corrected using source data (product photographs). Special-purpose foods, alcohol, vitamins and supplements, and products that could not be categorised using the defined food classification system (mostly baking ingredients) were excluded from analysis. The FSANZ NPSC was used to determine a nutrient profile score for each product (Appendix). Following this, each product was assigned to one of fourteen predefined food groups using a classification system developed by the Global Food Monitoring Group( Reference Dunford, Webster and Metzler 18 ). Products were also allocated a variable specifying whether or not they qualified to carry a health claim.
Statistical analyses were performed using the SAS statistical software package version 9·3. All statistical tests were two-tailed and a 5 % significance level maintained throughout the analyses. Proportions of foods meeting NPSC threshold values were summarised and mean NPSC scores were calculated. Data were analysed by country and food group and combined for overall analysis. Linear mixed models containing both fixed and random effects were used to evaluate the association between mean NPSC score and total energy, saturated fat, sugars and sodium, adjusting for country, food category and potential interaction effects.
Results
NPSC scores were derived for a total of 23 596 packaged foods and non-alcoholic beverages: 15 219 in Australia and 8377 in New Zealand. The smaller number of New Zealand products likely reflects fewer local supermarket retailers (just two retailers account for 92 % of combined grocery market share( Reference Euromonitor 19 )) and thus more homogeneity in food products compared with Australia. Food groups containing the largest number of products were (packaged) fruit and vegetables (n 3140, 13 % of total), dairy (n 3014, 13 %) and sauces and spreads (n 2894, 12 %; Table 1).
Table 1 Mean Nutrient Profiling Scoring Criterion (NPSC) scores of Australian and New Zealand packaged foods and beverages. Nutritional composition data were collected from labels of all packaged foods and non-alcoholic beverages (n 23 596) available in four Sydney and two Auckland supermarkets during field surveys undertaken between February and December 2012

Nutrient profile of packaged foods available in Australia and New Zealand
The mean NPSC score for all Australian and New Zealand foods combined was 7·0 (range −17 to 53; Table 1). NPSC Category 1 products (beverages) had the lowest scores (mean −0·6, range −9 to 28) and Category 3 products (cheese, edible oils, spreads, margarines and butter) had the highest (mean 25·9, range 6 to 53). NPSC Category 2, which contained 86 % (n 20 313) of products, had a mean score of 7·6 (range −17 to 34). By food group, edible oils had the highest mean NPSC score (25·9), followed by confectionery (16·2). Non-alcoholic beverages had the lowest mean score (−0·8), followed by fruit and vegetables (−0·3). Mean NPSC score for all New Zealand foods combined was 7·8 (range −16 to 45), while for Australia it was 6·6 (−17 to 53). Across both countries, the food group with the largest variability in scores was edible oils (range 6 to 53), followed by dairy (−7 to 36) and sauces and spreads (−9 to 34).
Proportion of foods eligible to carry health claims
Forty-five per cent of all products met their respective NPSC threshold value, rendering them eligible to display health claims (Table 2). All eggs met the threshold value (100 %). Convenience foods (soup, pizza and ready meals; 82·5 %) and fish and seafood products (80 %) were the next highest, while confectionery (9 %) and sugars, honey and related products (5 %) were the categories where fewest products met the threshold. Less than one-third of products in three staple food categories were eligible to carry health claims: dairy (32 %); meat and meat products (28 %); and bread and bakery (27·5 %).
Table 2 Number of packaged food products meeting the Nutrient Profiling Scoring Criterion (NPSC) threshold and being eligible to carry health claims. Nutritional composition data were collected from labels of all packaged foods and non-alcoholic beverages (n 23 596) available in four Sydney and two Auckland supermarkets during field surveys undertaken between February and December 2012
Forty-seven per cent of Australian and 41 % of New Zealand foods met their respective NPSC threshold value. The largest differences between Australia and New Zealand were for non-alcoholic beverages (64 % and 48 %, respectively, met the NPSC threshold), snack foods (26 % and 12 %, respectively) and meat and meat products (32 % and 22·5 %, respectively; Fig. 1).
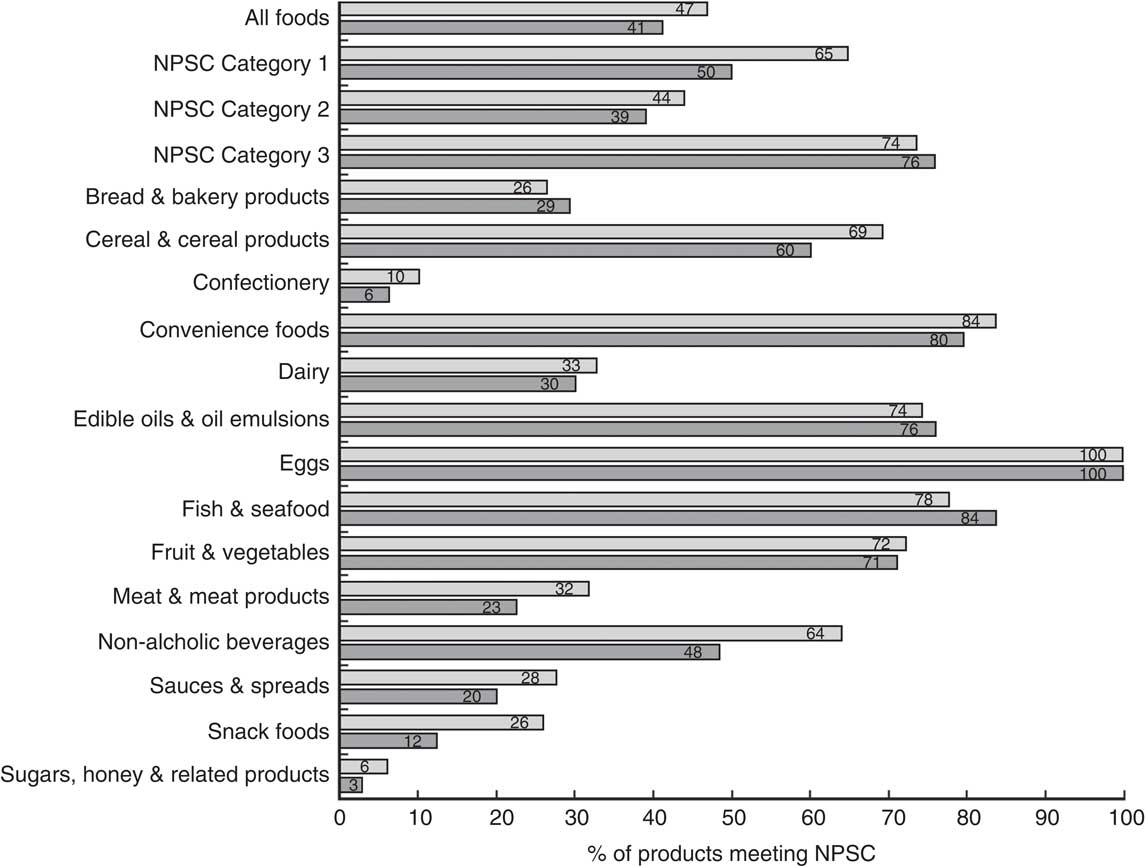
Fig. 1 Proportion of Australian (![]() ) and New Zealand (
) and New Zealand (![]() ) packaged food products meeting the Nutrient Profiling Scoring Criterion (NPSC) threshold and being eligible to carry health claims. Nutritional composition data were collected from labels of all packaged foods and non-alcoholic beverages (n 23 596) available in four Sydney and two Auckland supermarkets during field surveys undertaken between February and December 2012
) packaged food products meeting the Nutrient Profiling Scoring Criterion (NPSC) threshold and being eligible to carry health claims. Nutritional composition data were collected from labels of all packaged foods and non-alcoholic beverages (n 23 596) available in four Sydney and two Auckland supermarkets during field surveys undertaken between February and December 2012
Association between changes in nutrient profile scores and energy, saturated fat, sugars and sodium
The mean energy content of all Australian and New Zealand foods combined was 1080 kJ/100 g (range 0 to 4156 kJ/100 g) and 217 kJ/100 g (range 0 to 2420 kJ/100 g) for non-alcoholic beverages, respectively. The mean saturated fat content of all products was 4·6 g/100 g (range 0 to 98 g/100 g), and mean sugar and sodium contents were 14·3 g/100 g (range 0 to 100 g/100 g) and 447 mg/100 g (range 0 to 19 670 mg/100 g), respectively.
Strong associations were found between variation in the NPSC score and the mean nutrient contents of foods (all P values <0·0001). Model estimates showed that a two-unit higher NPSC score (i.e. towards a less healthy nutritional profile) was associated with a higher mean energy density of 78 (95 % CI 76, 79) kJ/100 g. Similarly, a two-unit higher NPSC score was associated with higher saturated fat (0·95 (95 % CI 0·94, 0·97) g/100 g), total sugars (1·5 (95 % CI 1·5, 1·6) g/100 g) and sodium (66 (95 % CI 63, 69) mg/100 g) contents.
Discussion
Less than half of all packaged food products in Australian and New Zealand supermarkets were classified as healthy according to the FSANZ NPSC system. Across both countries, the mean NPSC score for all foods was 7·0; mean NPSC score for Australian foods (6·6) was lower (i.e. better nutrient profile) than for New Zealand (7·8). As such, Australia had a higher proportion of foods classified as healthy compared with New Zealand (47 % v. 41 %), largely driven by the healthier nutritional profile of Australian non-alcoholic beverages, snack foods, and meat and meat products.
The finding that less than half of the Australian and New Zealand packaged foods sampled were eligible to carry health claims has important implications given that a previous Australian survey found a high prevalence of nutrition content and health claims in particular product categories, including sports drinks (92 %), energy drinks (84 %), sports bars (57 %) and breakfast cereals (54 %)( Reference Williams, Yeatman and Ridges 21 ). A more recent survey found that two-thirds of products in three categories (non-alcoholic beverages, breakfast cereals and cereal bars) carried at least one health or nutrition content claim( Reference Hughes, Wellard and Lin 8 ). Of particular concern is that 31 % of Australian products carrying health claims in 2011 did not meet NPSC criteria, suggesting a marked discrepancy between the current practice and the Standard( Reference Hughes, Wellard and Lin 8 ). Past research has shown that many consumers rely on displayed health claims to guide their food choices despite widespread concerns regarding their accuracy( Reference Hughes, Wellard and Lin 8 ). As such, the present study demonstrates a crucial need for regular, independent monitoring of the nutritional composition and labelling of Australian and New Zealand foods to ensure adherence to the Standard( Reference Neal, Sacks and Swinburn 22 , Reference Rayner, Wood and Lawrence 23 ).
We found positive associations between NPSC score and energy, saturated fat, sugar and sodium contents of packaged foods, in both unadjusted and adjusted models: for every two-unit higher NPSC score (i.e. towards a less healthy score) there was a corresponding increase in mean energy, saturated fat, sugar and sodium. This finding, along with the notable variability in product nutritional composition within food categories, indicates significant opportunity to improve population diets through product reformulation with a view to lowering energy density and levels of saturated fat, sugar and sodium. The UK salt reduction programme, which incorporated a major food reformulation strategy, is an example of the positive effects product reformulation programmes can have on nutritional content of foods and population diets( Reference Wyness, Butriss and Stanner 24 ).
In addition to product reformulation, strategies are needed to help guide consumers towards healthier food choices. One potential approach is interpretive, front-of-pack nutrition labelling systems that provide simple, ‘at-a-glance’ nutrition information to consumers. Studies that modelled the potential impact of interpretive, front-of-pack nutrition labels on consumer food choices and obesity rates suggest that it would be a highly cost-effective obesity-prevention strategy( Reference Gortmaker, Swinburn and Levy 6 , Reference Sacks, Veerman and Moodie 25 ). Australia and New Zealand recently announced plans to introduce a new voluntary Health Star Rating front-of-pack nutrition labelling system( 26 ). The scheme assigns a star rating to foods ranging from half (least healthy) to five (most healthy) stars based on the underpinning Health Star Rating nutrient profiling model, a modification of the NPSC( 26 ). The Health Star Rating nutrient profiling system was based on the NPSC in order to ensure consistency between the two systems. Comprehensive monitoring of the food supply in both countries will be important to evaluate uptake of the voluntary Health Star Rating labels by the food industry and assess the impact of both nutrition labels and health claims on food product reformulation and consumption over time( Reference Neal, Sacks and Swinburn 22 , Reference Rayner, Wood and Lawrence 23 ).
Our investigation has several strengths. We conducted systematic surveys of packaged food products available for sale in Australia and New Zealand in 2012. Our data were collected from major supermarkets in the largest city in each country. We used standardised methods for data collection in both countries to ensure comparability and consistency of the food composition data collected and we used a regionally accepted standard (FSANZ NPSC) to define the nutritional quality of foods and their eligibility to carry health claims. In addition to assessing and comparing the nutrient profile of packaged foods in Australia and New Zealand, we also assessed their eligibility to carry health claims and quantified the relationship between nutrient profile score and nutritional content. Our study provides a comprehensive analysis of the packaged food supply in both countries prior to widespread introduction of health claims on foods and a new front-of-pack nutrition labelling system, and thus provides a useful baseline from which to evaluate the impact of these initiatives on the food supply. Future analyses will assess changes in the nutrient profile of the food supply over time for both countries.
Some limitations should be considered. Since only six supermarkets in total were sampled across both countries, our sample may not be representative of the true distribution of food products across the two countries. However, data collection occurred in major supermarkets in the largest city of each country, so our data are likely to represent a reliable sample of the packaged food products available in supermarkets throughout Australia and New Zealand. Further evidence to support this assumption comes from the FoodSwitch smartphone app which was launched in Australia and New Zealand using the food and nutrient databases employed for these analyses( Reference Dunford, Trevena and Goodsell 17 ). App users achieved a 70–80 % success rate for food product scans, suggesting our data represent the majority of supermarket products available. Our analysis also included only packaged food products and fresh meat and produce were excluded. As such, the full food product range in Australia and New Zealand is likely to be healthier than our analysis suggests. Previous analyses of New Zealand supermarket sales reported that such variable-weight products accounted for approximately 10 % of transactions( Reference Hamilton, Ni Mhurchu and Priest 27 ), thus packaged foods likely reflect a maximum of 90 % of supermarket food products. We did not stratify our analysis by level of processing( Reference Monteiro, Levy and Claro 28 ); however, other New Zealand research has demonstrated a significant positive association between level of food processing and NPSC scores. Ultra-processed foods were found to have higher (less healthy) NPSC scores (11·63) than culinary processed foods (7·95) and minimally processed foods (3·27; CM Luiten, WE Waterlander, H Eyles et al., unpublished data).
We used NPSC to assess the nutritional quality of foods; however, a number of different nutrient profiling systems exist. Some are ‘category specific’ such as that proposed for regulation of nutrition and health claims in the EU( 13 ) while others, such as the UK Ofcom and FSANZ NPSC, are ‘across the board’ and rate all foods on the same scale( Reference Scarborough, Arambepola and Kaur 11 ). A recent analysis of breakfast cereals in Germany and Norway used five different nutrient profiling models and found that 4–28 % of cereals met respective model thresholds for health claims( Reference Maschkowski, Hartmann and Hoffmann 29 ). Despite differences in model design and algorithms, the NPSC and EU models appeared broadly similar in classifications (NPSC classified 23 % of breakfast cereals as eligible to carry health claims compared with 28 % using the EU model) and both classified more foods as eligible to carry health claims than the Keyhole, Ofcom and IWG models( Reference Maschkowski, Hartmann and Hoffmann 29 ).
Finally, our analyses were based on nutritional data provided on product nutrition information panels, which we assumed were accurate. Although we believe most companies endeavour to report correct nutritional values, this may not always be the case( 30 , 31 ). Some companies use accredited laboratories for analysis, but limited validation data make it difficult to know whether there are significant errors in the information provided on nutrition information panels( 31 ).
Conclusions
Our investigation, based on systematic surveys of food composition in two countries, provides a comprehensive, quantitative assessment of the nutrient profile of packaged foods in Australia and New Zealand. Our findings provide the basis for investigation of changes in food composition over time, comparisons with other countries around the globe, and evaluation of the impact of national policies on food availability and composition. In addition, our results highlight the few healthy packaged food choices currently available in key staple food categories. This work informs national and regional efforts to improve population diets.
Acknowledgements
Acknowledgements: The authors would like to thank Ashmita Chand and Mark Derksen for collecting and entering supermarket data in New Zealand supermarkets. Financial support: R.B. was supported by a University of Auckland summer studentship (funded by the University of Auckland). H.E. was supported by a Heart Foundation of New Zealand fellowship (#1463). B.N. is supported by an Australian Research Council Future Fellowship (DP100100295) and a National Health and Medical Research Council of Australia Senior Research Fellowship (APP100311). The funders had no role in the design, analysis or writing of this article. Conflict of interest: None. Author contributions: C.N.M. formulated the research question, assisted with interpretation of the data and co-wrote the article. R.B. designed the statistical analysis plan, conducted the data analysis and wrote the first draft of the article. Y.J. supervised the data analysis, assisted with interpretation of the data and provided feedback on the article. H.E. supervised the New Zealand supermarket data collections and data entry, assisted with interpretation of the data and provided feedback on the article. E.D. supervised the Australian supermarket data collections and data entry, assisted with interpretation of the data and provided feedback on the article. B.N. designed and is Principal Investigator of the Global Food Monitoring Study, supervised the Australian supermarket data collections, assisted with interpretation of the data and provided feedback on the article. All authors have seen and approved the final version submitted for publication. Ethics of human subject participation: Ethical approval was not required.
Appendix
Nutrient profile score estimation method ( Reference Dunford, Trevena and Goodsell 17 )
Step 1. Determine the NPSC category of the food
-
∙ Category 1=Beverages
-
∙ Category 2=All foods not in Category 3
-
∙ Category 3=Cheese and processed cheese >320 mg Ca/100 g, edible oil, edible oil spread, margarine and butter
Step 2. Calculate baseline points
-
∙ 0–10 points for energy
-
∙ 0–30 points for saturated fat
-
∙ 0–10 points for sugars
-
∙ 0–30 points for sodium
-
∙ Calculate total baseline points=X+X+X+X
Step 3. Calculate modifying points
Fruit and vegetable points (V points; 0, 1, 2, 5 or 8)
-
∙ Formula used: (% non-concentrated FVNL)+(2×% concentrated fruit or vegetables)÷(% non-concentrated FVNL)+(2×% concentrated fruit or vegetables)+(% non-FVNL ingredient)×100/1
Protein points (P points)
-
∙ Calculate protein points (1–5)
Fibre points (F points)
-
∙ Calculate fibre points (1–2)
Step 4. Calculate the final score
Final score=Baseline points – (V points) – (P points) – (F points)
Data availability and imputation for nutrient profile scoring