


According to the 2015–2020 Dietary Guidelines for Americans, individuals should establish healthy eating patterns to reduce their risk for diet-related chronic diseases, such as CVD, type 2 diabetes and obesity(1). However, more than 75 % of American adults consume inadequate amounts of recommended healthy foods, such as fruits, vegetables and whole grains(2). Most also consume more energy than recommended from solid fats and added sugars(2). One way to help people shift to healthier dietary patterns may be to provide supportive environments that facilitate healthy individual decision making and thereby promote chronic disease prevention(Reference Story, Kaphingst and Robinson-O’Brien3–Reference Ashe, Graff and Spector7).
Because the environments in which people live influence their ability to consume healthy foods(Reference Story, Kaphingst and Robinson-O’Brien3–Reference Kettel Khan, Sobush and Keener5), national public health organizations, including the Institute of Medicine and the Centers for Disease Control and Prevention, have indicated that local governments can play an important role in improving access to healthy, affordable foods(4,Reference Kettel Khan, Sobush and Keener5) . One way that local governments can improve access is by offering incentives for the development and operation of food retailers. Governments can do this in a variety of settings, including supermarkets, convenience or corner stores, and farmers’ markets, and tailor strategies to best address their communities’ food access needs(8,Reference Bell, Mora and Hagan9) . Several government strategies, such as tax incentives, technical assistance and grants, have been recommended to alleviate the financial burden of opening new full-service food stores, lack of infrastructure to stock fresh produce and other barriers faced by retailers(4,Reference Kettel Khan, Sobush and Keener5,Reference Ashe, Graff and Spector7,8) . However, only a few studies have assessed local actions to improve access to healthy foods(Reference Albert, Manon and Waldoks10–Reference Chrisinger13) and no previous work has quantified the prevalence of a breadth of local-level strategies across multiple food retail settings nationwide. National data on healthier food retail incentives can be used to set benchmarks, provide relative comparisons for municipalities and identify areas for improvement.
To address this assessment gap, the Centers for Disease Control and Prevention’s Division of Nutrition, Physical Activity, and Obesity conducted the 2014 National Survey of Community-Based Policy and Environmental Supports for Healthy Eating and Active Living (CBS HEAL) to identify the presence of local government policies and practices to support healthy living for community residents. The objective of the present paper is to describe the national prevalence of local government reported incentives to increase access to healthy food options in three major food retail settings overall and by municipality characteristics. The retail settings are new supermarkets and other full-service grocery stores (supermarkets); existing convenience or corner stores; and farmers’ markets, farm stands and green/produce carts (farmers’ markets). These settings have been the focus of public health action as recommended by the Institute of Medicine and the Centers for Disease Control and Prevention(4,8) .
Methods
Sample
The CBS HEAL survey was conducted from May through September 2014. The sampling frame was based on the US Census Bureau’s 2007 Census of Governments, which lists municipal government units, referred to as municipalities, by state(14). Municipalities of fewer than 1000 people were excluded based on a pilot study that showed that smaller communities were less likely to have policies and practices to support healthy eating and active living(Reference Moore, Carlson and Onufrak15). To create a nationally representative sample of municipalities, sampling was then stratified by geographic census region (West, Northeast, South and Midwest)(16) and by percentage of area urbanized (using the 30th percentile as a cut-off point) and sorted by population size with a fixed sampling interval. Among 10 205 eligible municipalities, the final sample included 4484 municipalities.
Survey
The CBS HEAL survey aimed to gather information on the existence of certain policies and practices enacted or implemented by local governments to promote healthy eating and active living. The survey was developed based on literature reviews, scans of existing national policy databases, and input from state health department grantees and other topic experts. Survey items were selected based on applicability across local governments of varying size and geographic locations and feasibility of data collection. Evidence of effectiveness was not used as a specific criterion for inclusion. The survey utilized closed-ended questions to minimize the burden on survey respondents and to enable us to gather consistent, quantitative information across municipalities. Additional information regarding survey development has been described elsewhere(Reference Moore, Carlson and Onufrak15). The survey was sent to city or town managers, planners, or persons with similar responsibilities. Respondents completed the survey with assistance from other municipal officials if needed via a secure website or a paper-based version. The third section of the survey, titled ‘Policies and Practices that Support Access to Healthy Food and Healthy Eating’, contained fourteen questions about government efforts, hereafter referred to as ‘incentives’, to increase access to healthy foods in the three food retail settings: supermarkets, convenience or corner stores, and farmers’ markets (Table 1). Response options for each of the fourteen questions were ‘yes’, ‘no’ and ‘don’t know’.
Table 1 CBS HEAL survey questions about municipal policies and practices that support access to healthy foods in three types of local food retailers, USA, 2014

CBS HEAL, Community-Based Policy and Environmental Supports for Healthy Eating and Active Living.
Statistical analyses
The prevalence of any reported incentive use in each food retail setting was calculated as the number of municipalities responding ‘yes’ to any incentive for that setting divided by the total number of responding municipalities, including those that responded ‘no’ or ‘don’t know’. The prevalence of any reported incentive use in each retail setting and associated 95 % CI were calculated overall and by population size, urban status, geographic region, median education level, poverty prevalence and racial/ethnic composition. Municipal population size was obtained from the 2007 Census of Governments(14) and categorized into three levels: 1000–2499, 2500–49 999 and ≥50 000 people. Municipalities were considered urban if more than 50 % of the population resided in areas defined as urban based on the 2010 US Census Urban Area to Place Relationship File(17). Municipalities were also classified into the four geographic census regions: West, Northeast, South and Midwest(16). The 2009–2013 American Community Survey was used to define median education level of the population aged 25 years or older (≤high-school diploma v. ≥some college), percentage of the population living below the Federal Poverty Line (<20 v. ≥20 % to reflect persistent poverty as defined by US Department of Agriculture(18)) and racial/ethnic composition (≤50 v. >50 % non-Hispanic White) for each municipality(19). The prevalence of individual incentives (e.g. tax incentives, streamlined processes for permits) for each food retail setting was calculated as the number of municipalities responding ‘yes’ to the specified incentive divided by the number of municipalities responding ‘yes’ to any incentive for the specified setting.
Differences in reported use of any incentives in each retail setting by municipality characteristics were assessed using χ 2 tests. A P value of <0·05 defined statistical significance. Separate logistic regression models were run to examine the association of municipality characteristics with any local government reported incentive use in each retail setting adjusted for all municipal characteristics. Because slightly over a quarter of municipalities responded ‘don’t know’ to at least one incentive out of the fourteen (n 518, 27·9 %), a sensitivity analysis was run to test whether results differed when the denominator included only those municipalities that responded ‘no’ to all incentives in a particular setting v. combining ‘no’ and ‘don’t know’ response categories (i.e. the primary analysis). All analyses were weighted to account for the complex survey design, including unequal probabilities of selection and varying non-response rates, using survey procedures in the statistical software package SAS version 9.3.
Results
The survey response rate was 45 % (n 2029). Non-responding municipalities did not differ significantly from responding municipalities by population size or urban status; however, municipalities in the West had the highest response rate (54·6 %) and the Northeast the lowest (38·0 %). For the present analyses, forty-three (2·1 %) of the 2029 municipalities who completed the survey were excluded because they were missing responses to any of the fourteen questions on healthy food retail incentives. An additional 133 municipalities (6·6 %) were excluded because they responded ‘don’t know’ to at least half of the fourteen survey questions on incentives. The final analytic sample size was 1853. The majority of municipalities in this sample had a population of 2500–49 999 people (57·6 %), were urban (72·8 %), had a median education level of some college or higher (56·0 %), had <20 % poverty prevalence (69·7 %) and had a racial/ethnic distribution of >50 % non-Hispanic White (86·9 %; Table 2).
Table 2 Prevalence and 95 % CI of reported use of any incentives among US municipalities to improve access to farmers’ markets, encourage the opening of new supermarkets and help existing stores sell healthier foods, by municipality characteristics, CBS HEAL, USA, 2014
CBS HEAL, Community-Based Policy and Environmental Supports for Healthy Eating and Active Living; FPL, Federal Poverty Level.
Data were weighted to account for the complex survey design and non-response.
* Totals may not sum to 100 % due to rounding.
† Calculated using the χ 2 test for differences in incentive use by municipality characteristics within each food retail setting.
Among municipalities in the USA in 2014, 67·4 % reported using any incentives to support farmers’ markets, farm stands or green/produce carts. Approximately 34·3 % reported any incentives to encourage the opening of new supermarkets or full-service grocery stores. Only 14·0 % reported any incentives to help existing convenience or corner stores sell healthier foods (Table 2).
Prevalence of any reported incentive use in all three food retail settings varied significantly by both municipality size and urban status (P < 0·05). For example, 34·1 % of municipalities with ≥50 000 people reported incentives to help convenience or corner stores sell healthier foods compared with 9·0 % of municipalities with <2500 people. Urban municipalities also reported using incentives significantly more than rural municipalities for all settings. After multivariable adjustment, the municipalities with ≥50 000 people had significantly higher odds of reported incentive use in farmers’ markets (adjusted OR (AOR) = 2·9; 95 % CI 1·7, 4·8), supermarkets (AOR = 1·9; 95 % CI 1·1, 3·1) and convenience or corner stores (AOR = 6·2; 95 % CI 3·4, 11·3) than municipalities with <2500 people. However, the difference between urban and rural municipalities was attenuated and no longer statistically different (Table 3).
Table 3 Adjusted odds ratios of reported use of any incentives among 1853 US municipalities to improve access to farmers, markets, encourage the opening of new supermarkets and help existing stores sell healthier foods, by municipality characteristics, CBS HEAL, USA, 2014

CBS HEAL, Community-Based Policy and Environmental Supports for Healthy Eating and Active Living; AOR, adjusted odds ratio; FPL, Federal Poverty Level; Ref., reference category.
* OR were modelled using logistic regression and adjusted for municipality characteristics including population size, urban status, geographic region, median education level, poverty prevalence and race/ethnicity. Referent group was both those municipalities who reported not using any incentives for the specified type of food retailer or those who did not know. Data were weighted to account for the complex survey design and non-response.
Prevalence of any incentive use also varied significantly by geographic region, poverty prevalence and racial/ethnic composition in some instances (Tables 2 and 3). First, the prevalence of using any incentives to encourage supermarkets to open new stores differed by geographic region (P < 0·001), with incentives most common in the Midwest (46·4 %) and least in the West (21·9 %). After multivariable adjustment, regional variation remained; Midwestern municipalities had significantly higher odds of using any incentives in supermarkets (AOR = 3·8; 95 % CI 2·7, 5·2) than Western ones. Second, any reported incentive use in farmers’ markets was more common among higher poverty municipalities (71·4 v. 65·7 %, P = 0·017) and this difference remained significant in the multivariate model (AOR = 1·5; 95 % CI 1·1, 1·9). Finally, prevalence of any reported incentives in convenience or corner stores was nearly twice as high among municipalities where ≤50 % of the population was non-Hispanic White (22·2 v. 12·7 %, P < 0·001). After adjustment for other community characteristics, differences by racial/ethnic composition were evident both in convenience or corner stores (AOR = 1·7; 95 % CI 1·2, 2·5) and in supermarkets (AOR = 1·5; 95 % CI 1·1, 2·1).
Among 1251 municipalities that supported access to healthy foods via farmers’ markets, 88·8 % permitted the sale of fresh produce on city property (Fig. 1). Among municipalities that used incentives to open new supermarkets (n 637), tax incentives were most common (61·1 %). Approximately 75 % of the 257 municipalities that assisted existing convenience or corner stores reported utilizing programmes to link stores to neighbourhood revitalization projects.
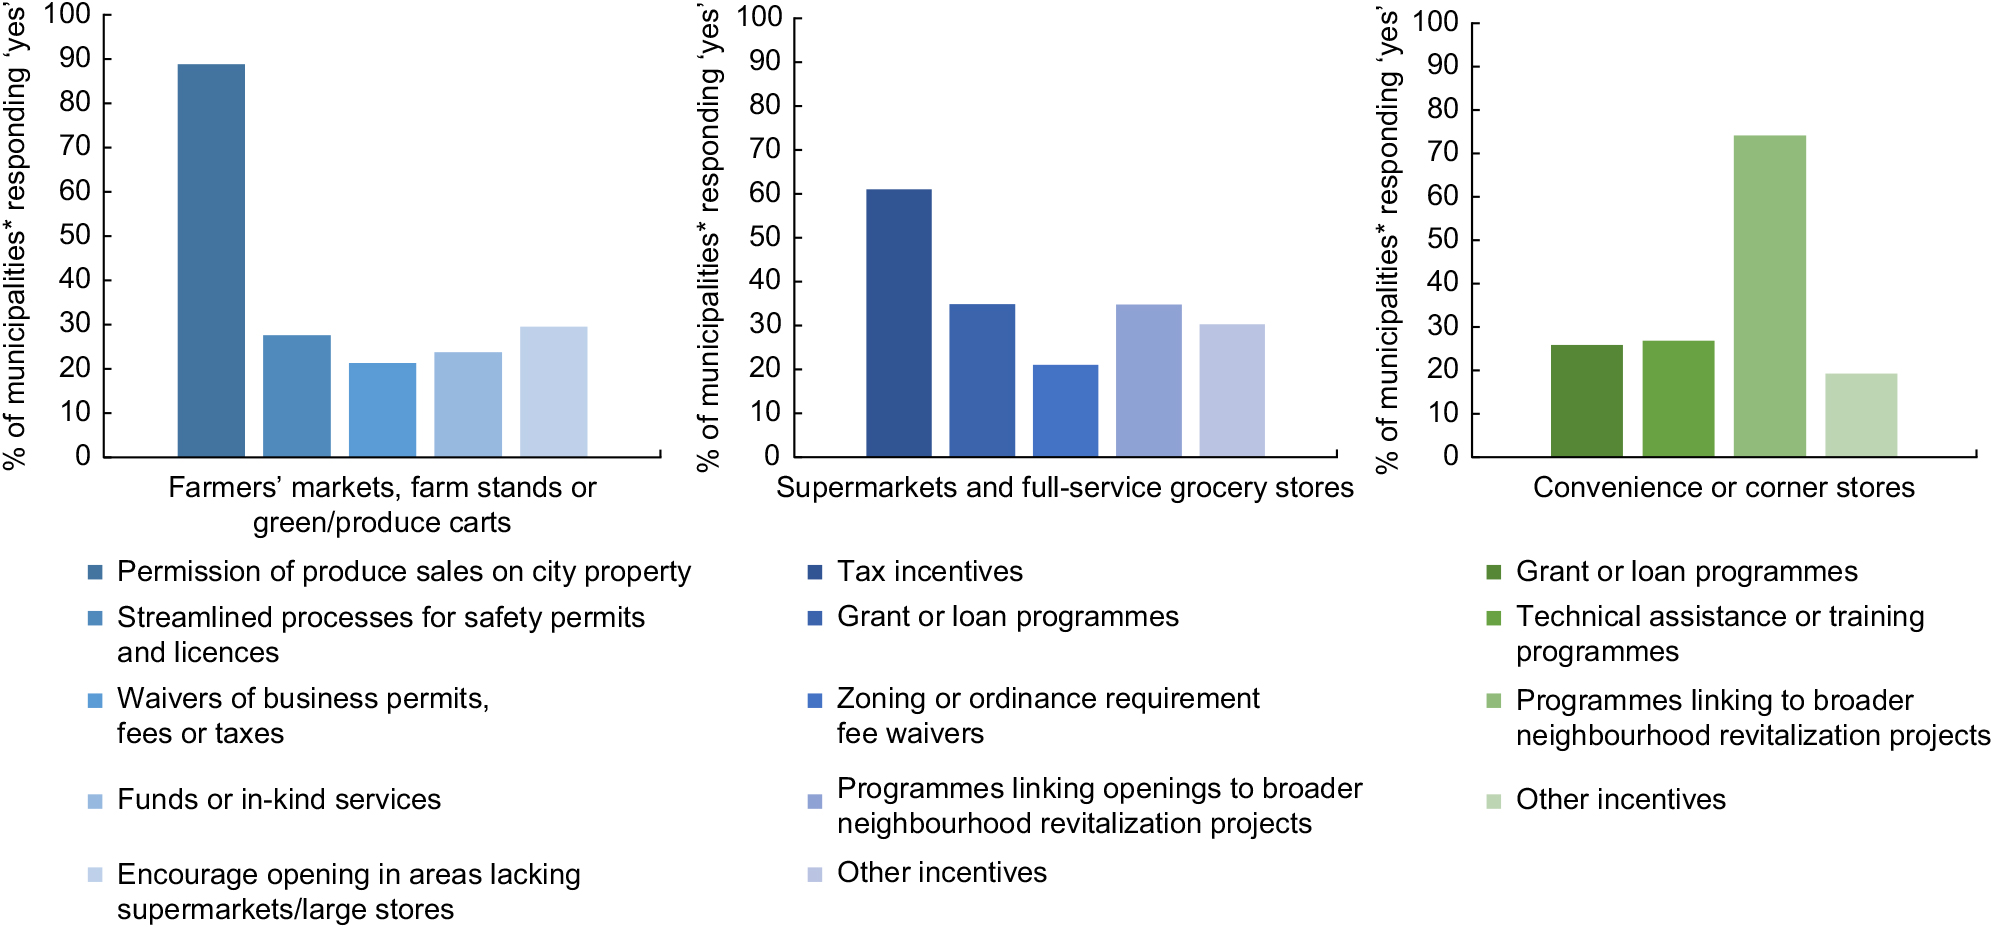
Fig. 1 (colour online) Prevalence of reported individual incentives offered by municipalities to improve access to healthy food options in three food retail settings, CBS HEAL, USA, 2014. *Among those municipalities who reported any incentive use for the specified food retail setting: supermarkets (n 637), convenience or corner stones (n 257), and farmers’ markets (n 1251) (CBS HEAL, National Survey of Community-Based Policy and Environmental Supports for Healthy Eating and Active Living)
Estimates from the sensitivity analysis, where municipalities who responded ‘no’ to all incentives in a particular retail setting were used as the referent group rather than ‘no’ and ‘don’t know’ combined, were slightly attenuated in magnitude for population size, geographic region and race/ethnicity compared with the estimates presented in Table 3, but were similar in statistical significance. Estimates for rural/urban status, median education level and poverty were similar in magnitude and statistical significance to those presented (see Appendix).
Discussion
To better understand local government efforts to improve healthy food access, the present paper documented the national prevalence and municipal characteristics of reported incentive use in three food retail settings. In 2014, approximately two-thirds of surveyed US municipalities reported using any incentives to increase access to healthy food options via farmers’ markets and other produce vendors. However, only about one-third reported any incentives to encourage supermarkets and other full-service stores to open new locations, and few (14 %) reported helping existing convenience or corner stores sell healthier foods. To our knowledge, the present study is the first to assess a breadth of local government incentives for three different major food retailers at the national level.
The finding that any reported incentive use was highest for farmers’ markets is not surprising. Farmers’ markets, farm stands and other produce vendors have been increasingly popular in recent years as a means to bring healthy foods directly into communities(Reference Tester, Stevens and Yen20,21) . Reasons why local governments used strategies to support farmers’ markets may include the relative low cost and ease of implementation of farmers’ market incentives (e.g. permission of sales on city property) compared with incentives to build new food stores or renovate existing ones(8).
In contrast, supermarket incentives were reported by only one-third of municipalities overall, and convenience and corner store incentives were not reported by most local governments (86 %). There are several factors that can influence store owners’ and local governments’ decisions whether to build new supermarkets. Some barriers may include high financial costs and the long-term commitment required to build and operate full-service stores, competition with existing retailers and insufficient capacity to support a large food retailer(22). Similarly, convenience and corner store owners face challenges in providing healthier options for local customers, including inadequate infrastructure to stock produce, perceived lack of demand for healthy foods and lack of expertise to effectively promote healthy foods(Reference Gittelsohn, Laska and Karpyn23). Further, municipalities may face challenges such as constraints from higher levels of government or lack of evidence to support the effectiveness of food retail interventions(Reference Reeve, Ashe, Farias and Gostin24). These logistical, business and political issues may particularly hinder collaboration between existing convenience or corner stores and local governments to improve healthy food access for residents.
Our findings suggest differences in the presence of reported use of any food retail incentives by some community characteristics. Municipalities with mid-sized (2500–49 999 people) and large (≥50 000 people) populations reported substantially higher use of incentives for all three food retail settings than smaller localities (<2500 people). This finding is consistent with other studies that found that larger local governments were more likely than smaller ones to enact policies to support healthy behaviours(Reference Moore, Carlson and Onufrak15,Reference Carlson, Paul and Kumar25–Reference Onufrak, Zaganjor and Moore27) . These differences by population size may reflect greater demand for healthy options by residents of larger communities; more financial resources, personnel or political ability to execute municipal efforts in larger v. smaller communities; or other factors. We also found geographic variation in reported use of government incentives that was not consistent across food retail settings. Geographic differences may be explained by a variety of factors, which may include large-scale state funding mechanisms for fresh food initiatives(28) or state legislation to support healthier food retailers(29). Why these regional differences were observed remains unclear and should be explored further.
Our study also showed that communities with poorer residents were particularly likely to report using any farmers’ market incentives. Studies have shown that low-income populations disproportionately lack access to permanent healthy food retailers, including supermarkets, proximal to their homes(Reference Grimm, Moore and Scanlon30–Reference Morland, Wing and Diez Roux33) and may face additional barriers, such as transportation to food stores. Thus, local governments can use farmers’ markets and other produce vendors as a potentially more feasible, mobile, direct-to-consumer means to connect residents in underserved areas with healthy foods when they may not be able to access them otherwise.
Furthermore, we found that municipalities where ≤50 % of the residents were non-Hispanic White were significantly more likely to have any incentives to help existing convenience or corner stores sell healthier foods. This finding aligns with the conclusions of a systematic review of case studies, which found that efforts in existing convenience or corner stores often target communities with high proportions of racial and ethnic minorities(Reference Gittelsohn, Rowan and Gadhoke34). After adjustment for other community characteristics, we found that areas with a higher percentage of non-Hispanic White residents were more likely to use incentives to open new supermarkets. This finding is consistent with previous studies, which have shown that lack of access to healthy food retailers is more common in predominantly minority neighbourhoods(Reference Powell, Slater and Mirtcheva32,Reference Morland, Wing and Diez Roux33) .
Within each food retail setting, certain individual incentives included in our survey were reported more often. Among municipalities that used incentives to support farmers’ markets, almost all permitted the sale of fresh produce on city property. Compared with other incentives in the present survey, this may be a less resource-intense strategy to improve healthy food access for community residents. Local governments who incentivized supermarkets to open new store locations most frequently used tax incentives such as credits or abatements, which could help alleviate the high cost of building, developing and operating full-service groceries(35). When we combined all types of financial incentives (i.e. tax incentives, zoning and fee waivers, streamlined processes) into one category, we found that they were used by approximately 41 % of municipalities, whereas fewer (13 %) used direct cash transfers (i.e. grants and loans). This may reflect varying abilities of local governments to execute these different types of incentives. Finally, most governments who assisted existing convenience or corner stores reported linking their efforts with broader revitalization projects, such as improvements to lighting, safety or walkability. This strategy may be particularly beneficial for neighbourhoods with these smaller stores; however, revitalization projects may also be useful to other types of food retailers.
Although previous studies have examined strategies to improve the retail environment in selected communities or selected retailers, the strength of the present study is that we documented the reported use of a variety of food retail incentives in multiple settings at the national level. This work helps identify types of localities where policies are more common and may guide tailored strategies for effectively improving food access for communities of varying sizes, racial/ethnic distributions and other demographics.
Our study has several limitations. First, the findings apply only to municipalities with 1000 people or more. Municipalities of fewer than 1000 people were excluded from the sample because a pilot study showed that smaller communities were least likely to have policies in place to support healthy eating(Reference Moore, Carlson and Onufrak15). A second limitation of the study is the modest response rate. Although weighting procedures account for the probability of non-response, bias may still exist if municipalities who did not use incentives for healthier food retailers were more likely to be non-responders. Third, we relied on self-reported information on local policies but were unable to verify whether reported incentives were implemented in community food retail settings. Fourth, approximately one-quarter of municipalities responded ‘don’t know’ to at least one of the fourteen survey incentive questions. However, sensitivity analyses yielded results similar in statistical significance and magnitude to original estimates in most cases. Finally, although an a priori list of incentives was provided based on input from an expert panel, literature reviews and scans of existing policy databases, this list was not exhaustive. Thus, other types of local food retail incentives that were not captured in our survey may exist. Survey respondents were, however, provided an ‘other’ option on questions about supermarkets and convenience or corner stores. This option was selected by approximately 10 % of respondents overall and included in the composite outcome, any incentive use for each retailer. However, an ‘other’ option was not present for questions about farmers’ markets, which may have led to an underestimation of the prevalence of incentive use in this setting.
Conclusions
Local government efforts to increase access to healthy food options can be important facilitators of healthy dietary habits. Most municipalities offered food retail incentives for farmers’ markets, but fewer used incentives to open new supermarkets or to assist existing convenience or corner stores. National data on government use of food retail incentives can set benchmarks, provide relative comparisons for communities and identify areas for improvement.
Acknowledgements
Financial support: This research received no specific grant from any funding agency in the public, commercial or not-for-profit sectors. The findings and conclusions in this report are those of the authors and do not necessarily represent the official position of the Centers for Disease Control and Prevention. Conflict of interest: None. Authorship: S.J.L. developed the research question, analysed the data and primarily wrote the paper, incorporating feedback from co-authors. L.V.M. and D.A.G. provided methodological expertise, helped with data interpretation, made critical paper revisions and provided mentorship. Ethics of human subject participation: This study was conducted according to the guidelines laid down in the Declaration of Helsinki and all procedures involving research study participants were approved by the IFC International (contractor) institutional review board (IRB), which determined that IRB approval was not required for this project because the study did not meet the federal definition of research given in 45 CFR 46. Written informed consent was obtained from all subjects.
Author ORCID
Samantha J Lange, 0000-0002-8193-1848.
Appendix
Sensitivity analysis: adjusted odds ratio estimates of reported use of any incentives for healthier food retailers calculated using two different referent groups, CBS HEAL, USA, 2014
CBS HEAL, Community-Based Policy and Environmental Supports for Healthy Eating and Active Living; AOR, adjusted odds ratio; FPL, Federal Poverty Level; Ref., reference category.
OR were adjusted for municipality characteristics including population size, urban status, geographic region, median education level, poverty prevalence and race/ethnicity.


