Childhood obesity is an emerging public health problem in the developing world( Reference de Onis, Blossner and Borghi 1 ). Obesity during childhood is a risk factor for many chronic health conditions in adulthood, including diabetes, hypertension, heart disease and stroke( Reference Reilly and Kelly 2 , Reference Daniels 3 ). Although there is a substantial body of literature on the aetiology of childhood obesity in the industrialized world, much less is known about the preventable causes of obesity in children from developing countries. Eating patterns and diet quality have emerged as important determinants of obesity in children( Reference Lobstein, Baur and Uauy 4 , Reference Jennings, Welch and van Sluijs 5 ). In developed nations, energy intake from snacks has increased among pre-adolescents and adolescents over time( Reference Jahns, Siega-Riz and Popkin 6 , Reference Piernas and Popkin 7 ), but epidemiological evidence to support an association between snacking and obesity is inconsistent in this age group( Reference Field, Austin and Gillman 8 – Reference Vader, Walters and Harris 12 ).
As part of the nutrition transition, many Latin American countries are experiencing increased access to processed foods, including readily available snacks that are high in saturated fat and refined carbohydrates( Reference Bermudez and Tucker 13 ). These trends are similar to what is observed in developed nations and in other countries undergoing this transition( Reference Adair and Popkin 14 , Reference Poskitt 15 ), where traditional diets are being replaced with high-energy, low-nutrient foods and meal patterns are changing( Reference Patro and Szajewska 16 , Reference McCrory and Campbell 17 ). We previously found that adherence to a snacking dietary pattern was related to childhood overweight in a cross-sectional study of Colombian school-age children( Reference McDonald, Baylin and Arsenault 18 ). However, it is unclear whether snacking influences the development of adiposity over time. A recent longitudinal study that followed UK children from 7 years to 15 years reported that an energy-dense, high-fat, low-fibre dietary pattern was related to development of adiposity( Reference Ambrosini, Emmett and Northstone 19 ). Yet, two cohort studies conducted among children and adolescents in the USA found no relationship between snacking and weight change( Reference Field, Austin and Gillman 8 , Reference Phillips, Bandini and Naumova 9 ). These longitudinal studies are necessary to overcome potential reverse causation bias in cross-sectional investigations. Nevertheless, there is no evidence linking snacking to the development of adiposity in longitudinal studies of children from developing countries.
In the present study, we examined whether adherence to a snacking pattern in children 5–12 years of age from Bogotá, Colombia, was associated with greater increases in BMI, subscapular:triceps skinfold thickness ratio (SKF) and waist circumference (WC) over 2·5 years.
Methods
Study population
The present study was conducted in the context of the Bogotá School Children Cohort, an ongoing longitudinal study of nutrition and health in school-age children from Bogotá, Colombia. Details on recruitment and data collection have been published previously( Reference Arsenault, Mora-Plazas and Forero 20 ). In brief, in February 2006 we enrolled 3202 children 5–12 years of age, who had been randomly selected from all public primary schools in the city at the time. These children represent low- and middle-income families in Bogotá, since the public system primarily enrols children from these socio-economic strata( 21 ).
At the time of recruitment, we collected background information from the families with use of a self-administered survey. This information included sociodemographic characteristics such as parents’ age, education, occupation, parity, anthropometry and socio-economic status. In addition, the parents also reported on children's physical activity behaviours including time spent watching television or playing outdoors. During the following days, trained research staff visited the children at schools to collect anthropometric measurements using standardized techniques( Reference Lohman, Roche and Mortorell 22 ). Height was measured to the nearest 1 mm using Seca 202 stadiometers, and weight was measured to the nearest 0·1 kg using Tanita HS301 solar-powered electronic scales. Triceps and subscapular skinfold thicknesses were measured to the nearest 0·5 mm with SlimGuide Skinfold Calipers (Creative Health Products Inc., Plymouth, MI, USA). When children were not found at schools on the days of the assessment, they were visited at home. Between May and June 2006, trained dietitians administered a thirty-eight-item FFQ to a sample of 1027 mothers who attended regularly scheduled parents’ meetings at schools to obtain information on children's usual dietary intake. Details on the FFQ have been previously published( Reference Isanaka, Mora-Plazas and Lopez-Arana 23 ). Briefly, there were nine frequency response options: 4–5 times/d, 2–3 times/d, 1 time/d, 5–6 times/week, 2–4 times/week, 1 time/week, 1–3 times/month, <1 time/month or never. For each item, a reference portion size was described in natural units (e.g. one glass of milk or one egg) or standard weight and volume measures for commonly consumed servings in this population. The questionnaire inquired about the mean frequency of intake of standard portion sizes during the previous month. Follow-up anthropometric measurements were obtained from children in June and November of 2006 and at annual school visits by the research team in subsequent years. At the 2007 and 2008 assessments, WC was measured to the nearest 1 mm with a non-extensible measuring tape at the level of the umbilicus according to a standard protocol( Reference Lohman, Roche and Mortorell 22 ).
Written informed consent for participation in the study was obtained from all parents or primary caregivers, and assent by the children was confirmed prior to enrolment. The study protocol was approved by the Ethics Committee of the National University of Colombia Medical School; the Institutional Review Board at the University of Michigan approved the use of data from the study.
Data analyses
We used principal component analysis to identify dietary patterns from the information obtained through the thirty-eight-item FFQ administered in 2006, as previously described in detail( Reference Isanaka, Mora-Plazas and Lopez-Arana 23 ). We excluded fifty-two records that had more than three food items with missing responses. Each item in the FFQ was first converted into servings/d. The factors obtained from principal component analysis were rotated using an orthogonal transformation to achieve a readily interpretable structure. We retained factors based on the observation of the scree plot, eigenvalues >1 and general interpretability. Factor score coefficients were multiplied by the standardized frequencies of intake for each food group and the sum of these products was the score for each derived factor.
There were four dietary patterns identified: ‘snacking’, ‘cheaper protein’, ‘traditional/starch’ and ‘animal protein’. The ‘snacking’ pattern is characterized by intakes of high-energy, low-nutrient-density foods such as candy, ice cream, packed fried snacks, soda and sugar-sweetened fruit-flavoured drinks. Factor loadings for this pattern were as follows: chocolate bar/cookies, 0·64; ice cream/popsicle, 0·61; guava/coconut candy bar, 0·58; candy/lollipop, 0·58; packed fried snacks, 0·52; soda, 0·50; and packed fruit punches, 0·38. Factor loadings for the other patterns have been published elsewhere( Reference Villamor, Mora-Plazas and Forero 24 ). Values for each factor were categorized into quartiles to represent four levels of adherence to the specific dietary pattern. Because previous analyses suggested that adherence to the snacking pattern was positively associated with the prevalence of overweight at baseline( Reference McDonald, Baylin and Arsenault 18 ), the primary exposure of interest was quartiles of adherence to the snacking pattern. Nutrient and energy intakes were estimated by multiplying the consumption frequency of each food by the nutrient and energy contents of the specific portion using composition values from the US Department of Agriculture's Standard Reference food composition database, supplemented with data from manufacturers and published reports (Food Processor software; http://www.esha.com) and the Food Composition Table of Colombian Foods by the Colombian Institute of Family Welfare( 25 ). A team composed of Colombian and US dietitians worked together on the nutrient composition analyses to ensure that the foods chosen from the USDA database resembled the closest to the local foods.
The primary outcomes examined were change in BMI (kg/m2) as an indicator of overall adiposity( Reference Zemel, Riley and Stallings 26 ), change in SKF as an indicator of truncal adiposity( Reference Tresaco, Moreno and Ruiz 27 ) and change in WC (cm) as an indicator of central adiposity( Reference Meininger, Brosnan and Eissa 28 ). As a secondary aim of the study, we also examined intake of the individual food items in the snacking pattern as exposures.
Of 975 children with data on dietary patterns, fourteen were excluded because they lacked anthropometric data at baseline and follow-up. Thus, the final sample size for analysis was 961. These children were slightly younger and less likely to be stunted, spent less time playing outdoors, and had mothers who were older and shorter compared with cohort participants who were not included in the analyses. Nevertheless, there were no differences with regard to socio-economic status, length of follow-up or indicators of adiposity between the groups.
We first compared the distribution of child and maternal anthropometric and sociodemographic characteristics across quartiles of adherence to the snacking dietary pattern. Children's BMI-for-age and height-for-age Z-scores were calculated with use of the sex-specific growth references for children aged 5–19 years from the WHO( Reference de Onis, Onyango and Borghi 29 ). Overweight or obesity was defined as BMI-for-age Z-score > 1 and obesity was defined as BMI-for-age Z-score > 2. Maternal BMI was calculated from measured height and weight in 26 % of the mothers and from self-reported data otherwise. Household socio-economic status was determined based on the government's classification assigned to each household for tax and planning purposes. We assessed the statistical significance of these associations with a test for linear trend of each baseline anthropometric or sociodemographic characteristic across quartiles of adherence to the snacking dietary pattern.
Next, we estimated mean change in each adiposity indicator over time by quartiles of adherence to the snacking pattern with the use of linear mixed-effects models( Reference Fitzmaurice, Laird and Ware 30 ). In these models, the outcome was the anthropometric variable and predictors included age, indicator variables for quartile of adherence to the dietary pattern, and interaction terms between age and these indicators. The interaction terms represent the difference in change (slope) over time for each anthropometric variable between each quartile of adherence and the reference group (lowest quartile). We incorporated random effects for the intercept and the slope to account for within-child correlations of repeated anthropometric measurements and specified an unstructured covariance matrix. These methods do not require the same number of observations on all subjects or that all observations are made at the same time; thus, all available measures from the children were included in the analysis. Models for WC included random effects for the intercept only because this measurement was not performed at baseline. In the adjusted analysis, we considered possible confounders known to be predictors of child overweight in this population, as well as variables that were significantly associated with adherence to the snacking dietary pattern in the univariate analysis at P < 0·10. The final multivariable models included child's sex, total energy intake and socio-economic status; further adjustment for maternal BMI and time spent playing outside did not change the direction or magnitude of the associations. For analyses of snack food as exposures, frequency of intake was categorized as never, <1 time/month, 1 time/week to 1 time/month, 2–6 times/week or ≥1 time/d. Indicator variables for these categories were introduced into linear mixed-effects models and mean differences in anthropometric change were calculated, adjusted for total energy intake, sex and socio-economic status. Empirical estimates of variance were used to overcome deviations from the multivariate normality assumption in all models. All analyses were performed with use of the statistical software package SAS version 9·2.
Results
Mean age of children in the present analyses was 8·6 (sd 1.7) years; 51·3 % were girls. Mean BMI-for-age Z-score was 0·12 (sd 1·02); 18 % of the children had a BMI-for-age Z-score > 1 and 4 % had a BMI-for-age Z-score > 2.
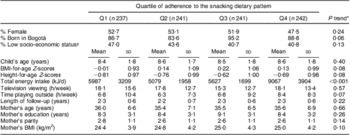
We first compared baseline characteristics of the children and their families across quartiles of adherence to the snacking dietary pattern (Table 1). BMI-for-age Z-score was lowest in the first quartile whereas total energy intake and time playing outdoors were highest in the fourth. The mother's BMI was lowest among children in the first quartile of adherence to snacking.
Table 1 Baseline characteristics of study participants according to their level of adherence to the snacking dietary pattern: children (n 961) aged 5–12 years, Bogotá, Colombia

*Cochran–Armitage test for categorical variables; Wald test for continuous variables.
†Strata 1 or 2 of a scale up to 6 (4 in the sample), according to the city government's classification.
‡According to the WHO growth reference( Reference de Onis, Onyango and Borghi 29 ).
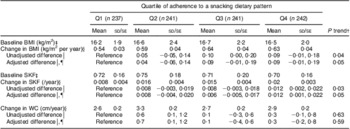
Children contributed 3924 measurements over a median 2·5-year follow-up (interquartile range 2·4–2·6 years). Each child contributed a median of four measurements. In unadjusted models, there was a positive relationship between adherence to the snacking pattern and all three anthropometric indicators of adiposity during follow-up (Table 2); however, only the associations with BMI and SKF were statistically significant. After adjustment for sex, total energy intake and socio-economic status, children in the highest quartile of adherence to the snacking pattern had a 0·09 kg/m2 per year higher BMI gain (P = 0·08) than those in the lowest quartile (P trend = 0·05). Similarly, children in the highest quartile of adherence had a 0·012/year (P = 0·03) greater increase in SKF compared with those in the lowest quartile (P trend = 0·05). Other dietary patterns were not associated with the development of adiposity (data not shown).
Table 2 Mean annual change in indicators of adiposity according to adherence to the snacking dietary patternFootnote *: children (n 961) aged 5–12 years, Bogotá, Colombia

SKF, subscapular:triceps skinfold thickness ratio; WC, waist circumference.
* Estimated mean values with their standard errors and unadjusted differences are from mixed-effects linear regression models with the adiposity measure as the outcome and predictors that included indicator variables for quartiles of the snacking dietary pattern score, age in decimal years, and quartile of the snacking dietary pattern × age interaction terms. Random effects were included for intercepts and slopes. Models for WC included random effects for intercepts only. An unstructured variance–covariance matrix was specified in all models. Adjusted models also included child's sex, total energy intake and socio-economic status.
† For a variable that represented the quartiles of adherence to the snacking pattern, introduced in the linear regression model as a continuous predictor (Wald test).
‡ Values are means and standard deviations.
§ Values are means with their standard errors.
‖ Values are mean differences and 95 % confidence intervals.
¶ n 907.
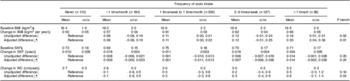
We next examined the associations between intake of the food items in the snacking dietary pattern and changes in indicators of adiposity. Changes in BMI and the SKF were positively related to intake of ice cream/popsicle and candy, whereas WC change was related to packed fried snacks intake; however, the associations were not statistically significant (online supplementary material, Supplemental Table 1). Of all foods considered, only soda intake was significantly, positively and linearly associated with change in adiposity indicators (Table 3). Annual BMI change increased monotonically with increasing levels of soda intake (P trend = 0·01). A similar positive trend was observed for WC. Compared with children who never drank soda, those reporting daily intake had a 0·6 cm/year greater increase in WC (P trend = 0·04). We did not find a significant association of soda intake with annual change in SKF.
Table 3 Mean annual change in indicators of adiposity according to soda intakeFootnote *: children (n 961) aged 5–12 years, Bogotá, Colombia

SKF, subscapular:triceps skinfold thickness ratio; WC, waist circumference.
* Estimated mean values with their standard errors and unadjusted differences are from mixed-effects linear regression models with the adiposity measure as the outcome and predictors that included indicator variables for soda intake categories, age in decimal years, and soda intake categories × age interaction terms. Random effects were included for intercepts and slopes. Models for WC included random effects for intercepts only. An unstructured variance–covariance matrix was specified. Adjusted models also included child's sex, total energy intake and socio-economic status.
† For a variable that represented frequency of soda intake categories, introduced in the linear regression model as a continuous predictor (Wald test).
‡ Values are means and standard deviations.
§ Values are means with their standard errors.
‖ Values are mean differences and 95 % confidence intervals.
¶ n 890.
Discussion
In the current prospective study conducted among school-age children in Bogotá, Colombia, we observed a significant positive relationship between adherence to a snacking pattern and annual change in BMI and SKF. Additionally, soda intake was positively and significantly associated with annual change in BMI and WC.
The association between snack intake and the development of adiposity is consistent with our previously reported finding that children who strongly adhered to snacking were more likely to be overweight at baseline( Reference McDonald, Baylin and Arsenault 18 ). A substantial strength of the present report, however, is that we used a longitudinal design that minimizes the possibility of reverse causation. In addition, we evaluated indicators of adiposity other than BMI and found consistency in the associations.
Findings from earlier studies of snacking and obesity in children have yielded mixed results. Two cross-sectional studies conducted in the USA did not find associations between consumption of snack foods and child obesity or overweight( Reference Keast, Nicklas and O'Neil 10 , Reference Vader, Walters and Harris 12 ). One potential explanation for the lack of association in cross-sectional studies is that overweight children could have changed their dietary behaviour by the time the survey was carried out. A few longitudinal studies, also conducted in the USA, examined the relationships between snacking and obesity in children( Reference Field, Austin and Gillman 8 , Reference Phillips, Bandini and Naumova 9 , Reference Francis, Lee and Birch 31 ). Field et al. observed no association between the consumption of snack foods and BMI in 9- to 14-year-old children over 3 years of follow-up( Reference Field, Austin and Gillman 8 ). Phillips et al. reported that energy-dense food consumption was related to BMI Z-score or percentage body fatness in 8–12-year-old non-obese girls from Cambridge, Massachusetts who were followed until 4 years after menarche( Reference Phillips, Bandini and Naumova 9 ). On the other hand, Francis et al.( Reference Francis, Lee and Birch 31 ) reported that snacking was a risk factor for the development of overweight in a cohort of 5–9-year-old girls from Pennsylvania during 4 years of follow-up. There are a few potential explanations for the discrepancies in study findings. There may be differences in the baseline prevalence of overweight. If the average BMI of the study population is high at the outset, additional variation over time due to diet may be difficult to observe. It is also possible that the length of follow-up was not sufficient in some investigations. We noted that the definition of snacking varied across studies, which might contribute to the incongruence of study findings. Some studies defined snacking in terms of frequency of consumption( Reference Francis, Lee and Birch 31 – Reference Howarth, Huang and Roberts 35 ), while others treated the variable as the sum of total daily servings of snack food items( Reference Field, Austin and Gillman 8 , Reference Phillips, Bandini and Naumova 9 ). Additionally, because the quality of snack foods may differ across populations, comparability of results from studies that examined the associations of specific snack items may be limited. Our approach of identifying a snacking dietary pattern through principal component analysis is advantageous because snack items were foods often eaten together and were likely consumed away from home and between meals.
In our study, the items with highest factor loadings in the snacking pattern were foods high in refined carbohydrates and saturated fat. Children with the highest adherence to the snacking pattern had higher total energy intake, yet the association between snacking and adiposity indicators was unchanged after adjustment for total energy. Whether part of the effect of snacking on extra weight gain may be mediated through mechanisms other than an increase in total energy intake deserves further examination in future studies.
We found that adherence to a snacking dietary pattern was not only related to greater gains in BMI but also with SKF, an indicator of truncal adiposity. Associations with indicators of central adiposity are especially important because accrual of central fat during childhood is predictive of adverse cardiometabolic outcomes in adulthood( Reference Schmidt, Dwyer and Magnussen 36 ). Interventions aimed at reducing central fat accrual in children might have a long-term benefit on cardiovascular health.
When we considered the foods with the highest loading factors in the snacking pattern, soda intake was the only item related to positive changes in adiposity indicators. This could be because soda may explain a greater proportion of variability in energy intake compared with the other snacking items in this population. These results are in line with those from several longitudinal studies conducted in children from developed countries that have demonstrated a link between soda consumption and BMI( Reference Phillips, Bandini and Naumova 9 , Reference Berkey, Rockett and Field 37 – Reference Kral, Stunkard and Berkowitz 40 ). A recent randomized trial among school-age children showed that sugar-sweetened beverages caused greater gains in BMI and WC compared with unsweetened beverages( Reference de Ruyter, Olthof and Seidell 41 ). Soda consumption contributes to increasing total energy intake as children fail to compensate for kilojoules from liquids by reduced consumption of solid foods at subsequent meals( Reference Malik, Willett and Hu 42 ). In addition, liquid kilojoules affect body physiology in different ways compared with those from solid foods; they increase production of leptin, insulin secretion and lipid metabolism( Reference Bray, Nielsen and Popkin 43 , Reference Malik, Popkin and Bray 44 ).
Strengths of the present study include its prospective design, large sample size, high follow-up retention, use of an instrument that measures long-term dietary intake, and the possibility of adjusting estimates for relevant potential confounders. Our study has some limitations. First, maternal report of children's diet may lead to some misclassification, especially of foods that are consumed frequently outside the household such as snacks. Although the associations between the snacking pattern and adiposity appear to be driven by soda intake, we cannot totally exclude that other components of this pattern may also be associated to the development of adiposity. It is possible that soda intake is better reported than other components of the snacking pattern and therefore misclassification is lower for soda intake( Reference Persson Osowski, Fjellstrom and Olsson 45 ). Second, the use of principal component analysis to identify dietary patterns involves some subjectivity in the criteria employed to retain factors. Third, we lacked assessments of sexual development staging, which might affect both dietary habits and changes in adiposity. Finally, the study population did not include children from the highest socio-economic strata and thus results can only be extrapolated to children of low- and middle-income families.
Conclusion
Our results indicate that adherence to a dietary pattern that includes the frequent intake of snacks such as sugar-sweetened beverages, packed fried foods and candy is associated with the development of adiposity among school-age children. Because snack foods are high in energy and low in nutrients, reducing the consumption of such foods is a potential target for intervention at schools. These interventions may have a beneficial impact against childhood obesity in countries undergoing the nutrition transition.
Acknowledgements
Sources of funding: The Bogotá School Children Cohort Study is currently sponsored by the ASISA Research Fund at the University of Michigan. Conflicts of interest: No author has any conflicts of interest. Authors’ contributions: M.R.S. and W.P. performed the statistical analysis and drafted the manuscript; A.B. contributed to the research design and data interpretation; M.M.-P. and C.M. contributed to the data collection and quality assurance; E.V. designed the research, contributed to the data analysis and interpretation, and had primary responsibility for the final content. All authors contributed to the manuscript write-up.