


Introduction
Brain regions are linked together by white matter tracts formed from bundles of axonal fibers that facilitate information transfer from one region to another (Sporns, Reference Sporns2011). As brain function is constrained to a certain extent by anatomical connections (Suárez, Markello, Betzel, & Misic, Reference Suárez, Markello, Betzel and Misic2020), variations in these pathways may contribute to changes in brain function. Studies have reported subtle reductions in the fractional anisotropy (FA; a measure of the coherence of axonal fibers) of multiple individual white matter tracts in Major Depressive Disorder (MDD; Chen et al., Reference Chen, Hu, Li, Huang, Lui, Kuang and Gong2016; van Velzen et al., Reference van Velzen, Kelly, Isaev, Aleman, Aftanas, Bauer and Schmaal2020), thus hinting at reduced structural connectivity. However, since the brain is organized as a network (regions as nodes, connections as edges), the use of network approaches, such as graph theory (Sporns, Reference Sporns2018) and network-based statistics (Zalesky, Fornito, & Bullmore, Reference Zalesky, Fornito and Bullmore2010), is better suited to study structural differences present in MDD as they can provide information on topological organization in addition to connectivity strength. This will add to the insights that can be gained by studying individual regions in isolation.
Multiple studies have since examined MDD case–control differences in brain network architecture across different scales, at the global (network-wide), nodal (individual nodes), and connection (individual edges) levels (Gong & He, Reference Gong and He2015; Yun & Kim, Reference Yun and Kim2021). Differences were generally not found at the global level but at the nodal and connection levels (Sacchet, Prasad, Foland-Ross, Thompson, & Gotlib, Reference Sacchet, Prasad, Foland-Ross, Thompson and Gotlib2015; Xu et al., Reference Xu, Deng, Qu, Lai, Huang, Rong and Xie2021). For example, MDD cases had lower clustering coefficient (i.e. the extent to which nodes are clustered together) for regions involved in the cognitive-emotion circuitry (Qin et al., Reference Qin, Wei, Liu, Yan, Luo, Yao and Lu2014) and reduced connectivity in subnetworks involving regions in the default mode network (DMN; Korgaonkar, Fornito, Williams, & Grieve, Reference Korgaonkar, Fornito, Williams and Grieve2014). While there is a consensus that connectomic differences do exist in MDD, there is currently no unanimity regarding specific differences due to lack of replication. Large sample sizes are needed to ensure the accurate estimation of effect sizes (Button et al., Reference Button, Ioannidis, Mokrysz, Nosek, Flint, Robinson and Munafò2013; Grady, Rieck, Nichol, Rodrigue, & Kennedy, Reference Grady, Rieck, Nichol, Rodrigue and Kennedy2021; Marek et al., Reference Marek, Tervo-Clemmens, Calabro, Montez, Kay, Hatoum and Dosenbach2022; Poldrack et al., Reference Poldrack, Baker, Durnez, Gorgolewski, Matthews, Munafò and Yarkoni2017) but previous studies were limited by small sample sizes (mostly N < 100; Xu et al., Reference Xu, Deng, Qu, Lai, Huang, Rong and Xie2021). In the context of a highly prevalent and heterogeneous disorder like MDD (Fried & Nesse, Reference Fried and Nesse2015), results from small-scale studies may not be generalizable to the wider population too. As with large neuroimaging studies (e.g. UK Biobank) that have contributed robust findings on brain structural differences associated with MDD (Anderson et al., Reference Anderson, Collins, Kong, Fang, Li, He and Holmes2020; van Velzen et al., Reference van Velzen, Kelly, Isaev, Aleman, Aftanas, Bauer and Schmaal2020), it is of interest to leverage these large cohorts for connectomic studies as well.
One of the features that differentiates brain networks from random networks is the presence of hubs (regions with high degree of connectivity). The concept of rich club organization suggests that hubs are densely interconnected with one another to form a rich core that functions as the central backbone of brain communication (van den Heuvel & Sporns, Reference van den Heuvel and Sporns2011; van den Heuvel & Sporns, Reference van den Heuvel and Sporns2013; van den Heuvel, Kahn, Goñi, & Sporns, Reference van den Heuvel, Kahn, Goñi and Sporns2012). It has been proposed that aberrant functioning of the network, as seen in neurological and psychiatric disorders (Crossley et al., Reference Crossley, Mechelli, Scott, Carletti, Fox, McGuire and Bullmore2014; Warren et al., Reference Warren, Power, Bruss, Denburg, Waldron, Sun and Tranel2014), is due to disruptions in the connectivity of hubs. For instance, computationally simulated attacks on rich club connections were shown to impair global network efficiency (i.e. efficiency of information exchange) to a greater extent as compared to random attacks on non-rich club connections (van den Heuvel & Sporns, Reference van den Heuvel and Sporns2011). Given the global impact that the disruption of the rich core has, it is possible that the rich core may be affected in MDD, which is characterized by a wide range of cognitive, affective, and somatic symptoms. At the same time, the importance of non-hubs was highlighted in a study investigating the complexity of connectivity patterns of nodes (i.e. how similar were the connections established by nodes of the same degree, in terms of the degrees of nodes they were connected to; Smith et al., Reference Smith, Bastin, Cox, Valdés Hernández, Wiseman, Escudero and Sudlow2019). Nodes were divided into node tiers based on node degrees, with the first tier comprising nodes in the top 25% of degrees, and so on. It was reported that the most complex nodes were found in the lower tiers, while nodes in the highest tier (hubs) were the least complex. The wide variability in connectivity patterns of non-hubs play an important role in bridging nodes across different tiers, which is needed to support the diverse functional roles of the brain. As such, disruptions at non-hubs may affect cross-tier connectivity and play a significant role in disease etiology, possibly even more so than disruption of hubs. This, however, requires further testing. Given the above, it is of benefit to investigate the differences in the connectivity of hubs alongside non-hubs to determine key associations with MDD.
In summary, MDD is a complex disorder that is associated with structural differences in the brain network. To date, attempts to understand these associations from a connectomic perspective have been limited by small sample sizes and consequent low statistical power. Due to the lack of consensus on the regions implicated in MDD, specifically the involvement of hubs and non-hubs, the neurobiological associations of MDD remain uncertain. Thus, the goal of this study is to utilize two large adult population samples to investigate MDD case–control differences in the structural connectome using network-based methods. To this end, we adopted a comprehensive approach of making comparisons at the global, tier, nodal, and connection level to tease out MDD-associated differences at each hierarchical level of the connectome (Fig. 1).
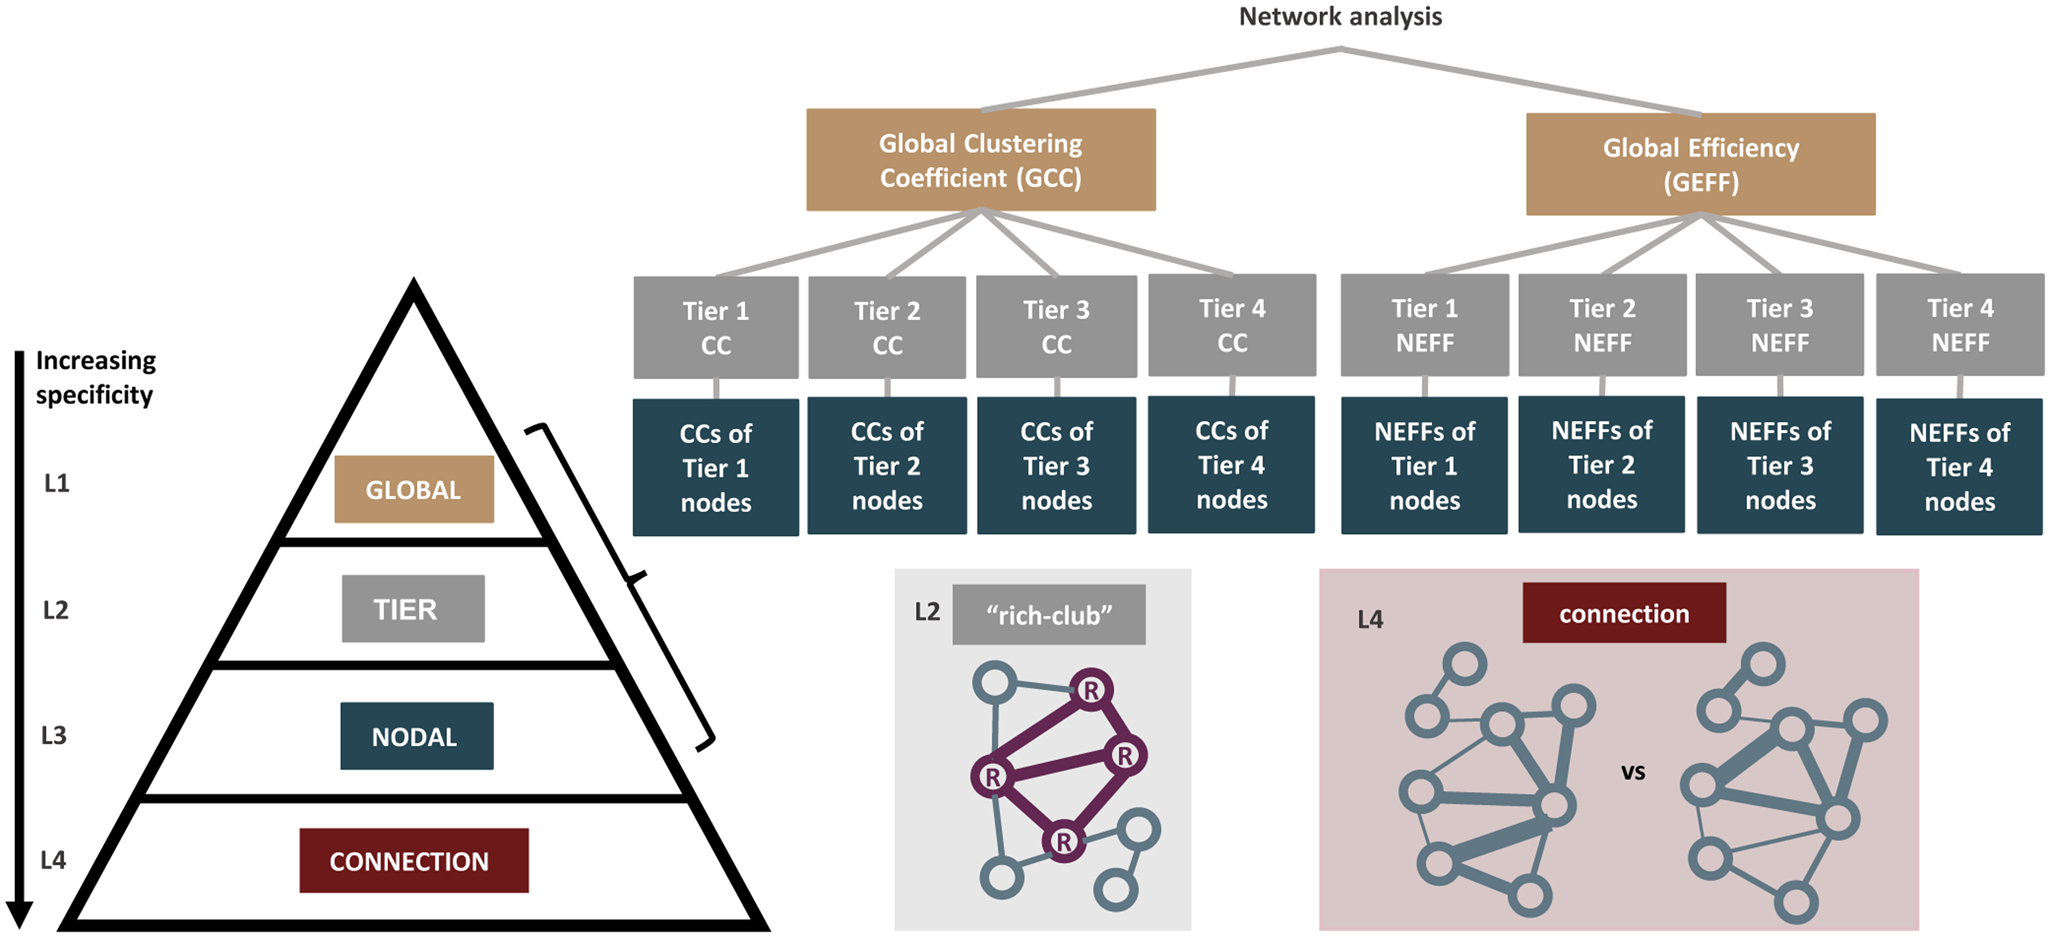
Figure 1. An overview of how the hierarchical order was established. We compared the structural connectomes of MDD cases and healthy controls in a hierarchical manner from levels 1 to 4 (L1–L4), in the order of increasing specificity. At the global network-wide level at L1, network measures including global clustering coefficient (GCC) and global efficiency (GEFF) were derived. At L2, the nodes were then grouped into four tiers based on their node degrees and tier-level network measures were compared. The presence of rich club organization looking at hub-to-hub connections was also separately studied at L2. At L3, network measures including clustering coefficient (CC) and nodal efficiency (NEFF) for each individual node were derived. At L4, Network-Based Statistics (NBS) was used to identify case–control group differences at the level of individual region-to-region connections.
Methods
Participants
The discovery sample consisted of participants that were part of the first 10 000 brain imaging datasets from the UK Biobank (UKB) study (Sudlow et al., Reference Sudlow, Gallacher, Allen, Beral, Burton, Danesh and Collins2015). The study was approved by the National Health Service Research Ethics Service (No. 11/NW/0382) and the UK Biobank Access Committee (Project No. 4844 and 10279). All participants provided informed consent. Participants were excluded if they had (1) neurological conditions including multiple sclerosis and Parkinson's disease, (2) other mental health conditions including bipolar disorder and post-traumatic stress disorder, and (3) failed neuroimaging quality control as detailed in an earlier publication (Buchanan et al., Reference Buchanan, Bastin, Ritchie, Liewald, Madole, Tucker-Drob and Cox2020). The final sample comprised N = 5104 subjects with both MDD and imaging data (Table 1). The replication sample consisted of participants from the imaging subsample of the Generation Scotland: the Scottish Family Health Study (GS; Habota et al., Reference Habota, Sandu, Waiter, McNeil, Steele, Macfarlane and McIntosh2021). GS received ethical approval from the NHS Tayside research ethics committee. All participants provided informed consent (reference 14/SS/0039). The same exclusion criteria as UKB were applied, and the final sample comprised N = 725 subjects with both MDD and imaging data (Table 1). Details on recruitment and assessments for both samples have been provided elsewhere (Alfaro-Almagro et al., Reference Alfaro-Almagro, Jenkinson, Bangerter, Andersson, Griffanti, Douaud and Smith2018; Miller et al., Reference Miller, Alfaro-Almagro, Bangerter, Thomas, Yacoub, Xu and Smith2016) and in the supplementary materials.
Table 1. Demographic information of participants from UKB and GS

GCSE, General Certificate of Secondary Education; CSE, Certificate of Secondary Education; NVQ, National Vocational Qualification; HND, Higher National Diploma; HNC, Higher National Certificate.
Note: p values represent differences between cases and controls.
Derivation of structural connectomes
Structural connectome processing was done locally and harmonized across UKB and GS using the same procedure published previously (Buchanan et al., Reference Buchanan, Bastin, Ritchie, Liewald, Madole, Tucker-Drob and Cox2020). Each T1-weighted image was parcellated into 85 neuroanatomical regions-of-interest (ROI). Eight subcortical structures per hemisphere (accumbens area, amygdala, caudate nucleus, hippocampus, pallidum, putamen, thalamus, and ventral diencephalon), and the brainstem were extracted with FreeSurfer v5.3.0, and 34 cortical structures per hemisphere were identified using the Desikan-Killany atlas (Desikan et al., Reference Desikan, Ségonne, Fischl, Quinn, Dickerson, Blacker and Killiany2006). Probabilistic tractography (BEDPOSTX/ProbtrackX; Behrens, Berg, Jbabdi, Rushworth, & Woolrich, Reference Behrens, Berg, Jbabdi, Rushworth and Woolrich2007; Behrens et al., Reference Behrens, Woolrich, Jenkinson, Johansen-Berg, Nunes, Clare and Smith2003) was performed and streamlines were seeded from all white matter voxels. Networks were constructed by identifying pairwise connections between the 85 ROIs and represented in the form of 85 × 85 matrices. FA-weighted matrices were derived by recording the mean FA along interconnecting streamlines between each pair of nodes. Given that raw networks contain many false-positive connections (Thomas et al., Reference Thomas, Ye, Irfanoglu, Modi, Saleem, Leopold and Pierpaoli2014), density-based thresholding was used to retain the top x% of strongest edges for each subject's connectome (Rubinov & Sporns, Reference Rubinov and Sporns2010), on the assumption that connections with the lowest weights are spurious and differ according to individuals. Seven thresholds ranging from 10% to 40% were applied. To select the main threshold, we took the case–control Cohen's d for all global, tier, and nodal network measures, and calculated the correlation between those derived in UKB and those derived in GS. A higher correlation coefficient implies that the results between both cohorts are more agreeable, vice versa. The threshold of 35% with the strongest correlation (r s = 0.37, p = 7.1 × 10⁻⁷) was selected to be reported here. Of note, the correlation coefficient at other thresholds was also similar (online Supplementary Fig. S1), suggesting that the replication results were consistent and there is no bias in the selection of the main threshold. This is in line with previous studies which considered similar thresholds (Buchanan et al., Reference Buchanan, Bastin, Ritchie, Liewald, Madole, Tucker-Drob and Cox2020).
MDD status
Lifetime MDD status in UKB and GS was determined using online questionnaires based on the Composite International Diagnostic Interview Short Form (CIDI; Kessler, Andrews, Mroczek, Ustun, & Wittchen, Reference Kessler, Andrews, Mroczek, Ustun and Wittchen1998). To fulfil criteria for MDD, cases were defined as ever having at least one core symptom of depression (prolonged sadness, loss of interest) for the majority or all days over a two-week period, and at least four non-core depressive symptoms (tiredness, weight change, sleep change, concentration difficulty, feeling worthless, thoughts of death) during the same period. Controls were subjects who did not endorse depression and did not screen positive for CIDI. Further details on how the case–control status was defined can be found here (Davis et al., Reference Davis, Coleman, Adams, Allen, Breen, Cullen and Hotopf2020).
Network measures (L1: global; L3: nodal)
Four edge-weighted measures (two global, two nodal) focusing on clustering and efficiency were derived for each subject. The clustering coefficient (CC) measures the fraction of neighbors of the node that are also connected with each other. The weighted CC is the geometric average of the weights of the links forming all closed triplets centered on the node (Onnela, Saramäki, Kertész, & Kaski, Reference Onnela, Saramäki, Kertész and Kaski2005). The global clustering coefficient (GCC) gives an overall indication of the clustering in the network and is defined as the average of all CCs. The nodal efficiency (NEFF) measures how well a node is integrated within the network via its shortest paths. It is the sum of the reciprocals of the shortest path lengths from the node to all other nodes of the network (Latora & Marchiori, Reference Latora and Marchiori2001). The global efficiency (GEFF) measures the efficiency of information exchange in which nodes concurrently exchange information via their shortest paths. It is defined as the average of all NEFFs.
The focus on CC and efficiency measures is because the human brain is postulated to be a ‘small-world’ network characterized by high CC and short path lengths. In other words, nodes are highly connected together through a small number of steps to ensure a high rate of information transfer to support complex brain functions at a low energy cost. Given that the small-network topology is already evident during the early developmental years (Fan et al., Reference Fan, Shi, Smith, Lin, Gilmore and Shen2011), it is thus of interest to see if these fundamentally important network measures are affected in MDD.
Tier-based network measures (L2)
For each individual network, four node tiers were defined based on node degrees, using the method by Smith et al. (Reference Smith, Bastin, Cox, Valdés Hernández, Wiseman, Escudero and Sudlow2019). Tier 1 (T1) comprised nodes in the top 25% according to their degrees (i.e. hubs), Tier 2 (T2) comprised nodes in the next 25%, and so on for Tier 3 (T3) and Tier 4 (T4). The tiers were defined separately for each subject, as nodes may have different degrees and belong to different tiers in different subjects. For each subject and each nodal measure, measures for each tier (e.g. T1_CC, T1_NEFF) were derived by averaging the measure values of all nodes in the respective tiers.
This tier-based analysis is particularly interesting given that earlier studies showed that both neonatal and adult structural connectomes are composed of distinct hierarchical tiers, with different tiers comprising different categories of functional processing (Blesa et al., Reference Blesa, Galdi, Cox, Sullivan, Stoye, Lamb and Boardman2021). By dividing nodes into tiers, we are able to assess if there are any tiers that are particularly affected in MDD (e.g. hubs in T1 v. non-hubs in other tiers) and are possibly driving the effects observed at the global level.
Rich club organization (L2)
A rich club organization is present when high degree nodes are more likely to be interconnected and have stronger connection among themselves than would occur by chance (Opsahl, Colizza, Panzarasa, & Ramasco, Reference Opsahl, Colizza, Panzarasa and Ramasco2008). Group-averaged networks were used to calculate the weighted rich club coefficient, Φ(k). All non-zero connections were first ranked according to their weight (W rank). For each degree k, a sub-graph comprising nodes with a degree larger than k was selected. The number of connections (E >k) present between nodes in the sub-graph and the sum of their weights (W >k) were determined. Φ(k) was then defined as the ratio between W >k and the sum of the top E >k links in the entire network (Equation 1).

To ensure that these high degree nodes are not interconnected due to chance, 1000 random networks (with weights randomly reassigned while preserving the binary topology) were generated for each k and a corresponding Φrand(k) was calculated by averaging all 1000 random networks. A normalized rich club coefficient Φnorm(k) was derived as the ratio of Φ(k) over Φrand(k). A Φnorm(k) of greater than 1 over a continuous range of k would suggest the existence of rich club organization.
Network-based statistics (NBS; L4)
NBS (v1.2; Zalesky et al., Reference Zalesky, Fornito and Bullmore2010) was used to test for differences in strength of each region-to-region connection. It evaluates the null hypothesis at the level of subnetworks instead of individual connections, with the assumption that connections associated with the effect of interest are likely to be connected. A two-sample t test was first performed to test for reduced connectivity in MDD cases at every connection, controlling for age and sex (and site for GS). A component-forming threshold of p < 0.05 was used to select a set of suprathreshold edges, and all connected subnetworks at this level were identified. To evaluate the significance of the subnetwork, permutation testing was done by shuffling group membership (5000 permutations) to obtain a null distribution of maximal subnetwork sizes. The p value was defined as the proportion of permutations for which the largest subnetwork was of the same size or greater (p < 0.05, FWE-corrected for comparison of multiple subnetworks).
Statistical analysis
The significance of (1) rich club curves for MDD cases and controls, and (2) case–control differences in rich club organization were tested using permutation testing. (1) For each degree k, the 1000 generated random networks produced a null distribution of rich club coefficients. Using this distribution, a p value was assigned to the Φnorm(k) as the proportion of Φrand(k) that exceeded Φnorm(k). (2) For each degree k, the differences in Φrand(k) between cases and controls produced a null distribution of 1000 differences. Using this distribution, a p value was assigned to each case–control difference in Φnorm(k) as the proportion of random differences that exceeded the observed difference. FDR correction was applied and significance was determined at pFDR<0.05.
Linear regression was used to assess case–control differences in network measures, controlling for age, sex, and site (for GS only which had two sites; UKB had one site). The t-values for the group factor were used to compute Cohen's d effect sizes (Nakagawa & Cuthill, Reference Nakagawa and Cuthill2007). Permutation testing used to assess significance was done by shuffling group membership to obtain a null distribution of t-values for the group factor (1000 permutations). The p value was defined as the proportion of permutations for which the unsigned t-value was greater than the original unsigned t-value. Given the hierarchical structure of the data (Fig. 1), hierarchical FDR correction (Yekutieli, Reference Yekutieli2008) was performed. FDR correction was first applied across all global measures. For measures that remained significant, FDR correction was then applied across all measures at next level belonging to the same family (e.g. if GEFF remains significant, FDR correction will then be applied across all tier-based NEFFs). This process was repeated for the last level (nodal). Significance was determined at pFDR<0.05.
As sensitivity analysis, we controlled for additional covariates, including education level, household income, and body mass index. To ensure that the effects were not driven by antidepressant exposure, we also tested for differences between (1) MDD cases with and without antidepressant use, and (2) MDD cases without antidepressant use and controls. The list of antidepressants is listed in online Supplementary Table S2.
Results
Global level
GEFF (d = −0.076, pFDR = 0.033) was significantly lower in MDD cases in UKB (Fig. 2a, online Supplementary Table S3). The effect size was similar in GS and in the same direction, however differences did not reach significance after FDR correction potentially due to reduced power on basis of smaller sample size (d = −0.108, p = 0.246, pFDR = 0.737; online Supplementary Table S4). GCC in UKB was non-significant after FDR correction (d = −0.058, pFDR = 0.051) and the effect size was not replicated in GS (d = −0.007, p = 0.937, pFDR = 0.937). As post-hoc analysis, we looked at case–control differences in (1) mean FA which represents the mean weight used to construct the weighted network measures, and (2) GEFF after controlling for mean FA. No significant differences in mean FA were observed (UKB: d = −0.012, p = 0.704; GS: d = −0.033, p = 0.734), and GEFF remained significant with similar effect sizes after controlling for mean FA (UKB: d = −0.076, p = 0.014; GS: d = −0.104, p = 0.283).

Figure 2. (a) Effect sizes for MDD case–control differences for the global network measures (GCC: global clustering coefficient; GEFF: global efficiency) for UKB and GS. The error bars represent the standard error of the estimate derived from the regression analysis. (b) All 85 nodes were ranked according to their node degree and sorted into four node tiers. T1 consists of nodes that are in the top 25% according to their degrees, and so on. To assess tier membership of nodes within each cohort, each node is assigned to the node tier that is the most dominant across all subjects in the subject group (cases or controls). (c) Effect sizes for MDD case–control differences for the tier-level network measures (tier-based CC; tier-based NEFF) for UKB and GS. The error bars represent the standard error of the estimate derived from the regression analysis. The list of nodes along with their abbreviations can be found in online Supplementary Table S1.
Tier level
Tier membership of nodes was highly consistent between cases and controls within each cohort (UKB: r s = 0.991; GS: r s = 0.740) and were similar between cohorts (cases: r s = 0.842; controls: r s = 0.842) (Fig. 2b). T1 corresponds to the rich club and it consists of regions involved in higher-order brain functions such as the thalamus, putamen, precuneus, superior frontal gyrus, and superior parietal cortex (based on results in UKB). NEFF of all tiers were significantly lower in MDD cases (T1: d = −0.076, pFDR = 0.020; T2: d = −0.069, pFDR = 0.020; T3: d = −0.075, pFDR = 0.020; T4: d = −0.079, pFDR = 0.020; Fig. 2c) and the above effect sizes were well-replicated in GS, albeit non-FDR-significant (T1: d = −0.108, p = 0.312, pFDR = 0.416; T2: d = −0.097, p = 0.306, pFDR = 0.416; T3: d = −0.075, p = 0.429, pFDR = 0.429; T4: d = −0.123, p = 0.205, pFDR = 0.416; Fig. 2c). Effect sizes for CC tier-based measures were less consistent between cohorts. Given the hierarchical structure of the data, significance of CC tier-based measures after multiple correction was not tested due to GCC not reaching significance.
Rich club organization
Both cases and controls in UKB exhibited rich club organization, as Φnorm(k) were greater than one over a range of degree k (k = 13 to k = 63, pFDR<0.005) (Fig. 3a and 3b). Similar results were observed in GS (online Supplementary Fig. S2). In UKB, significant case–control differences were observed at k = 16, k = 23, and k = 24 (pFDR = 0.017–0.027; Fig. 3c). However, these degree thresholds do not implicate the rich club and the absence of significant findings at the highest degrees suggests that there are no case–control differences in rich club organization. Likewise, no significant case–control differences were found in GS at all values of degree k (pFDR<0.05, online Supplementary Fig. S2).

Figure 3. We tested for the presence of rich club organization (i.e. whether hubs are more likely to be interconnected and have stronger connection among themselves than would occur by chance) in (a) cases and (b) controls in UKB. For (a) and (b), the x-axis represents the range of degree (k) tested, the primary y-axis represents the rich club coefficients derived from the original network (Φ(k); black line) and the randomly generated networks (Φrand(k); grey line), and the secondary y-axis represents the normalized rich-club coefficients (Φnorm(k); red line in (a), blue line in (b)). The shaded area represents the range of degree that showed significant rich club organization, which is indicated by a Φnorm(k) of greater than 1 over a continuous range of k. A comparison of Φnorm(k) for cases and controls is shown in (c).
Nodal level
The effect sizes for CC and NEFF of all nodes were generally consistent across cohorts (r s = 0.30), with cases consistently having lower values than controls (Fig. 4a and 4b). In UKB, the NEFF of nodes belonging predominantly to T1 were significantly lower in cases. These include the right thalamus (d = −0.085, pFDR = 0.035), right and left putamen (right: d = −0.094, pFDR = 0.013; left: d = −0.099, pFDR = 0.013), right and left pallidum (right: d = −0.113, pFDR = 0.013; left: d = −0.079, pFDR = 0.035), left precuneus (d = −0.080, pFDR = 0.035), left ventral diencephalon (d = −0.080, pFDR = 0.033), and the left insula (d = −0.099, pFDR = 0.016) belonging to T3 (Fig. 4c). No CC measures were significantly different in both cohorts.

Figure 4. (a) Effect sizes for MDD case–control differences in nodal network measures (CC: clustering coefficient; NEFF: nodal efficiency) in UKB and GS. For each network measure, segmentation maps representing cortical (left) and subcortical (right) regions are shown. (b) Correlation of the effect sizes for CC and NEFF of all regions in UKB and GS. (c) FDR-corrected p values for the NEFF of all nodes in UKB, grouped according to their tier membership. The blue dashed line represents the significance threshold at pFDR<0.05. Filled and labelled circles represent regions that survived FDR correction.
Connection level
No significant subnetworks were identified at the component-forming threshold of p < 0.05 in either UKB or GS. As recommended by the authors of NBS, the analysis was repeated at other component-forming thresholds (p < 0.005, p < 0.01, p < 0.1) but still no significant subnetworks were identified. As supplementary analysis, mass univariate testing for case–control differences at every connection was performed with permutation testing (50 000 times) and FDR correction applied across all tests. Again, no significant differences were found (pFDR>0.05).
Sensitivity analysis
Results at the global, tier, and nodal levels remained largely unchanged after additionally controlling for education level, household income, and body mass index (online Supplementary Tables S5–S6). Additionally, there were no significant differences between MDD cases with and without antidepressant use, suggesting that the effects of antidepressants on network measures are minimal in this sample (online Supplementary Table S7). There were no significant differences between MDD cases without antidepressant use and controls (online Supplementary Table S8), but the correlation of the effect sizes obtained here with those obtained in the main analysis was high (r s = 0.934, p < 0.001). Given that more severe cases are likely to take medication and our samples were community-based, it is possible that the removal of cases with antidepressant use may have simultaneously removed the more severe MDD cases, thus eliminating the significance of effects. Collectively, these results show that our main findings are related to the features of MDD and not driven by antidepressant exposure.
Null results
For null findings in the main analysis and sensitivity analysis, we additionally conducted Bayes factor (BF) analysis to better understand the strength of these findings (Keysers, Gazzola, & Wagenmakers, Reference Keysers, Gazzola and Wagenmakers2020). Further information and discussion of the results derived from the BF analysis can be found in the online Supplementary Tables S9 and S10.
Discussion
This study examined the connectomic differences between MDD cases and controls in a hierarchical manner. In the discovery sample, reduction in network efficiency in MDD cases was observed globally, across all tiers, and mainly in hubs locally. No case–control differences were observed for rich club organization and at the connection level. The effect sizes were generally consistent, albeit not significant, in the smaller replication sample, which we also statistically tested in a meta-analysis (online Supplementary Fig. S3).
The reduction of global network efficiency in MDD cases suggests that there is an overall reduction in the capacity of the network to communicate between regions. Efficiency measures are based on shortest path lengths, and the brain is optimized toward a low average shortest path length to ensure efficient communication (Kaiser, Martin, Andras, & Young, Reference Kaiser, Martin, Andras and Young2007). As edge-weighted network measures were used, differences in efficiency could be attributed to differences in weights or topology. Given the absence of case–control differences in mean FA and the significant reduction in global efficiency in MDD even after controlling for mean FA, the differences in network efficiency may possibly be due to topological differences. The differences are, however, likely to be subtle and dispersed across the network, given that no connected subnetworks were found to be significantly different between groups at the connection level. Likewise, the inability to detect significantly different connections at the current statistical power using mass univariate testing also hints at the subtlety of effects. Nevertheless, these results are still insightful as they seem to suggest that the brain is configured slightly differently in MDD and point to the importance of studying network organization alongside connectivity strength. These topological differences can be diathetic, a sequelae, or a form of adaptation to MDD, all of which are interesting possibilities that warrant further investigation.
Interestingly, the overall reduction in network efficiency is unlikely to be associated with hub–hub connections, as indicated by the absence of significant case–control differences in rich club organization. This could be because the rich club plays a crucial role in integrating information from numerous functionally specialized regions across the brain (Kaiser et al., Reference Kaiser, Martin, Andras and Young2007; van den Heuvel & Sporns, Reference van den Heuvel and Sporns2011), and contribute toward providing a foundational basis for the development and functional specialization of lower tier regions (Blesa et al., Reference Blesa, Galdi, Cox, Sullivan, Stoye, Lamb and Boardman2021). It is arguably evolutionarily adaptive to prioritize maintaining a stable and robust core to make it resilient to changes that could critically compromise functioning. While biologically costly to maintain the rich core, the high biological cost is offset by the functional benefits it confers for neural communication (Bullmore & Sporns, Reference Bullmore and Sporns2012; Collin, Sporns, Mandl, & van den Heuvel, Reference Collin, Sporns, Mandl and van den Heuvel2014). The manifestation of the effects of MDD in a subtle yet cumulative manner, unlike radiologically defined abnormalities that are immediately damaging, also lends support to the assertion that the rich core remains intact in MDD.
Hubs, however, may remain a key area of focus in MDD research, given that significant reductions in efficiency at the nodal level were mostly observed in T1 nodes. As rich connections between hubs have been shown above to be resilient to MDD-related changes, the differences seen in T1 may be driven by differences in feeder connections (hub to non-hub connections) instead. Hubs of interest include the thalamus, putamen, pallidum, precuneus, and ventral diencephalon, deficits which have been shown to be implicated in MDD (Kim et al., Reference Kim, Shin, Myung, Fava, Mischoulon, Papakostas and Jeon2019; Lebedeva et al., Reference Lebedeva, Westman, Borza, Beyer, Engedal, Aarsland and Haberg2017; Li, Rossbach, Zhang, Liu, & Zhang, Reference Li, Rossbach, Zhang, Liu and Zhang2018; Lu et al., Reference Lu, Liang, Han, Mo, Li, Cheng and Sun2016; Zhang et al., Reference Zhang, Zhang, Ai, Van Dam, Qian, Hou and Xu2022). Of note, these regions are mostly involved in reward processing and emotion regulation. The pallidum, putamen, and thalamus are part of the cortico-basal ganglia loop, which plays a central role in developing goal-directed behaviors (Haber, Reference Haber2016). Specifically, the putamen is part of the striatum (the main input structure of the basal ganglia) and receives input from various cortical structures including the anterior cingulate cortex and prefrontal cortex which comprise regions associated with reward and motivation. The pallidum, especially the ventral pallidum, is also key player in emotion processing, where it receives input from the limbic areas via the ventral striatum. Both putamen and pallidum project to the thalamus, which functions as a core information relay station from basal ganglia to the cerebral cortex and also contributes toward higher-order functions (Kumar, Beckmann, Scheffler, & Grodd, Reference Kumar, Beckmann, Scheffler and Grodd2022). Disruptions to this corticostriatal circuitry have been implicated in neuropsychiatric disorders including MDD (Gunaydin & Kreitzer, Reference Gunaydin and Kreitzer2016). The precuneus and ventral diencephalon are also involved in related processes, with the former playing a central role in the DMN responsible for internally orientated cognition (e.g. rumination) and the latter containing the hypothalamus which is a key region for stress response (Zhou et al., Reference Zhou, Chen, Shen, Li, Chen, Zhu and Yan2020). Thus, the implication of multiple regions involved in reward/emotion regulation processes suggests that differences in this circuitry may be more important in MDD (Ng, Alloy, & Smith, Reference Ng, Alloy and Smith2019; Park et al., Reference Park, Rosenblat, Lee, Pan, Cao, Iacobucci and McIntyre2019).
While our results point to the importance of hubs, they also suggest that hubs are not solely involved in the reduction of overall network efficiency in MDD. Reduction in tier-level efficiency was observed across all four hierarchical tiers, indicating that MDD-associated brain differences are pervasive, involving both hubs and non-hubs. Since the four tiers cover a broad set of categories of functional processing (Blesa et al., Reference Blesa, Galdi, Cox, Sullivan, Stoye, Lamb and Boardman2021; Smith et al., Reference Smith, Bastin, Cox, Valdés Hernández, Wiseman, Escudero and Sudlow2019), the widespread somatic, affective, and cognitive dysfunctions often observed in MDD may possibly be associated with changes in information flow in multiple regions belonging to different tiers. Interestingly, although MDD cases had lower efficiency at T2 to T4, there was an absence of significant findings at the nodal level for these tiers unlike for T1. This suggests that differences at these lower tiers may be a result of the accumulation of subtle reductions in the nodal efficiency of multiple nodes that were too small/insignificant to be detected individually at the nodal level. An exception would be the insula, which despite being a T3 node, also showed significant reduction in nodal efficiency. This could be due to its close proximity and connections with the abovementioned T1 nodes like the thalamus and putamen, likely necessary to support its diverse functions (including affective processes; Ghaziri et al., Reference Ghaziri, Tucholka, Girard, Boucher, Houde, Descoteaux and Nguyen2018), thus rendering its paths more susceptible to changes associated with MDD. In the same light, the significant reduction in efficiency of T1 nodes, as discussed above, is likely not attributable to large differences in only a few connections, but a result of the accumulation of subtle differences in the large number of connections surrounding it. In other words, the ability to identify significant findings in T1 nodes may be by virtue of the fact that these nodes have the highest number of connections and hence, the accumulation of more subtle differences around them.
Taking all these together, our results suggest that there are subtle, widespread, and possibly topology-related differences in the structural connectomes of MDD cases. The differences potentially build up in the order of hierarchy to effect changes that are detectable at the higher network organization levels (global, tier, and nodes in the top tier). The reasonable consistency of effect sizes in both samples suggests that the findings are likely true, although this can be determined definitively in the future using larger samples with preferably more than a thousand subjects for reliable results (Marek et al., Reference Marek, Tervo-Clemmens, Calabro, Montez, Kay, Hatoum and Dosenbach2022). While the small effect sizes may seem trivial, they are actually in line with recent meta-analytic and large consortia studies that found very small differences (<2% variance explained) in MDD across all neuroimaging modalities (Feng, Thompson, & Paulus, Reference Feng, Thompson and Paulus2022; Winter et al., Reference Winter, Leenings, Ernsting, Sarink, Fisch, Emden and Hahn2022). Our study conducted at a similar scale thus offers a connectomic perspective and provides further evidence for the notion that very subtle and potentially diffusely distributed brain-related differences exist in MDD.
While not the first to examine network measures in MDD, this study is one of the largest, well-powered, and most comprehensive hierarchical connectomic explorations of MDD to date. The use of two large samples is a strength, in that the results are generally replicable and can serve as a reliable reference for future studies. Limitations should, however, be considered. Firstly, it is known that network metrics can vary depending on various factors, such as the atlas used, thresholding method and tractography parameters, which still lack consensus in the scientific community (Adamovich, Zakharov, Tabueva, & Malykh, Reference Adamovich, Zakharov, Tabueva and Malykh2022; Wei, Cieslak, Greene, Grafton, & Carlson, Reference Wei, Cieslak, Greene, Grafton and Carlson2017). Our results may thus not hold if different approaches were taken. Secondly, our results may not be directly applicable to the more severe MDD cases, as GS and UKB are community-based cohorts consisting mainly of relatively healthy individuals. Our results, however, have the benefit of better generalizability to the community and likely cover abnormalities common across different severities/subtypes, thus providing a starting point for future in-depth analyses. We considered it essential to maximize sample size by minimizing exclusions to ensure sufficient power needed to detect small effects present in MDD.
Conclusion
This study presents a comprehensive approach to the hierarchical comparison of the structural connectomes of MDD cases relative to controls in two large population cohorts. The key takeaways include (1) there is an overall reduction in network efficiency in MDD, (2) the rich club core remains robust in MDD, and (3) the connectomic differences in MDD are subtle but widespread involving both hubs and non-hubs. This work can be extended in future studies by integrating functional connectivity data (e.g. the coupling between structural and functional connectivity) to gain further insights into the basis and consequences of reduced network efficiency in MDD.
Supplementary material
The supplementary material for this article can be found at https://doi.org/10.1017/S0033291724000643.
Acknowledgements
The research was conducted using the UK Biobank resource, with approved project number 10279 and 4844. Generation Scotland received core support from the Chief Scientist Office of the Scottish Government Health Directorates (CZD/16/6) and the Scottish Funding Council (HR03006) and is currently supported by the Wellcome Trust (216767/Z/19/Z). Genotyping of the Generation Scotland samples was carried out by the Genetics Core Laboratory at the Edinburgh Clinical Research Facility, University of Edinburgh, Scotland and was funded by the Medical Research Council UK and the Wellcome Trust. This research was funded in whole, or in part, by the Wellcome Trust (ELSC: 108890/Z/15/Z; MJA: 220857/Z/20/Z). A. S. was supported through the Wellcome-University of Edinburgh Institutional Strategic Support Fund (204804/Z/16/Z) and indirectly through the Lister Institute of Preventive Medicine Award (173096). S. R. C. is supported by a Sir Henry Dale Fellowship, jointly funded by the Wellcome Trust and the Royal Society Wellcome and The Royal Society (221890/Z/20/Z). S. R. C., C. R. B., M. E. B., I. J. D., and E. M. T.-D. are supported by the US National Institutes of Health (National Institute on Aging; R01AG054628).
Competing interests
A. M. M. previously received research grant support from The Sackler Trust, as well as speaker fees from Illumina and Janssen. No potential conflicts of interest are reported for the other authors.


 Open access