


Introduction
A wave of studies published in the wake of the 2016 and 2020 elections suggests that Americans’ political leanings and experiences are likely associated with their mental health conditions (e.g., Fraser et al., Reference Fraser, Aldrich, Panagopoulos, Hummel and Kim2022; Nayak et al., Reference Nayak, Fraser, Panagopoulos, Aldrich and Kim2021; Panagopoulos et al., Reference Panagopoulos, Fraser, Aldrich, Kim and Hummel2021). These studies build on literature that has found differences in life satisfaction and happiness between Republicans and Democrats (Lench et al., Reference Lench, Levine, Perez, Carpenter, Carlson and Tibbett2019; Schlenker et al., Reference Schlenker, Chambers and Le2012) and increases in election-related stress and anxiety (Majumder et al., Reference Majumder, Nguyen, Sacco, Mahan and Brownstein2017). The most recent studies link partisanship and partisan polarization with a range of health outcomes, including days of poor physical health (Fraser et al., Reference Fraser, Aldrich, Panagopoulos, Hummel and Kim2022; Panagopoulos et al., Reference Panagopoulos, Fraser, Aldrich, Kim and Hummel2021), days of poor mental health (Yan et al., Reference Yan, Hsia, Yeung and Sloan2021), depression (Nayak et al., Reference Nayak, Fraser, Panagopoulos, Aldrich and Kim2021; Yan et al., Reference Yan, Hsia, Yeung and Sloan2021), anxiety (Hackett et al., Reference Hackett, Gaffney and Data2018; Nayak et al., Reference Nayak, Fraser, Panagopoulos, Aldrich and Kim2021), stress (American Psychological Association [APA], 2017), sleep issues (Nayak et al., Reference Nayak, Fraser, Panagopoulos, Aldrich and Kim2021), and drinking (Musse & Schneider, Reference Musse and Schneider2023). To date, no study of which we are aware has examined whether elections are associated with post-traumatic stress. This study seeks to fill that void.
We expect that the experience of living through the 2020 presidential election in the United States was traumatic, at least for some voters. The election directly challenged some voters’ sense of security, both through day-to-day interactions with hostile opposing partisans and through threats of violence and interference with the peaceful transition of power. The Republican candidate’s refusal to accept the result led to vocal, if empirically unsupported, questions about the legitimacy of the election, a view ultimately held by large segments of the population and a majority of Republicans (Weinschenk et al., Reference Weinschenk, Panagopoulos and van der Linden2021). The resulting discord culminated in the January 6, 2021, riot, highlighted by a mob several-thousand strong storming the U.S. Capitol Building in Washington, DC, and interrupting a joint session of Congress engaged in certifying the electoral vote.
As the November 2020 election and the ensuing events unfolded, many Americans experienced shock and disbelief, even trauma. Contrary to popular belief, trauma is a continuous rather than a binary outcome, with some individuals experiencing more or less than others. In the political arena, those with greater emotional investment in partisan fortunes may be more vulnerable to experiencing political setbacks or defeat as traumatic. It is certain that increasing levels of partisan polarization have resulted in out-party attitudes becoming so hostile that they have been described as “fear and loathing” (Abramowitz & Saunders, Reference Abramowitz and Saunders2008; Almond & Verba, Reference Almond and Verba1960; Bankert, Reference Bankert2021; Iyengar et al., Reference Iyengar, Sood and Lelkes2012; Lauka et al., Reference Lauka, McCoy and Firat2018; Levendusky, Reference Levendusky2009). This tendency of partisans to dislike and distrust their opposites is well established as the phenomenon of affective polarization (Iyengar et al., Reference Iyengar, Lelkes, Levendusky, Malhotra and Westwood2019; Iyengar & Westwood, Reference Iyengar and Westwood2015). We expect that voters feeling particularly strong negative emotions toward opposing partisans might have experienced greater levels of election-related post-traumatic stress following the 2020 election, producing a potential measurable association.
To investigate these claims, we adapted a validated diagnostic screening tool for post-traumatic stress disorder (PTSD), the PCL-5 (Weathers et al., Reference Weathers, Litz, Keane, Palmieri, Marx and Schurr2013), to test the association between affective polarization and Americans’ levels of election-related post-traumatic stress. Drawing from a nationally representative survey sample of U.S. adults, we examined affective polarization’s relationship with PTSD while controlling for alternative explanations like partisanship, political engagement, demographics, and psychological traits, including personality. As a preview, we found preliminary evidence that a significant subset of Americans reported symptoms consistent with election-related post-traumatic stress following the 2020 election, much higher than would be expected from annual prevalence rates. Additionally, we found a positive association between greater levels of affective polarization and reports of election-related post-traumatic stress symptoms following the 2020 election, even after accounting for a wide range of other factors.
These findings are noteworthy, given the impact that PTSD can have on everyday life. Over three-quarters of individuals with PTSD share or develop another mental health condition, such as depression, anxiety, bipolar, or sleep disorders (Kessler et al., Reference Kessler, Sonnega, Bromet, Hughes and Nelson1995). Studies have also linked PTSD to increased risk of disability or chronic health impairments (McDevitt-Murphy et al., Reference McDevitt-Murphy, Williams, Bracken, Fields, Monahan and Murphy2010; Westphal et al., Reference Westphal, Olfson, Gameroff, Wickramaratne, Pilowsky, Neugebauer, Lantigue, Shea and Neria2011), as well as to substance abuse problems (Liebschutz et al., Reference Liebschutz, Saitz, Brower, Keane, Lloyd-Travaglini, Averbuch and Samet2007), especially hazardous drinking (McDevitt-Murphy et al., Reference McDevitt-Murphy, Williams, Bracken, Fields, Monahan and Murphy2010). The possibility that a single contentious election outcome could produce such long-term mental and emotional consequences for citizens is distressing. We aim to examine the prevalence and sources of election-related post-traumatic stress in the context of the 2020 U.S. presidential election.
Literature review
PTSD is a mental health condition in which individuals face difficulty recovering after experiencing a traumatic event. PTSD is characterized by several common symptoms, including but not limited to intrusive, unwanted memories and nightmares; avoidance; heightened reactions; anxiety; and mood changes (APA, 2017). Examples of PTSD-inducing trauma include crises (e.g., the World Trade Center bombing; see Weissman et al., Reference Weissman, Neria, Das, Feder, Blanco, Lantigua, Shea, Gross, Gameroff, Pilowsky and Olfson2005), disasters (e.g., earthquakes; see Kun et al., Reference Kun, Tong, Liu, Pei and Luo2013), and combat (McDevitt-Murphy et al., Reference McDevitt-Murphy, Williams, Bracken, Fields, Monahan and Murphy2010), but it may also occur in everyday settings, following car crashes (Barth et al., Reference Barth, Kopfmann, Nyberg, Angenendt and Frommberger2005), violence and abuse (Bell & Jenkins, Reference Bell and Jenkis1993), serious health problems (Mundy & Baum, Reference Mundy and Baum2004), or workplace trauma (e.g., in hospitals; see Newman et al., Reference Newman, Roche and Elliott2021).
While most people (51% of women and 60% of men) experience a traumatic event in their life (Kessler et al., Reference Kessler, Sonnega, Bromet, Hughes and Nelson1995), only some develop PTSD. The National Comorbidity Survey Replication (NCS-R), conducted between 2001 and 2003, estimated that adult Americans have a 6.8% (SE = 0.4) lifetime prevalence of PTSD (Kessler, Berglund et al., Reference Kessler, Berglund, Demler, Jin, Merikangas and Walters2005), compared with a 3.5% (SE = 0.3) annual prevalence (the chance of having PTSD in the past 12 months) (Kessler, Chiu et al., Reference Kessler, Chiu, Demler, Merikangas and Walters2005). Since then, studies have estimated that the lifetime prevalence rate for PTSD typically ranges between 5% and 10% for the general population (Greene et al., Reference Greene, Neria and Gross2016; Ozer et al., Reference Ozer, Best, Lipsey and Weiss2003). Estimates by Kessler and colleagues (Kessler, Berglund et al., Reference Kessler, Berglund, Demler, Jin, Merikangas and Walters2005; Kessler, Chiu et al., Reference Kessler, Chiu, Demler, Merikangas and Walters2005) remain highly regarded today because of their large sample size (n = 5,692), and so we adopt their annual prevalence of 3.5% in our analysis here. Higher rates have been detected in some primary care settings for veterans (39.1%; McDevitt-Murphy et al., Reference McDevitt-Murphy, Williams, Bracken, Fields, Monahan and Murphy2010), Black women (27%; Alim et al., Reference Alim, Graves, Mellman, Aigbogun, Gray, Lawson and Charney2006), Black men (20%; Alim et al., Reference Alim, Graves, Mellman, Aigbogun, Gray, Lawson and Charney2006), and even some community samples (29.3%; Westphal et al., Reference Westphal, Olfson, Gameroff, Wickramaratne, Pilowsky, Neugebauer, Lantigue, Shea and Neria2011). Though primary care physicians are typically the first health care practitioners that PTSD sufferers encounter after their trauma (Kessler, Berglund et al., Reference Kessler, Berglund, Demler, Jin, Merikangas and Walters2005; Lecrubier, Reference Lecrubier2004), they often fail to detect PTSD; therefore, the details of individuals’ exposure to trauma and symptoms are often unreported or underreported, leaving many with PTSD untreated (Graves et al., Reference Graves, Freedy, Aigbogun, Lawson, Mellman and Alim2011).
Psychological determinants of PTSD
Psychological and personality factors make some people more prone to PTSD than others (Calegaro et al., Reference Calegaro, Canova Mosele, Lorenzi Negretto, Zatti and Machado Freitas2019). This seems partially due to social relationships’ central role in PTSD: trauma caused by human actions (e.g., violence) results in PTSD more often than accidental sources of trauma (Kessler & Merikangas, Reference Kessler and Merikangas2004). Experiencing trauma is not the only cause of PTSD; witnessing traumatic events can produce the same consequences (Muldoon et al., Reference Muldoon, Lowe, Jetten, Cruwys and Haslam2021). Over time, trauma exposure is associated with a range of mental health and physical comorbidities (Felitti et al., Reference Felitti, Anda, Nordenberg, Williamson, Spitz, Edwards, Koss and Marks1998; Kessler et al., Reference Kessler, Sonnega, Bromet, Hughes and Nelson1995; Schnurr & Green, Reference Schnurr and Green2004).
Some research suggests that certain psychological and personality traits can act as a buffer against PTSD (Calegaro et al., Reference Calegaro, Canova Mosele, Lorenzi Negretto, Zatti and Machado Freitas2019). Resilience—an individual’s capacity to bounce back after a shock—has been linked to lower odds of PTSD (Calegaro et al., Reference Calegaro, Canova Mosele, Lorenzi Negretto, Zatti and Machado Freitas2019; Lee et al., Reference Lee, Ahn, Jeong, Chae and Choi2014). Higher PTSD prevalence also accompanies tendencies toward avoiding harm (e.g., caution, vigilance, and aspects of negative emotionality like jealousy), as well as self-transcendence (e.g., altruism, openness, lack of dogmatism, as opposed to individualistic, materialistic, and more dogmatic tendencies) (Calegaro et al., Reference Calegaro, Canova Mosele, Lorenzi Negretto, Zatti and Machado Freitas2019).
Social determinants of PTSD
Scholarship has also demonstrated that some demographics experience PTSD more often than others (Greene et al., Reference Greene, Neria and Gross2016). Vulnerable communities tend to face worse mental and physical health outcomes relative to the general population, a phenomenon termed the “social determinants of health” (Marmot, Reference Marmot2015; Marmot & Allen, Reference Marmot and Allen2014; World Health Organization [WHO], 2008). These higher rates are not due to biological predispositions but to added stressors, vulnerability, risk, discrimination, and exposure to trauma that people in these communities face on a daily basis (Bailey et al., Reference Bailey, Feldman and Bassett2021; Boyd et al., Reference Boyd, Lindo, Weeks and McLemore2020). Increased vulnerabilities to negative health outcomes have been documented for women (Hoffman & Tarzian, Reference Hoffmann and Tarzian2001); elders (Burnes et al., Reference Burnes, Sheppard, Henderson, Charles, Wassel, Cope, Barber and Pillemer2019); racial (Gilbert et al., Reference Gilbert, Ray, Siddiqi, Shetty, Baker, Elder and Griffith2016), ethnic (Bacong, Reference Bacong2021), and religious minorities (Martin, Reference Martin2015); LGBTQ+ communities (Dominey-Howes et al., Reference Dominey-Howes, Gorman-Murray and McKinnon2016); people with health conditions or disabilities (Uscher-Pines et al., Reference Uscher-Pines, Hausman, Powell, DeMara, Heake and Hagen2009); residents in lower-income neighborhoods (Ruel et al., Reference Ruel, Reither, Robert and Lantz2010); those living in poverty (Mackenbach et al., Reference Mackenbach, Bopp, Deboosere, Kovacs, Leinsalu, Martikainen, Menvielle, Regidor and de Gelder2017); and those who are less educated (Fletcher, Reference Fletcher2015), unemployed (Bender & Theodossiou, Reference Bender and Theodossiou2015), or uninsured (Virgo et al., Reference Virgo, Burkhardt, Cokkinides and Ward2010).
A review of PTSD research (Greene et al., Reference Greene, Neria and Gross2016) reports higher diagnosis rates of PTSD in women versus men (e.g., Alim et al., Reference Alim, Graves, Mellman, Aigbogun, Gray, Lawson and Charney2006; Westphal et al., Reference Westphal, Olfson, Gameroff, Wickramaratne, Pilowsky, Neugebauer, Lantigue, Shea and Neria2011), younger versus older people (Grubaugh et al., Reference Grubaugh, Magruder, Waldrop, Elhai, Knapp and Frueh2005), those with no college education (Gillock et al., Reference Gillock, Zayfert, Hegel and Ferguson2005), and the unemployed (Gillock et al., Reference Gillock, Zayfert, Hegel and Ferguson2005; Liebschutz et al., Reference Liebschutz, Saitz, Brower, Keane, Lloyd-Travaglini, Averbuch and Samet2007). Higher rates also have been detected among the unmarried (Liebschutz et al., Reference Liebschutz, Saitz, Brower, Keane, Lloyd-Travaglini, Averbuch and Samet2007), separated, or divorced (Bruce et al., Reference Bruce, Weisberg, Dolan, Machan, Kessler, Manchester, Culpepper and Keller2001; Weissman et al., Reference Weissman, Neria, Das, Feder, Blanco, Lantigua, Shea, Gross, Gameroff, Pilowsky and Olfson2005) and people of color, including Hispanic (Neria et al., Reference Neria, Gross, Olfson, Gameroff, Wickramaratne, Das, Pilowsky, Feder, Blanco, Marshall, Lantigua, Shea and Weissman2006) and Black residents specifically (Alim et al., Reference Alim, Graves, Mellman, Aigbogun, Gray, Lawson and Charney2006).
Political polarization and election-related post-traumatic stress
Evidence in recent years suggests an unexpected addition to the social determinants of post-traumatic stress in the context of elections: partisan polarization. At a macro scale, partisan polarization refers to the growing gap in political beliefs and social identity between Democrats and Republicans in the United States. While early scholars wondered whether polarization was occurring only among political elites (Fiorina & Abrams, Reference Fiorina and Abrams2009; Fiorina et al., Reference Fiorina, Abrams and Pope2005, Reference Fiorina, Abrams and Pope2008) and not the public (Abramowitz & Saunders, Reference Abramowitz and Saunders2008; Levendusky, Reference Levendusky2009), a decade of polarization research has formed a consensus that ordinary Americans are increasingly politically divided (Iyengar et al., Reference Iyengar, Sood and Lelkes2012; Iyengar & Westwood, Reference Iyengar and Westwood2015; Webster & Abramowitz, Reference Webster and Abramowitz2017). These trends often feed on each other: a polarized public leads to polarized elites (Diermeier & Li, Reference Diermeier and Li2019), polarized elites lead to a polarized public (Banda & Cluverius, Reference Banda and Cluverius2018; Druckman et al., Reference Druckman, Peterson and Slothuus2013), and hyperpartisan media outlets may increase polarization by proliferating partisan-favored issues while neglecting middle-ground content (Schroeder & Stone, Reference Schroeder and Stone2015).
Polarization and health. Since the 2016 election, scholars have linked growing divisions within American communities to changes in several health indicators. For example, politically isolated residents report more days of poor physical health (Fraser et al., Reference Fraser, Aldrich, Panagopoulos, Hummel and Kim2022; Nayak et al., Reference Nayak, Fraser, Panagopoulos, Aldrich and Kim2021; Panagopoulos et al., Reference Panagopoulos, Fraser, Aldrich, Kim and Hummel2021) and poor mental health (Yan et al., Reference Yan, Hsia, Yeung and Sloan2021), including increased incidence of depression (Yan et al., Reference Yan, Hsia, Yeung and Sloan2021), anxiety (Hackett et al., Reference Hackett, Gaffney and Data2018; Nayak et al., Reference Nayak, Fraser, Panagopoulos, Aldrich and Kim2021), stress (APA, 2017), sleep issues (Nayak et al., Reference Nayak, Fraser, Panagopoulos, Aldrich and Kim2021), and drinking (Musse & Schneider, Reference Musse and Schneider2023). A national survey conducted in 2017 revealed that 11.5% of Americans believed that politics had adversely affected their physical health, with 40% reporting higher stress due to politics, 20% reporting lost sleep, and 20% reporting lost friendships due to their political views (Smith et al., Reference Smith, Hibbing and Hibbing2019). Follow-up surveys conducted between 2017 and 2020 found that young, politically engaged, and left-wing voters all experienced increases in chronic stress (Smith, Reference Smith2022).
Social context and networks. Past research suggests that partisanship and its impacts are closely shaped by social context. When surrounded by members of one’s own party, voters tend to demonstrate more partisan-motivated reasoning, but when embedded in a heterogenous group, voters’ level of negative affect tends to be dampened and the intensity of their partisanship tends to decrease (Klar, Reference Klar2014; Mutz, Reference Mutz2002). Similarly, past studies found that greater levels of general social trust helped insulate politically isolated individuals from the harmful effects of political differences on health (Panagopoulos et al., Reference Panagopoulos, Fraser, Aldrich, Kim and Hummel2021) and boosted respondents’ likelihood of getting vaccinated against COVID-19 (Dolman et al., Reference Dolman, Fraser, Panagopoulos, Aldrich and Kim2023). Scholars hypothesize that voters’ recent experiences with members of the opposing party are increasingly negative, making them feel more politically isolated in their community (Fraser et al., Reference Fraser, Aldrich, Panagopoulos, Hummel and Kim2022) and leaving them facing greater stress and anxiety (Smith, Reference Smith2022; Yan et al., Reference Yan, Hsia, Yeung and Sloan2021), with fewer contacts to turn to when facing poor physical or mental health (Kawachi, Reference Kawachi, Subramanian and Kim2008; Panagopoulos et al., Reference Panagopoulos, Fraser, Aldrich, Kim and Hummel2021).
Affective polarization. Recent studies have coined the term affective polarization (Iyenger et al., Reference Iyengar, Sood and Lelkes2012) to describe individuals who ascribe particularly negative partisan views not just to parties, policies, or values but also to ordinary members of the opposing party, leading them to become socially disconnected from opposing partisans in their broader communities. (Affective polarization is distinct from general social isolation; such negatively partisan individuals can still be closely socially connected with members of their social in-groups or across group lines not related to politics.) Individuals experiencing greater affective polarization tend to view elections with high stakes (Ward & Tavits, Reference Ward and Tavits2019). This may occur because people view their partisan attachments as part of their social identities; consequently, an electoral loss—or an attack on their party or preferred candidates—is perceived as a direct affront to themselves and their in-groups (Abramowitz & McCoy, Reference Abramowitz and McCoy2019; Chen & Rohla, Reference Chen and Rohla2018; Cramer, Reference Cramer2016; Mason, Reference Mason2018; Oberhauser et al., Reference Oberhauser, Krier and Kusow2019).
A traumatic election? As a result, we might expect that the lead-up to, and aftermath of, the 2020 U.S. presidential election might have been traumatic for these voters. Past studies have documented elevated stress during in-person voting by measuring cortisol levels in field experiments during the U.S. 2012 election (Neiman et al., Reference Neiman, Giuseffi, Smith, French, Waismel-Manor and Hibbing2015) and Israel’s 2009 national election (Waismel-Manor et al., Reference Waismel-Manor, Ifergane and Cohen2011). Recent elections may have provoked even greater stress responses: some dubbed the 2016 election a “collective moral injury” (Brenner, Reference Brenner2017), and the 2020 election seems to have exacted a similar cost. As we discuss later, some residents were no longer certain that they could count on their fellow Americans to uphold basic electoral norms, such as accepting the outcome of an election no matter which party wins or disavowing political violence and voter intimidation (Braver Angels, Reference Angels2020; Cameron, Reference Cameron2022; Delgado, Reference Delgado2020; North, Reference North2020; Weinschenk et al., Reference Weinschenk, Panagopoulos and van der Linden2021).
For example, among political elites and political organizers, Democratic Party leaders and activists talked openly about how to respond if the Republican candidate refused to concede, which he did. A YouGov survey conducted in December 2020 estimated that although 74% of Americans accepted the 2020 presidential results, Americans who did and did not accept the results tended to believe that most Americans felt the same as themselves; this trend highlights entrenched views that may further isolate some voters (Weinschenk et al., Reference Weinschenk, Panagopoulos and van der Linden2021). Weeks of questioning the legitimacy of the election’s outcome culminated in the January 6 riot and the storming of the U.S. Capitol, which resulted in seven deaths (Cameron, Reference Cameron2022). This feeling of urgency extended to individual voters, too. For example, a YouGov poll conducted between September 18 and 24, 2020, reported that 55.84% of Americans expected an increase in violence as a result of the election, while 50% expected that Americans would not agree on who had legitimately won the election (Braver Angels, Reference Angels2020). Reporters documented anecdotal accounts of some Republican and Democratic supporters stockpiling emergency supplies, making safety plans with neighborhoods, and some businesses boarding up ahead of the election (Delgado, Reference Delgado2020; North, Reference North2020).
These jarring experiences left some strong Democratic and Republican partisans feeling alienated and dismayed by friends, coworkers, and family members who believed in a different election outcome, some of whom began promoting alarming ideas about how to change that result (Pinsker, Reference Pinsker2021). This closely matches the definition of moral trauma, the distress that individuals feel when they “perpetrate, fail to prevent, or witness events that contradict deeply held moral beliefs and expectations” (Norman & Maguen, Reference Norman and Maguen2021). Past studies indicate that moral trauma often co-occurs with PTSD and is a strong predictor of PTSD and its diagnostic components (Barnes et al., Reference Barnes, Hurley and Taber2019; Papazoglou et al., Reference Papazoglou, Blumberg, Chiongbian, Tuttle, Kamkar and Chopko2020). To the authors’ knowledge, moral trauma has less often been applied to politics than other spheres of life, but it represents a viable path by which individuals could experience PTSD after the election.
To clarify, moral injury theory does not suppose that mere exposure to different ideas or political stances leads to PTSD. Instead, the moral trauma of the election could also directly impact people’s sense of security: residents may feel anxious and vulnerable to new, unexpected threats to their social, economic, or physical security when encountering partisan others, be it when heckled by a street demonstrator, when asked by a coworker or employer, or when a neighbor turns aggressive. We suspect that frequent, in-person exposure to hostility and threats from members of the opposing party in people’s everyday lives could result in elevated PTSD symptoms. This is a much clearer causal mechanism, which aligns with the standard view that exposure to threat is typically required for PTSD.
Hypotheses
Based on the literature summarized here, we expect the 2020 election may have induced election-related post-traumatic stress in the American electorate. While it is not possible to demonstrate a causal relationship from observational survey data alone, this study aims to evaluate the current status of election-related PTSD symptoms and investigate key correlates.
First, we hypothesize that (H1) when specifically prompted about the 2020 election, the proportion of Americans reporting symptoms consistent with election-related post-traumatic stress will be significantly greater than the annual prevalence of PTSD in the United States (3.5%; Kessler, Chiu et al., Reference Kessler, Chiu, Demler, Merikangas and Walters2005). This would suggest that perhaps the election and/or its sociopolitical dynamics produced election-related post-traumatic stress symptoms above and beyond what we would normally expect outside of elections. If Americans did not report PTSD symptoms considerably beyond the usual annual prevalence, that would indicate that any election association reflects random noise.
Second, we hypothesize further that (H2) individuals with higher levels of affective polarization (or negative feelings towards members of the opposing party) should report symptoms consistent with higher levels of election-related post-traumatic stress in the wake of the election. While past studies have estimated the mental health effects of perceived ideological distance from members of the opposing party (Panagopoulos et al., Reference Panagopoulos, Fraser, Aldrich, Kim and Hummel2022), political engagement (Smith, Reference Smith2022), and presidential vote choice (Yan et al., Reference Yan, Hsia, Yeung and Sloan2021), we expect that affective polarization, in particular, could be positively associated with higher election-related post-traumatic stress levels, independent of the impact of partisanship, political engagement, and other sociodemographic factors.
Methods
This study examines whether some respondents experienced higher levels of post-traumatic stress symptoms following the 2020 election and why, particularly testing the association between affective polarization and election-related post-traumatic stress. Between November 16 and 30, 2020, we partnered with YouGov to field a national survey of 618 U.S. adults, weighted to be representative of the U.S. adult population. In the main analyses that follow, we zoom in on respondents who indicated that they were Republicans, Democrats, or independents (n = 573).Footnote 1 This project was approved by the University of Nebraska–Lincoln Institutional Review Board (Project ID# 20601). All survey participants consented via an online statement. We exploit these data to estimate a series of statistical models to examine the impact of affective polarization on PTSD outcomes, controlling for a range of other social, psychological, and political variables.
Dependent variable
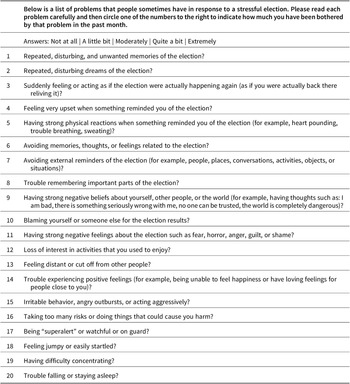
For our main outcome of interest, election-related trauma (PTSD), we used a modified version of the 20-item PCL-5, which assesses symptoms of post-traumatic stress based on definitions from the Diagnostic and Statistical Manual of Mental Disorders, 5th Edition. Developed by Weathers et al. (Reference Weathers, Litz, Keane, Palmieri, Marx and Schurr2013), the PCL-5 has been successfully validated in several studies (Blevins et al., Reference Blevins, Weathers, Davis, Witte and Domino2015; Bovin et al., Reference Bovin, Marx, Weathers, Gallagher, Rodriguez, Schnurr and Keane2016; Wortmann et al., Reference Wortmann, Jordan, Weathers, Resick, Dondanville, Hall-Clark, Foa, Young-McCaughan, Yarvis, Hembree, Mintz, Peterson and Litz2016). Respondents were prompted with “a list of problems that people sometimes have in response to a stressful election” (in the original PCL-5, a “very stressful experience”) and then asked to rank how much they had experienced that problem in the past month. Respondents ranked each of 20 items on a 5-point ordinal scale from 0 to 4, ranging from “not at all” (0), “a little bit” (1), “moderately” (2), “quite a bit” (3), to “extremely” (4), where higher scores indicate greater distress. These questions are listed in Table A1.
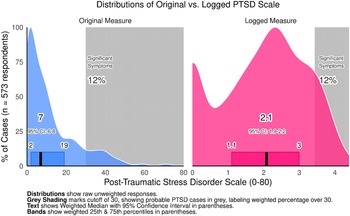
The items were then added together to produce a scale ranging from 0 to 80, where scores of 31 or higher are indicative of probable PTSD across samples (National Center for PTSD, 2022a). This distribution was heavily right-skewed, as shown in Figure A1, with an interquartile range of about 2 and 17 points. To account for this, the statistical models we estimate here used logged measures of the PTSD score, plus a small constant of one, since zero cannot be log transformed, as the dependent variable.
While the PCL-5 has been validated as a diagnostic screening tool for PTSD, as mentioned earlier (e.g., Blevins et al., Reference Blevins, Weathers, Davis, Witte and Domino2015; Bovin et al., Reference Bovin, Marx, Weathers, Gallagher, Rodriguez, Schnurr and Keane2016), our modified PCL-5 is new and should be interpreted with reasonable caution. Admittedly, our modification to the PCL-5 is extremely minor—replacing “very stressful experience” with “stressful election”—so we expect that it retains most of the original PCL-5’s ability to screen for post-traumatic stress. Several considerations help ensure that the modified PCL-5 measures the election-related symptoms of PTSD it claims to: (1) internal consistency testing and (2) conceptually distinct wording.
First, we evaluated the internal validity of the modified PCL-5 using Cronbach’s alpha, investigating whether respondents tended to consistently report similar scores across component questions. If so, this would suggest that the indicators in the PCL-5 measure the same general concept. These 20 items in the modified PCL-5 had extremely high internal consistency, as shown by a Cronbach’s alpha statistic of 0.946, which normally ranges from 0 (minimal) to 1 (maximal). This closely matches internal consistency for the original PCL-5 by Blevins et al. (Reference Blevins, Weathers, Davis, Witte and Domino2015) (alpha = 0.94, n = 278) and Bovin et al. (Reference Bovin, Marx, Weathers, Gallagher, Rodriguez, Schnurr and Keane2016) (alpha = 0.96, n = 468).
Second, the modified PCL-5’s questions are conceptually distinct from other questions asked about respondents’ politics. Our measure of affective polarization, discussed further later, evaluates several types of negative feelings toward members of the opposing party, but the PCL-5 lists 20 different PTSD symptoms, each posing very real challenges to people’s lives. These include disturbing dreams, unwanted memories, automatic negative thoughts, aggression, heart palpitations, et cetera. Rather than capturing everyday “negative feelings” related to political ideology, the PCL-5’s items are designed to flag serious physical and emotional issues stemming from a stressful event (in this case, the election).
Similarly, asking respondents about a “stressful election” does not prime respondents to respond any more negatively than the original PCL-5’s mention of a “very stressful experience.” The PCL-5 is also often administered in event-specific settings, screening combat veterans or victims of assault or harassment. Mentioning the election here actually helps our modified questionnaire narrow in, so that our measure is less likely to capture PTSD symptoms that are not brought to mind by the election and more likely to capture actual election-related PTSD symptoms.
Difference of proportions
As expected, we found that, overall, the November 2020 election was accompanied by relatively sizable levels of PTSD symptoms reported by a representative weighted sample of the American population. We investigate the descriptive statistics of the outcome variable. We calculated the weighted percentage and 95% confidence interval of respondents reporting levels of post-traumatic stress of 31 points or more, indicating probable PTSD. While there are no previous benchmarks of electoral PTSD to compare with, Kessler, Chiu et al.’s (Reference Kessler, Chiu, Demler, Merikangas and Walters2005) national annual prevalence of 3.5% can serve as a hypothetical benchmark. The 3.5% rate (95% CI: 2.9%– 4.1%) refers to the national prevalence of PTSD cases among U.S. adults during any given year. With the 2020 census estimating 258.3 million adults in the United States, that is approximately 9 million adults (95% CI: 7.5 million–10.6 million) (Kessler, Chiu et al., Reference Kessler, Chiu, Demler, Merikangas and Walters2005; National Center for PTSD, 2022b).
As our null hypothesis, we expect that if the election did not yield measurably large, statistically significant levels of PTSD in the population, then the percentage reporting scores higher than 30 would, at worst, match usual rates of PTSD from any cause at 3.5%. We verified this descriptive hypothesis using weighted independent-sample difference of proportions tests, with two-tailed tests to be conservative. Finally, we compared results for respondents overall with results for Republicans, Democrats, and independents.
Independent variables
For our main independent variable, affective polarization, we used the negative partisan identity scale (NPIS) developed by Bankert (Reference Bankert2021). Respondents were asked to rank how often they had experienced each of the eight items listed in Table A2, ranked on a 4-point scale including “never/rarely” (1), “sometimes” (2), “often” (3), and “always” (4). These scores demonstrated high internal consistency, with a Cronbach’s alpha statistic of 0.884, far above the typical acceptable threshold of 0.70. These scores were then averaged to produce a measure from 0 to 1, where 0 indicates no particular negative feelings toward members of the opposing party, while 1 indicates strong, intense negativity toward opposing partisans.
The NIPS is a close cousin of past measures of affective polarization, which measured how upset respondents would be if their child married a member of the opposing party (Almond & Verba, Reference Almond and Verba1960), which positive and negative words they connect with each party (Iyengar et al., Reference Iyengar, Sood and Lelkes2012), and which party’s candidates they would never vote for (Lauka et al., Reference Lauka, McCoy and Firat2018). The eight items in Table A2 capture several different negative feelings, closely overlapping with these past measures.
How can we be certain that the negative partisanship scale is capturing affective political polarization and not just social isolation during the pandemic? All of the eight questions in the NPIS specifically highlight respondents’ feelings for the opposing party, responding to statements such as “When I meet somebody who supports this party, I feel disconnected” and “I get angry when people praise this party.” However, a person with such negative partisan sentiments would not necessarily be socially isolated! They might certainly have strong intragroup ties to members of their own political and social groups; they could even have strong intergroup ties with social groups unrelated to politics. (We are hopeful that subsequent research will disentangle further the differential impact of polarization versus social connectivity on health outcomes.)
Modeling and estimation strategy
We developed and estimated a series of ordinary least squares regression models to predict PTSD reports using a logged measure of the outcome variable as described earlier. In Model 1, we tested the direct association between logged PTSD scores and affective polarization. We then embellished this specification and estimated a series of additional models incorporating additional variables as described here.
Partisanship. In Model 2, we added categorical controls for a 3-point scale of partisanship (Democrat/independent/Republican), where independents acted as the baseline category, allowing us to control separately for the impact of partisan identification.
Political engagement. In Model 3, we added controls for various forms of political engagement, since those who are more politically active may be more likely to feel the emotional impacts of an election, including political knowledge, political participation, and political interest. The Political Knowledge Scale is derived from the Pew Research Center’s Civic Knowledge quiz, which ranks citizens’ knowledge from 0 (low) to 7 (high) based on their ability to answer seven questions about American government. The Political Participation Scale, ranging from 1 (low) to 5 (high), counts the number of forms of political participation a respondent has exercised, including publicly expressing support for a political campaign or candidate on social media; working or volunteering for a political campaign; contributing money to any political cause, party, or candidate; holding government office; and contacting their elected official. Finally, political interest measures how often respondents report following political news, where 1 = most of the time and 4 = hardly at all.
Basic demographics. In Model 4, we added controls for basic demographics, including respondents’ gender (male/female), age, race (Black = 0/1, Hispanic = 1/0), and education (some college or more versus no college education).
Psychological factors. In Model 5, we added controls for psychological factors, including measures of resilience and dogmatism, since respondents with greater levels of psychological resilience may be less likely to experience trauma but those with more dogmatic perspectives may be more shaken by unexpected electoral outcomes.
To measure resilience, we used Smith and colleagues’ (Reference Smith, Dalen, Wiggins, Tooley, Christopher and Bernard2008) resilience scale, where respondents ranked themselves on a 5-point Likert scale from “strongly disagree” to “strongly agree” in terms of six phrases: “I trend to bounce back quickly after hard times,” “I have a hard time making it through stressful events,” “It does take me long to recover from a stressful event,” “It is hard for me to snap back when something bad happens,” “I usually come through difficult times with little trouble,” and “I tend to take a long time to get over set-backs in my life.” These six items were then recoded so that 5 indicates the more resilient outcome, and then averaged such that 0 means less resilience and 1 means greater resilience to crisis.
Then, to measure dogmatism, respondents rated themselves on a 5-point Likert scale from “strongly agree” to “strongly disagree” in response to the following two statements: “set in my ways, convinced my views are correct” and, “open minded, open to different points of view.” Scores ranged from 1 to 5, where 1 indicates less dogmatic and 5 indicates more dogmatic; they were then summed together to create a 10-point scale.
Extended demographics. In Model 6, we added extended demographic controls, including, family income (coded as a numeric variable from 1 to 16Footnote 2), whether respondents were unemployed (binary), whether they were married (binary), and whether they had children (binary).
Robustness tests
As robustness tests, we estimated two additional specifications. Model 7 added controls for the “Big Five” personality types: extraversion, agreeableness, conscientiousness, negative emotionality, and openness (Soto et al., Reference Soto and John2017a, Reference Soto and John2017b). We expect that respondents with higher negative emotionality and lower openness might be more susceptible to election-related post-traumatic stress after an election. Each was measured using a 5-point scale, where 1 indicates less of that trait and 5 indicates more of that trait. Second, we compared these results to a final specification (Model 8) controlling for vote choice in the 2020 presidential election as an alternative to partisan identification using a dichotomous variable testing whether they voted for Donald Trump (1), 0 otherwise.Footnote 3 Consistent results will help contextualize whether effective polarization is linked to greater PTSD even after accounting for the respondents chosen candidate won or lost the election.
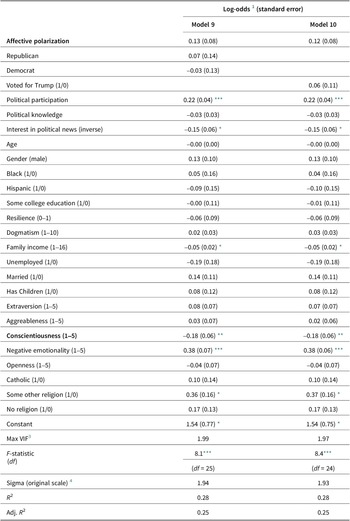
Our 23 model covariates covered as broad a spectrum of social determinants of health as available in this survey (Marmot & Allen, Reference Marmot and Allen2014; WHO, 2008). In the final validation models in Table A3, we added controls for religious affiliation to both Models 7 and 8, producing Models 9 and 10, respectively. Religion was broken into four categories: Protestant (n = 187), Catholic (n = 115), some other religion (n = 71, due to small-N), or none (n = 200, including atheist, agnostic, and no particular preference). With 27 statistical controls, the significance of effects decreased to p = .124~.127, but the effect of affective polarization (discussed in the Results section) retained its direction and strength (beta = 0.12~0.13).
Other covariates, like military service or sexual orientation, might also correlate with PTSD levels normally, but these were not available, and it was not clear that they would correlate with election-specific stress. Similarly, physical and mental health metrics were not included as covariates because they are endogenous to the outcome; PTSD may also result in physical health symptoms (e.g., back pain), and many people with PTSD also go on to develop comorbid mental health conditions like anxiety or depression (Felitti et al., Reference Felitti, Anda, Nordenberg, Williamson, Spitz, Edwards, Koss and Marks1998; Kessler et al. Reference Kessler, Sonnega, Bromet, Hughes and Nelson1995; Schnurr & Green, Reference Schnurr and Green2004). Controlling for these would mute real variation in PTSD levels. However, we encourage future studies to investigate variation in election-related PTSD levels among additional demographic groups.
We imputed missing data points using multiple imputation in the mice package in R, drawing on latent trends between variables to fill in data points, using 10 imputed data sets for added robustness.Footnote 4, Footnote 5 Fortunately these models demonstrated no considerable multicollinearity, as the variance inflation factors for variables never exceeded 2.5 in these models (details available upon request). This is far from 10, the threshold for problematic collinearity and quite close to 2.5, the gold standard. All models used poststratification sampling weights to ensure that our results are representative of the U.S. population.
Simulation
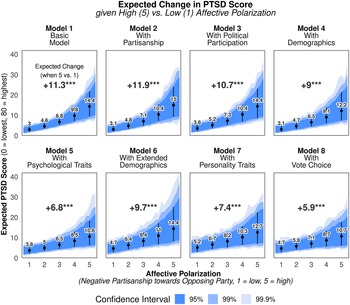
Further, to visualize one key result, we display the results of a series of statistical simulations in Figure 1 on the effect of affective polarization on PTSD, using the standard methods of King et al. (Reference King, Tomz and Wittenberg2000) to account for estimation uncertainty and fundamental uncertainty. Drawing from 1,000 simulations from a multivariate normal distribution, we simulated the median expected levels of PTSD (in their original units) within a 95%, 99%, and 99.9% confidence interval for a respondent with mean or modal traits except for their level of affective polarization (negative partisan identity), which we varied from 1 to 5. From this, we calculated the median increase in PTSD levels expected for an average respondent with maximal levels of affective polarization (5), compared to one with minimal levels of affective polarization (1), highlighted at the top of each panel in Figure 1. Simulation has the added benefit of being robust to heteroscedasticity, since it lies on multivariate normal distributions, not standard errors, which heteroscedasticity compromises.

Figure 1. Simulated Change in Electoral PTSD given Rising Affective Polarization
Results
First, we expected that respondents would report relatively sizable levels of election-related PTSD symptoms following the 2020 election. The weighted median respondent in our sample scored 7 (95% CI: 6.0–8.0), but levels varied greatly, ranging from 2 at the 25th percentile to as high as 19 at the 75th percentile (highlighted in the distributions in Figure A1). Most respondents remained under the 30-point threshold for significant symptoms, but not all. We report the percentage of respondents with levels of PTSD over 30 points in Table 1.
Table 1. Percentage of respondents with probable PTSD from the 2020 election.

Note: Probable PTSD is defined as a score over 30 points. Percentages reflect nationally representative weighted proportions.
Our weighted survey estimates imply that 12.5% of Americans overall may report experiencing probable PTSD symptoms related to the 2020 election (with a 95% confidence interval from 9.2% to 15.9%); probable PTSD is defined here as levels of election-related post-traumatic stress exceeding the standard cutoff of 30 out of 80 points. Broken down by party affiliation, Democrats and Republicans in our sample were similarly prone to report election-related PTSD symptoms, at 15.0% of Republicans (95% CI: 8.8%~21.3%) and 13.5% among Democrats (95% CI: 8.2%~18.7%), compared to 7.5% of independents (95% CI: 1.8%~13.3%). These party differences were not statistically significant. (Indeed, the following models similarly show no particular party differences in reported election-related PTSD levels.) It is noteworthy, however, that each of these rates is considerably higher than the typical annual rate of PTSD among U.S. adults (3.5%) (Kessler, Berglund et al., Reference Kessler, Berglund, Demler, Jin, Merikangas and Walters2005).
Further, we compared our observed rates of probable election-related PTSD with our hypothetical benchmark of 3.5% (the observed annual prevalence of PTSD in the United States). When compared with the standard prevalence of 3.5%, respondents overall (+9.0%), Democrats (+11.5%), and Republicans (+10.0%) reported experiencing election-related PTSD levels that were statistically significantly higher than the national annual prevalence rate (p < .001). The election-related PTSD level among independents was somewhat higher, but not as significantly so (+4.0%, p = .063). These results suggest a considerably higher than ordinary level of PTSD-related responses when we asked respondents about the election. (See Table A4 for further details on our difference of proportions tests.)
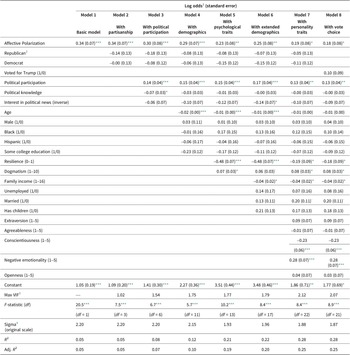
Second, a key aim of this study is to explain which Americans experienced election-related PTSD in the context of the November 2020 U.S. presidential election. We are especially interested in the association between affective polarization and levels of post-traumatic stress related to the 2020 election. Next, we present the results of our eight models from Table 2 separately, drawing on the results of our statistical simulations of the expected effect of affective polarization on election-related post-traumatic stress levels, shown in Figure 1.
Table 2. Ordinary least squares models.
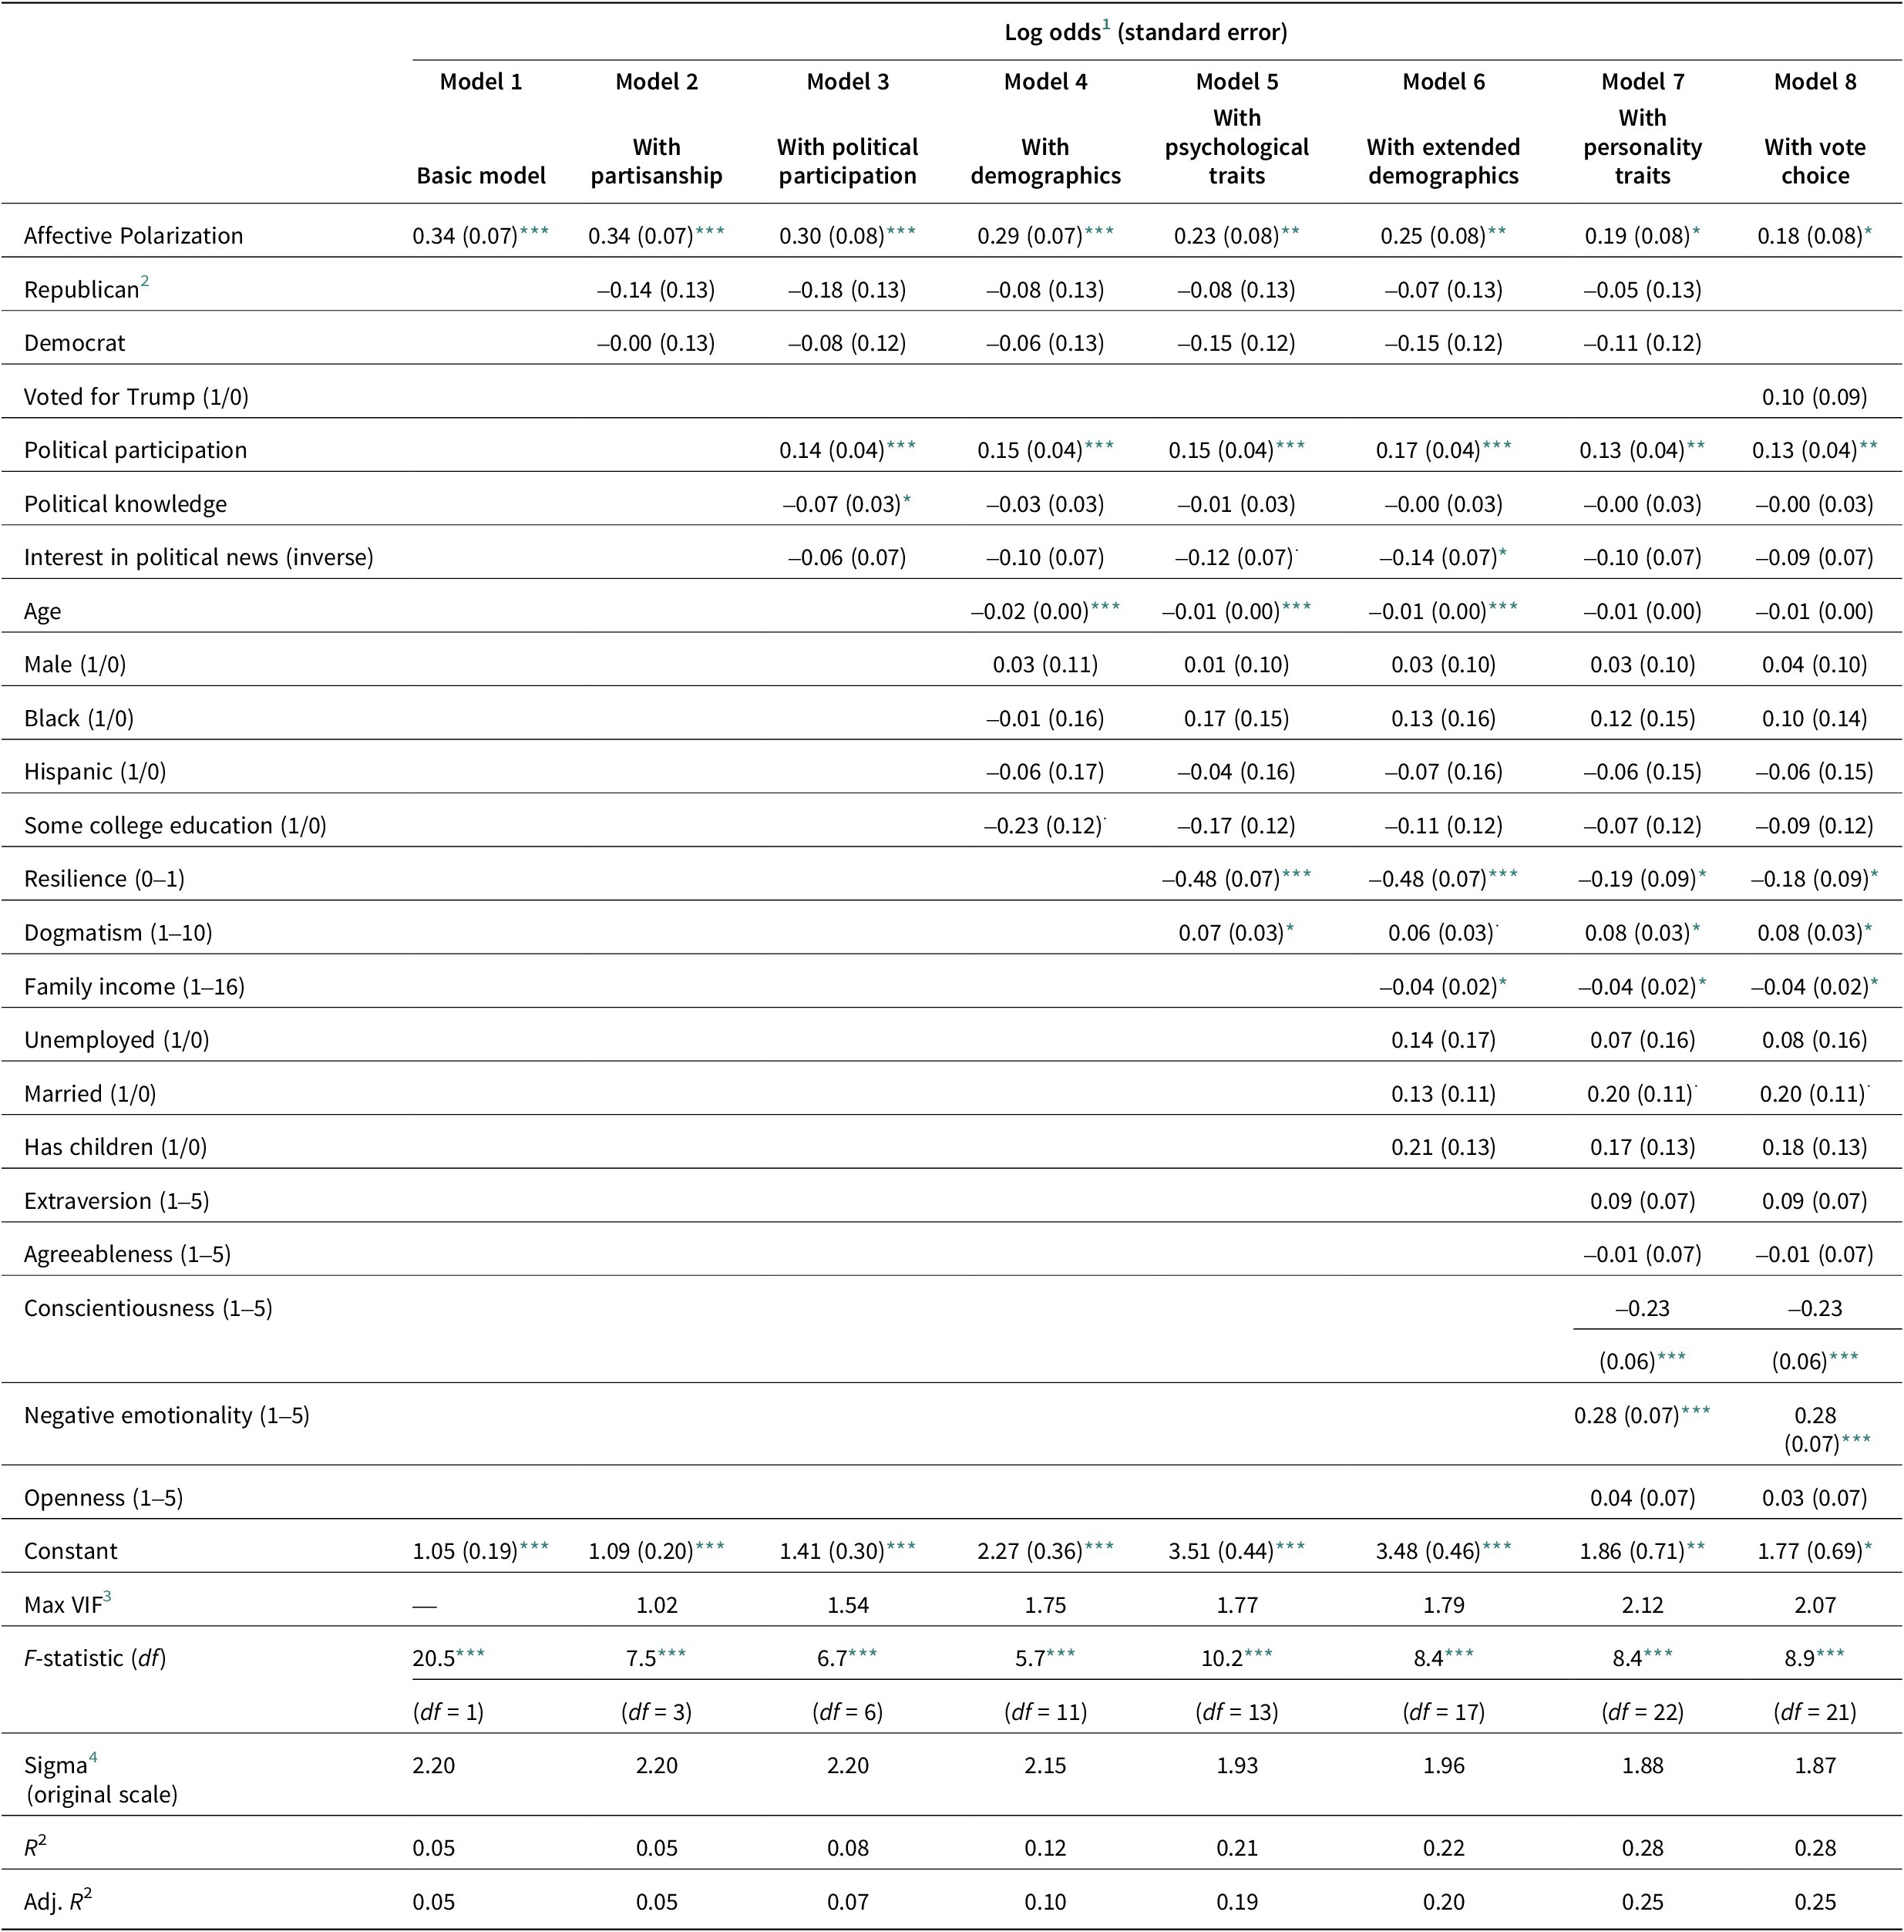
Note: Dependent variable represents: logged election-related post-traumatic stress disorder (PTSD) scale score, from adapted PCL-5. Based on 573 Democrats, Republicans, and independents from a nationally representative survey with poststratification weights.
*** p < .001
** p < .01
* p < .05 . p < .1.
1 Log odds show the projected increase in logged election-related PTSD score, given a one-unit increase in predictor.
2 Baseline categories represent weighted modal respondent: a White (64%) woman (51%), with some or more college education (63%), who is married (55%), with no children (76%), not unemployed (91%), who is a Democrat (40%), who did not vote for Trump (58%).
3 Collinearity: Variance inflation factor (VIF) scores measure level of multicollinearity among predictors. Models demonstrate no problematic collinearity; VIF scores are all below 10, the threshold for problematic collinearity, and close to 2.5, the gold standard. First model has just one covariate, so it can receive no VIF score.
4 Sigma represents residual standard error, showing how much PTSD scores vary from the observed score on average. Back-transformed to be applicable to original PTSD scale, from 0 to 80.
Multiple imputation: 10 imputed data sets used to fill in missing data points.
Explaining election-related PTSD during the 2020 U.S. presidential election
In Model 1, Table 2, we find a strong, positive, and statistically significant association between affective polarization and logged PTSD levels with no controls added (log odds = 0.34, p < .001). When simulated in the corresponding panel of Figure 1, our models project that an average respondent with extremely negative partisan views toward the opposing party (5) experiences a median expected score of +14.4 on the PCL-5’s 80-point scale of post-traumatic stress, compared to a median expected score of 3.0 given very little negative partisanship toward the opposing party (1). This constitutes a considerable 11.3-point expected increase in PTSD level (p < 0.001), multiplying that respondent’s levels of election-related post-traumatic stress by a factor of 3.8.
Do these findings persist when controlling for political variables? In Model 2, Table 2, which accounts for the impact of respondents’ partisan affiliations, we find that the close association between affective polarization and election-related PTSD (log odds = 0.34, p < .001) persists. The estimates show minor, statistically insignificant, negative associations with being a Republican (log odds = –0.14) and a Democrat (log odds > –0.01) compared to being independent; as discussed earlier, partisan differences between Democrats and Republicans are not statistically significant at conventional levels in this or any of our other models. When simulated, Model 2 projects an +11.9 point increase (from 3.1 to 15) on the PTSD scale (p < 0.001) as the average respondent’s level of affective polarization rises from 1 to 5.
Indeed, the main findings persist after controlling for political participation (log odds = 0.14, p < .001), political knowledge (log odds = –0.07, p < .05), and political interest levels (log odds = –0.06, p > .10) in Model 3, Table 2. In fact, the association between affective polarization and PTSD symptoms remains largely unchanged (log odds = 0.30, p < 0.001). Political participation exerts a significant association with greater PTSD levels (log odds = 0.14, p < .001) that is consistent across subsequent models (log odds = 0.13 ~ 0.17, p < .001), slightly dampening affective polarization’s log odds of an increase in PTSD from 0.34 in Model 2 to 0.30 in Model 3. Similarly, our simulations’ median expected increase in Figure 1 remains positive and significant, at +10.7 points (p < .001).
In Model 4, we added controls for basic demographics to potentially improve the precision of our estimates of the impact of affective polarization and find its effects remain robust: positive and highly statistically significant (log odds = 0.29, p < .001). The results also show that age was significantly (negatively) associated with election-related PTSD, indicating that younger voters were impacted more so than older voters (log odds = –0.02, p < .001) in terms of reporting election-related PTSD outcomes, while the associations of race and gender appear to be inconsequential. The estimates yielded by Model 4 also imply lower levels of election-related PTSD for college-educated voters (log odds = –0.23, p < .10), but this was not statistically significant at below the p < .10 threshold in subsequent estimations. When simulated in Figure 1, the median expected increase remains positive and significant for a respondent with high (5) versus low (1) levels of negativity toward opposing partisans, constituting a +9 point increase (p < .001) from 3.1 to 12.2 points on the election-related PTSD scale.
Associations consistent with psychological, demographic, and personality controls
Next, Model 5 (Table 2) tested whether the association with affective polarization remained robust (it did, log odds = 0.23, p < .01) even after accounting for respondents’ level of psychological resilience to crisis (log odds = –0.48, p < .001) and propensity toward dogmatic thinking (log odds = 0.07, p < .05). Indeed, both controls were closely linked to election-related PTSD levels, where those with more psychological resilience and lower levels of dogmatism consistently were significantly linked to lower election-related PTSD levels in this and subsequent models. Simulations in Figure 1 reveal that an increase in affective polarization levels from 1 to 5 is linked to a median expected increase of +6.8 points on the PTSD scale (p < .001), somewhat refined from our original estimate in Model 1 of +11.3, but still quite large.
In Model 6, we confirmed that greater affective polarization remains linked to election-related PTSD symptoms (log odds = 0.25, p < .01), even after incorporating extended demographic controls to refine our estimates, revealing negative associations with income (log odds = 0.04, p < .05, consistent in later models), and positive associations with marital status (log odds = 0.13, p > .10, although p < .10 in later models). Unemployment (log odds = 0.14) and having children (log odds = 0.21) were linked to higher levels of election-related PTSD, but these associations were not statistically significant at conventional levels, with p-values far above .10. Our simulations of Model 6 in Figure 1 boosted the median expected increase in PTSD levels back to +9.7 points, given an increase in affective polarization from low (1) to high (5).
Next we incorporated measures of “Big Five” personality types in Model 7, Table 2. An F-test of joint significance reveals that adding all five covariates as a whole to the model does produce a statistically significant improvement in the variation explained by our model (6.88, p < .001, df = 5). Greater conscientiousness was linked to lower election-related PTSD scores (beta = –0.23, p < .001), while greater negative emotionality was linked to higher election-related PTSD scores (beta = 0.28, p < .001). Openness (log odds = 0.04) and extraversion (log odds = 0.09) were linked to slightly higher scores, and agreeableness to lower scores (log odds = –0.01), but none of these were statistically significant at conventional levels, each showing p-values greater than .10.
After adjusting for personality, the relationship affective polarization on election-related PTSD levels remains consistent and robust, producing a positive association with a log odds of 0.19 (p < .05). When simulated in Figure 1, this translated into a median expected increase in election-related PTSD levels of 7.4 points (p < .001) for an otherwise average respondent with extremely negative views toward opposing partisans (5), expected to see a score of 12.7 points, compared to one with little negativity toward opposing partisans (1), who is expected to receive just 5.2 points out of 80 on the PCL-5 scale of election-related post-traumatic stress. This translates into an increase in PTSD levels by a factor of 2.4. This is somewhat less than Model 1’s estimate of a median expected increase by a factor of 3.8 but remains considerably higher than we would hope.
Relying on our fully specified model (Table 2, Model 7), we conclude that certain characteristics seem to be statistically related to election-related PTSD reports. Specifically, respondents reporting higher levels of electoral PTSD tend to be married (log odds = 0.20, p < .10), have a lower family income (log odds = –0.04, p < .05), and are more politically active (log odds = 0.13, p < .05). However, political knowledge and interest in political news were not significantly associated with PTSD in Model 7, implying that political participation, rather than political knowledge or interest, is more related to the processes that bringing individuals in contact with trauma. Neither party, gender, race, ethnicity, employment status, nor having children was significantly (p < .10) associated with election-related PTSD reports in our sample. Based on this model, age is not significantly associated with election-related PTSD reports either, although we note age exerts a statistically significant (negative) effect in each of the other models we estimated, implying a mixed picture about the relationship age and election-related PTSD reports, once other factors are taken into account.
Finally, as a robustness test, in Model 8, we substituted our three-category control for partisanship with respondents’ actual chosen candidate in the 2020 election as an alternative. Trump voters tended to report somewhat higher levels of PTSD (log odds = 0.04), but the association was not significant, much like our previous controls for partisanship. Additionally, affective polarization remains a statistically significant, positive correlate of post-electoral PTSD levels (log odds = 0.19, p < .05), implying that respondents’ negative feelings toward the opposing party likely correlate better with post-electoral PTSD levels than whether they voted for the candidate who lost the election (or, as seen in Models 1–7, than their identification with the party that won or lost the election).
Additional robustness tests in Table A3 confirm that affective polarization’s effect remains considerably large even after controlling for religious affiliation, but after 27 statistical controls, the significance of the association wanes to p = .12. However, this is still fairly low, indicating at least 88% confidence from a two-tailed test. After controlling for religion, these models also largely retain similar associations between election-related PTSD and other political covariates; unless stated otherwise, such covariates remain insignificant with wide standard errors. For example, higher electoral PTSD levels remain positively associated with higher political participation (log-odds = 0.13, p < .01, consistently significant across models) and voting for Trump (log-odds = 0.10), but negatively associated with being Democrat (log-odds = –0.03), greater political knowledge (log-odds < –0.01), and interest in political news (log-odds = –0.09, p < .05, newly significant). Only the association with being Republican changed from negative in Model 7 to positive in Model 9 (log-odds = +0.07), but this association remains statistically insignificant below the p < .10 level, implying that the change is likely just noise. Given the consistency of coefficients for affective polarization and numerous other political covariates across successive statistical controls, we suspect that a larger sample in future post-election surveys will produce similar results.
Discussion
Among other things, this study demonstrates that many Americans experienced some election-related post-traumatic stress symptoms following the 2020 presidential election in the United States. Our findings suggest that levels of reported election-related PTSD were positively related to individuals’ affective polarization. This key finding remains robust even after controlling for respondents’ partisanship, political engagement, demographics, psychological factors, and personality traits.
Overall, we believe this study makes three main contributions to the burgeoning literature examining the relationships between politics, elections, and health.
Measuring electoral trauma
First, by adapting the main validated scale for screening for PTSID, we identified that a surprisingly large share of the U.S. adult population reports classic PTSD symptoms related to the 2020 election, at levels above the diagnostic cutoff of 30 points for significant PTSD symptoms. We estimate that 12.5% of Americans experienced symptoms consistent with a probable PTSD diagnosis related to the election. This is deeply concerning, considering that the standard prevalence rate of PTSD in any given year is about 3.5% (Kessler, Chiu et al., Reference Kessler, Chiu, Demler, Merikangas and Walters2005). While past studies have linked election outcomes to negative health outcomes like depression (Yan et al., Reference Yan, Hsia, Yeung and Sloan2021), anxiety (Nayak et al.,, Reference Nayak, Fraser, Panagopoulos, Aldrich and Kim2021), sleep issues (Nayak et al. Reference Nayak, Fraser, Panagopoulos, Aldrich and Kim2021), drinking (Musse & Schneider, Reference Musse and Schneider2023), smoking (Samson, Reference Samson2015), and stress (Smith, Reference Smith2022; Smith et al., Reference Smith, Hibbing and Hibbing2019), this is the first study to the authors’ knowledge to find measurable levels of post-traumatic stress potentially linked to an election.
Linking polarization to election-related post-traumatic stress
Second, our study explains how electoral PTSD is related to a wide range of individual-level factors. We find consistent evidence, for instance, after accounting for a wide range of controls, that individuals more negatively polarized against opposing partisans were much more likely to report election-related post-traumatic stress symptoms. As discussed earlier, the most strongly polarized respondents in our fully specified, most conservative Model 7 reported levels of election-related post-traumatic stress +7.4 points higher than the least polarized respondents, with a 95% confidence interval ranging from a +1.0 to +17.6 point increase, with the most common range (50% interval) spanning +5.0 to +10.3. This is a considerable, statistically significant difference (p < .001), constituting a nearly 10% increase on the 0–80 scale.
Further, the resilience of our results to controls for presidential vote choice have important implications by offering an alternative explanation why polarization may hinder health: our models suggest that rather than voters whose party lost the election only, voters of any party may report election-related PTSD symptoms if they feel sufficiently distant from, hostile toward, isolated from, or hurt by members of the opposing party. We know this due to the consistent positive association affective polarization and PTSD levels, which persisted independent of controls for presidential vote choice or voter’s partisan identification.Footnote 6 If this association persists in subsequent studies, then toning down partisan attacks during elections could be an important first step toward mitigating health impacts, considering that the health impacts of polarization do not end after elections but can continue long after. A wealth of recent studies suggest that indicators of affective polarization and isolation from our political peers were linked to worse health outcomes several years after the 2016 election (Fraser et al., Reference Fraser, Aldrich, Panagopoulos, Hummel and Kim2022; Nayak et al., Reference Nayak, Fraser, Panagopoulos, Aldrich and Kim2021; Panagopoulos et al., Reference Panagopoulos, Fraser, Aldrich, Kim and Hummel2021).
Benchmarking affective polarization
Our study also adds to recent studies measuring political polarization, applying Bankert’s (Reference Bankert2021) negative partisan identity scale to measure affective polarization. Past studies measured polarization through single, context-based questions like Almond and Verba’s (Reference Almond and Verba1960) question about marrying an opposing partisan, feeling thermometers about the respondent’s own party versus the opposing party (Iyengar et al., Reference Iyengar, Sood and Lelkes2012), and which party’s candidates the respondent would never vote for (Lauka et al., Reference Lauka, McCoy and Firat2018), as well more complex mechanisms like extensive implicit bias tests (Iyengar & Westwood, Reference Iyengar and Westwood2015) and survey experiments to simulate partisan discrimination on résumés (Iyengar & Westwood, Reference Iyengar and Westwood2015). In contrast, the negative partisan identity scale allowed us to capture many different aspects of affect toward opposing partisans through its eight questions, giving a fuller picture of affective polarization. Recent benchmarks indicate that 30% of 2020 voters were “‘negative”’ voters, referring to those who responded yes to the question “Would you say your vote is more a vote for Trump [Biden] or more a vote against Biden [Trump]?” (Garzia & da Silva, Reference Garzia and Ferreira da Silva2022). However, the breadth of indicators in the Bankert (Reference Bankert2021) scale gives a better portrait of negative affect toward outward partisans.
Limitations and future research
In addition to our discussion in the Methods section, we acknowledge several limitations in this study. First, our measures were observed shortly after the election (between November 16 and 30, 2020), but some individuals may not have started experiencing election-related post-traumatic stress symptoms until later; as discussed, patients often present to health care workers with physical symptoms before their PTSD symptoms are uncovered (Graves et al., Reference Graves, Freedy, Aigbogun, Lawson, Mellman and Alim2011).
Second, our data rely exclusively on self-reports of individuals’ levels of election-related post-traumatic stress, affective partisanship, and other concepts in our models. However, these self-reported variables can be quite accurate and reliable: this study’s election-related PTSD questions were drawn and lightly modified from the PCL-5, which is the first step for many patients when seeking treatment for trauma. The PCL-5 has been validated multiple times (Blevins et al., Reference Blevins, Weathers, Davis, Witte and Domino2015; Bovin et al., Reference Bovin, Marx, Weathers, Gallagher, Rodriguez, Schnurr and Keane2016; Weathers et al., Reference Weathers, Litz, Keane, Palmieri, Marx and Schurr2013; Wortmann et al., Reference Wortmann, Jordan, Weathers, Resick, Dondanville, Hall-Clark, Foa, Young-McCaughan, Yarvis, Hembree, Mintz, Peterson and Litz2016), and it is recommended by the U.S. Department of Veterans Affairs (National Center for PTSD, 2022a). Although further validation tests could help clarify the effectiveness of our modified PCL-5, we found that our modified index has high internal consistency matching that of the PCL-5. Our predictors, too, are validated measures, including the negative partisanship index (Bankert, Reference Bankert2021), personality traits (Soto et al., Reference Soto and John2017a, Reference Soto and John2017b), and resilience scale (Smith et al., Reference Smith, Dalen, Wiggins, Tooley, Christopher and Bernard2008).
Third, the 2020 election occurred at the height of the COVID-19 pandemic, which certainly impacted respondents’ lives. Partisan interactions may have decreased in some communities because of lockdowns and many residents working from home, but partisan sorting into neighborhoods of the same political background had been occurring for some time in the United States prior to the pandemic (Bishop, Reference Bishop2009). Alternatively, partisan interactions proliferated in person for frontline workers, for residents negotiating new social norms like masking in public spaces, and across virtual social networks reacting to dozens of fear-inducing events. Example events include militias protesting masks at statehouses in multiple cities, the plot to kidnap Michigan governor Gretchen Whitmer, armed militias appearing at some polling places, police violence during the George Floyd protests, and White House–endorsed conspiracy theories about “antifa,” among others. Further, we know from research on bullying, discrimination, and crises that experiencing an event in person is not always required to trigger post-traumatic stress (Muldoon et al., Reference Muldoon, Lowe, Jetten, Cruwys and Haslam2021). We suspect such forms of political interaction would be sufficient to induce election-related post-traumatic stress in some individuals.
Our study does not rule out the possibility of election-related PTSD in previous election cycles; our evidence can only speak to the 2020 cycle. Instead, our claim is more general: that elections could lead voters to experience trauma. Given such pronounced indications of election-related PTSD symptoms during a time with relatively lower in-person interaction, we suspect symptoms could have been even more pronounced with more in-person interaction.
Fourth, we anticipate that COVID-19 likely contributed to an increase in PTSD rates in 2020, potentially as a constant baseline effect for all individuals. However, we expect that the models’ resilience measure should compensate for much of that impact (Calegaro et al., Reference Calegaro, Canova Mosele, Lorenzi Negretto, Zatti and Machado Freitas2019; Lee et al., Reference Lee, Ahn, Jeong, Chae and Choi2014). Further, our election-specific question design in the adapted PCL-5 makes it unlikely that our findings about election-related PTSD are spurious or due to COVID-19 instead. Our anchoring text for this battery informed respondents that they would be reviewing “a list of problems that people sometimes have in response to a stressful election” (Table A1), rather than in response to the pandemic or some other traumatic event. Then, 11 out of those 20 questions directly reference the election; it seems unlikely that COVID-19 would cause respondents to report “repeated, disturbing dreams of the election” or “having strong physical reactions when something reminded you of the election”.
Moreover, our PCL-5 measures demonstrated extremely high internal validity, with a Cronbach’s alpha of 0.946, just shy of 1.0, which would indicate perfectly uniform responses across questions. Were these patterns due to COVID-19-related trauma instead of election-related trauma, respondents would have had to coincidentally and consistently report symptoms in response to election-specific prompts across the entire battery. We encourage future surveys to repeat these measures in subsequent election cycles to compare levels during versus after 2020.
Finally, we encourage future election studies to consider including an election-targeted version of the PCL-5, to help establish consistent tracking of election-related, post-traumatic stress, as well as measures of affective polarization. Our findings are especially relevant as Americans prepare for the 2024 presidential election, recognizing that respondents who reported high levels of PTSD may be about to experience additional traumatic elections, given the current course of U.S. politics. Past studies have highlighted that post-traumatic stress carries both short and long term challenges for individuals: in the short term, respondents may face severe anxiety, heart palpitations, memory gaps, frequent changes in mood, and find themselves unable to talk or think about things related to the source of their trauma (Greene et al., Reference Greene, Neria and Gross2016; Weathers et al., Reference Weathers, Litz, Keane, Palmieri, Marx and Schurr2013). In the long term, individuals with PTSD commonly face comorbidities like depression, anxiety, or sleep disorders, disabilities, and substance abuse challenges (Kessler et al., Reference Kessler, Sonnega, Bromet, Hughes and Nelson1995; Liebschutz et al., Reference Liebschutz, Saitz, Brower, Keane, Lloyd-Travaglini, Averbuch and Samet2007; McDevitt-Murphy et al., Reference McDevitt-Murphy, Williams, Bracken, Fields, Monahan and Murphy2010; Westphal et al., Reference Westphal, Olfson, Gameroff, Wickramaratne, Pilowsky, Neugebauer, Lantigue, Shea and Neria2011), requiring added support from individuals’ support network, communities, and public health systems. However, voting in a well-functioning democracy should not have to come with such costs.
This study demonstrated that elections could produce trauma resulting in PTSD. Future research could examine partisan asymmetries in developing post-electoral PTSD, depending, for example, on whether preferred candidates win or lose, and what kinds of interventions could help mitigate election-related trauma. We view the current study as an initial step in encouraging closer attention to the potential sources of trauma in elections and the long-lasting physical and mental health impacts of elections and politics more generally.
Data availability
All data and replication code for this study are available on the Harvard Dataverse at the following link: https://doi.org/10.7910/DVN/ROKUZ5. This study was not preregistered.
Competing interest
The authors have no conflicts of interest to report.
Ethics statement
This project was approved by the University of Nebraska–Lincoln Institutional Review Board (Project ID# 20601). All survey participants consented via an online statement.
Credit statement
T.F. – writing – original draft; formal analysis, methodology, visualization. C.P. – writing – original draft, methodology, supervision, conceptualization. K.S. writing – original draft, investigation, data curation, methodology, conceptualization.
Appendix
Table A1. 20-item PCL-5 questions, adapted for the 2020 election.
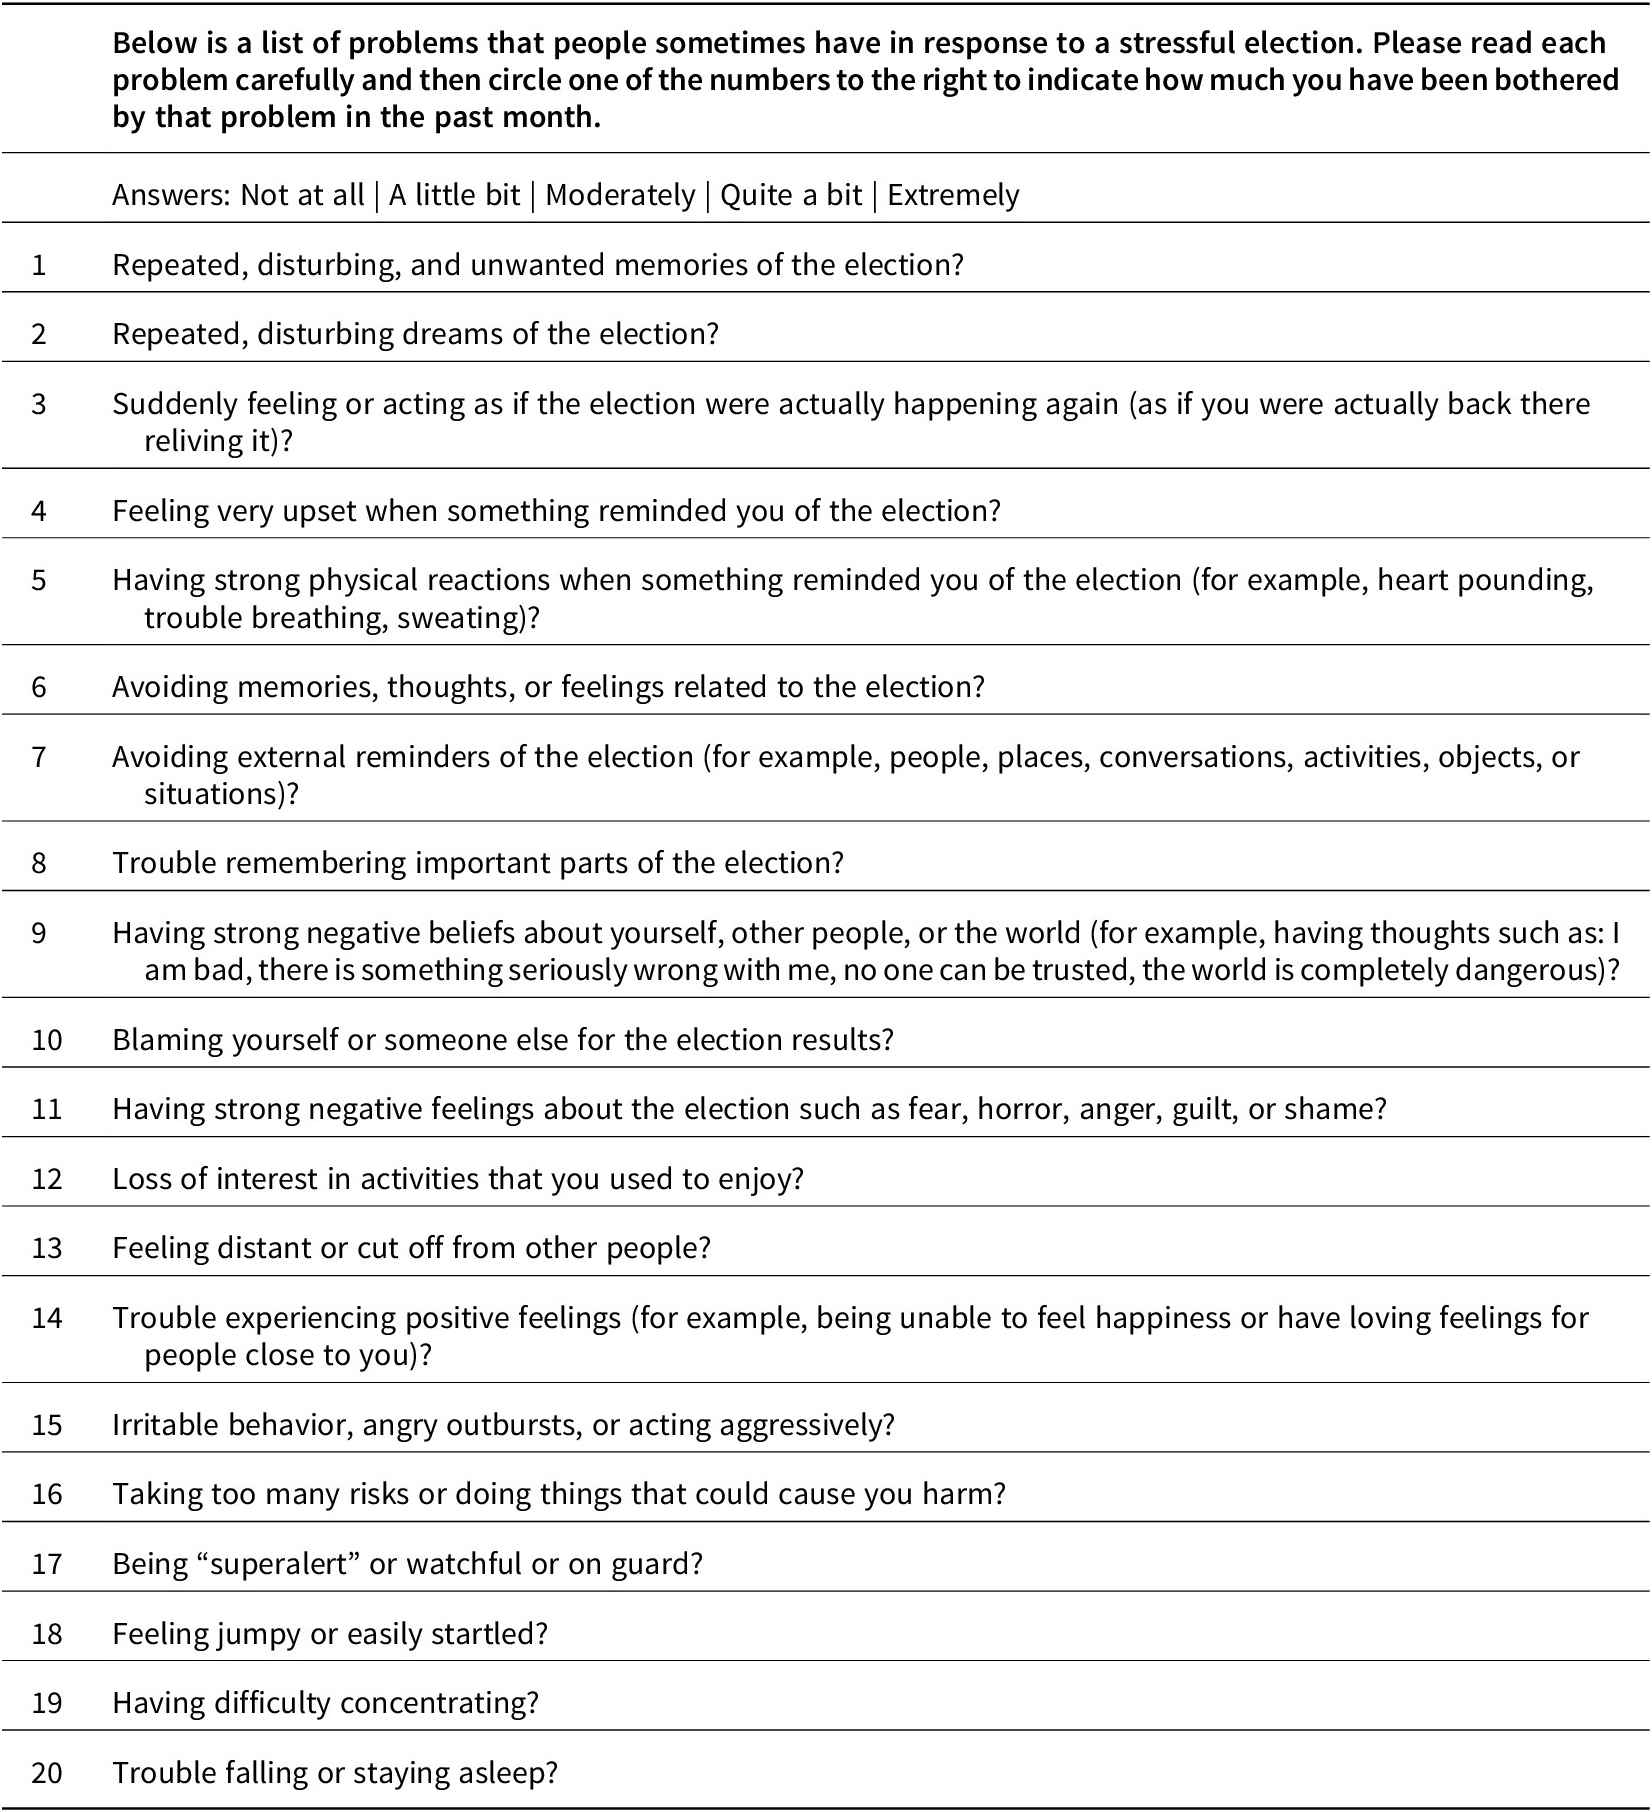
Table A2. Negative Partisan Identity Scale.

Table A3. Supplemental ordinary least squares models (religion controls).

Notes: Dependent variable represents logged election-related post-traumatic stress disorder (PTSD) scale score, from adapted PCL-5. Based on 573 Democrats, Republicans, and independents from a nationally representative survey with poststratification weights.
Multiple imputation: 10 imputed data sets used to fill in missing data points.
Table A4. Difference of proportions tests.

p1 = Annual prevalence of PTSD (percent) (circa Kessler, Chiu et al. Reference Kessler, Chiu, Demler, Merikangas and Walters2005).
P 2 = Percentage of respondents with election-related PTSD symptoms.
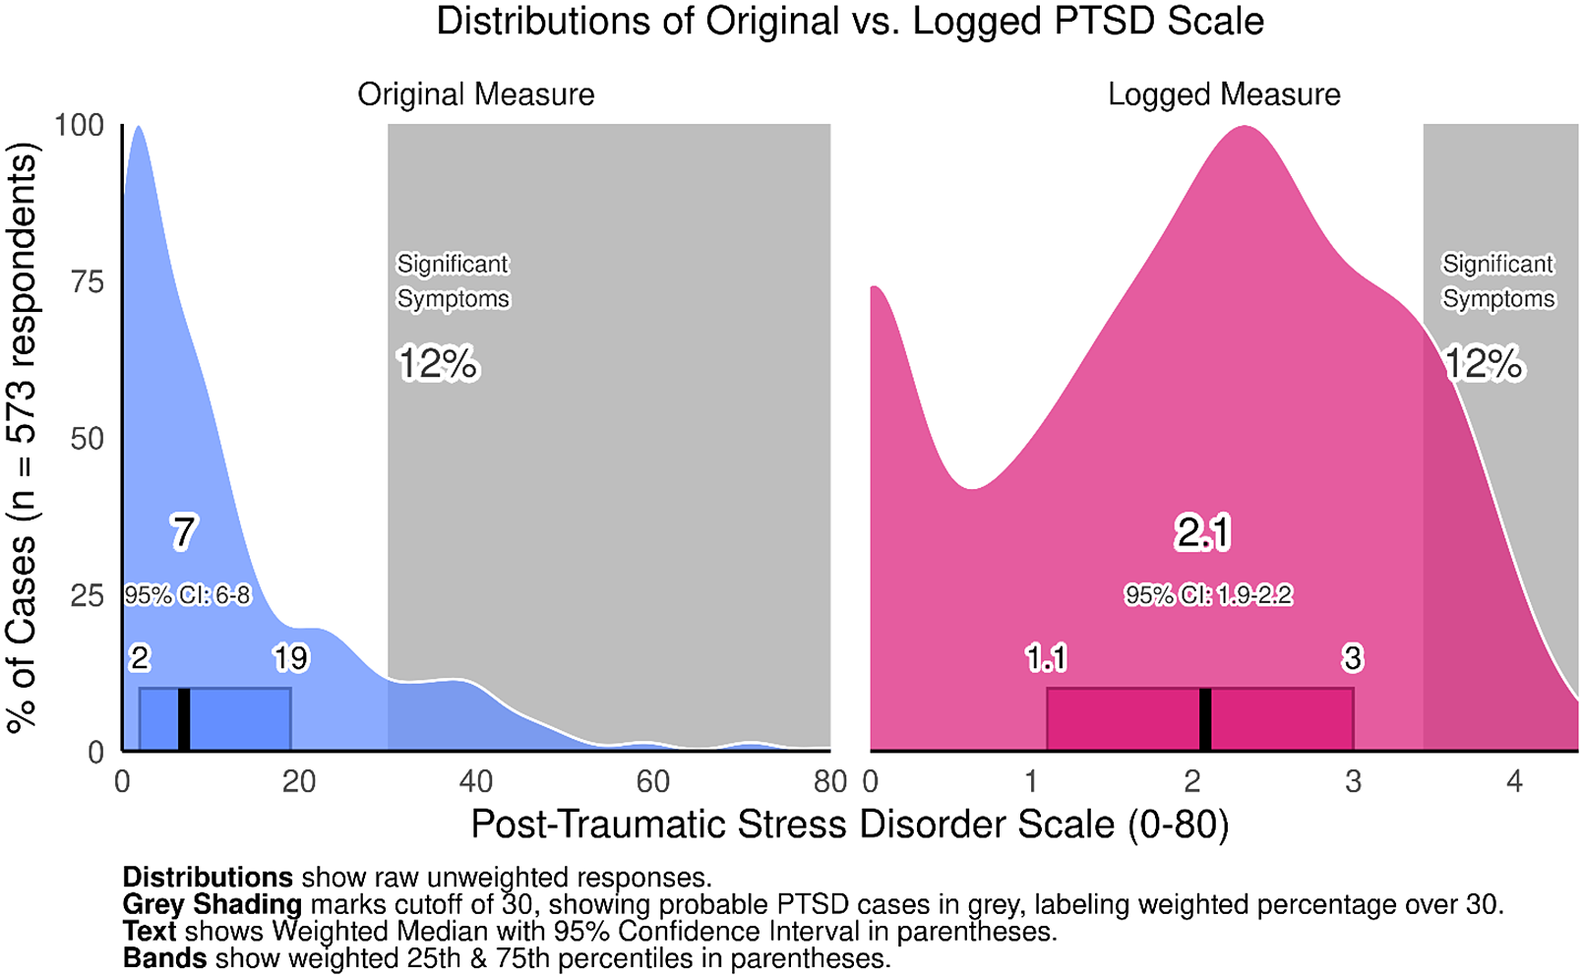
Figure A1. Distributions of original versus. logged election-related PTSD scale.


 Open access