


The global average for women's legislative representation reached a high of 25.5 percent as of April 2021 (Inter-Parliamentary Union, 2021). Although this average remains well below women's share of the world population, the variation in women's representation has increased significantly in recent years. A few countries have reached 50 percent women in the legislature, over 20 countries have surpassed 40 percent, and an additional 30 countries have at least 30 percent women in the legislature(Inter-Parliamentary Union, 2021). These unprecedented gains have important implications for research on the consequences of women's representation. In particular, although research finds that women's representation matters for outcomes related to women's substantive representation and beyond (Clayton and Zetterberg, Reference Clayton and Zetterberg2018; Koch and Fulton, Reference Koch and Fulton2011), scholars also theorize that women first need to reach a certain numeric threshold in the legislature before they will be able to effectively shape legislative outputs. This idea, known as critical mass theory, has been debated for decades (Dahlerup, Reference Dahlerup1988; Studlar and McAllister, Reference Studlar and McAllister2002; Bratton, Reference Bratton2005; Park, Reference Park2017). However, empirical studies have produced mixed evidence in support of critical mass, leading scholars to question whether the theory should be abandoned (Childs and Krook, Reference Childs and Krook2006).
The current moment provides a unique opportunity for the study of critical mass. Although previous research was limited by a lack of variation in women's representation, women's presence in legislatures is now becoming commonplace. Many countries’ legislatures now exceed 30 percent women, the threshold often theorized as the critical mass point. Taking advantage of this increase in spatio-temporal variation, we test for critical mass effects in the relationship between women's legislative representation and the allocation of government expenditures in two traditionally feminine policy areas, education and healthcare, and one traditionally masculine area, defense. This study is guided by three research questions: first, how important is women's representation for explaining government spending relative to other predictors? Second, is the functional form of the relationship nonlinear, as suggested by critical mass theory? Third, does this relationship vary across contexts?
We utilize recent developments in supervised tree-based machine learning techniques (Montgomery and Olivella, Reference Montgomery and Olivella2018) to address these research questions. Although tree-based approaches traditionally have been used to make predictions, we join a growing literature that uses machine learning to identify important predictors and potential nonlinear relationships that may or may not have been previously hypothesized in the literature (e.g., Montgomery et al., Reference Montgomery, Olivella, Potter and Crisp2015; Muchlinski et al., Reference Muchlinski, Siroky, He and Kocher2016; Bonica, Reference Bonica2018). Importantly, our inductive, data-driven approach provides guidance for future research on the consequences of women's representation, including its predictive power in explaining government spending, where potential breakpoints might exist in the data, and what functional form these relationships might take across various contexts. Moreover, the results of our exploratory random forests models can also inform future research using standard parametric approaches for hypothesis testing, as we show below.
Our findings suggest that women's legislative representation is among the most important predictors of education, healthcare, and defense spending. Moreover, the relationship between women's representation and spending in all three areas is nonlinear, lending support to critical mass theory. Education and healthcare spending increases sharply after women's representation in the legislature surpasses 20 and 15 percent, respectively, and then flattens after women's representation reaches approximately 41 percent for education spending and 35 percent for healthcare spending. Thus, there appears to be a critical mass interval rather than one critical mass point for both education and healthcare spending. In contrast, spending on defense decreases somewhat linearly as women's presence increases until women reach approximately 30 percent of the legislature. After this point, defense spending is largely unaffected by changes in women's representation. Here, there appears to be a critical limit in the effect of women's representation.
These findings point to evidence of critical mass effects in the relationships between women's representation and the allocation of government spending. However, we also find that the critical mass thresholds vary across outcomes, are modest in size, and may be conditional on other factors, such as the passage of time and level of democracy, which may explain why previous findings have been inconsistent. We conclude by offering guidance for future research based on the nonlinearities and breakpoints identified through our inductive, machine learning approach.
1. Women's representation and government spending
There is growing evidence that increasing women's legislative representation influences the allocation of government expenditures, leading to greater spending in areas that concern women. Studies of women's representation in national legislatures find that increasing the number of women legislators is associated with increased spending on traditionally feminine issues (i.e., care and compassion issues) relative to traditionally masculine ones. For example, greater representation increases spending on issues that have mattered to women historically, such as social welfare, healthcare, and family benefits (2018) (Bolzendahl Reference Bolzendahl2011; Chen Reference Chen2013; Park Reference Park2017; Clayton and Zetterberg, Reference Clayton and Zetterberg2018), and decreases spending on issues historically more important to men, including the military and defense (Koch and Fulton, Reference Koch and Fulton2011; Clayton and Zetterberg, Reference Clayton and Zetterberg2018).
These findings are echoed in studies of subnational governments. In the USA, increasing women's representation in state legislatures leads to increased healthcare spending for the poor (Courtemanche and Green, Reference Courtemanche and Green2017). In India, greater investments in early education and healthcare occur when women from lower castes are represented (Clots-Figueras, Reference Clots-Figueras2011). In addition, cities with women mayors are more likely to invest in policy areas that disproportionately affect women, such as social welfare programs (Holman, Reference Holman2014) and childcare centers (Smith, Reference Smith2014; but see Ferreira and Gyourko, Reference Ferreira and Gyourko2014), water infrastructure (Chattopadhyay and Duflo, Reference Chattopadhyay and Duflo2004), and education, healthcare, and social assistance (Funk and Philips, Reference Funk and Philips2019). Women's presence on city councils has also been found to influence government spending (Bratton and Ray, Reference Bratton and Ray2002; Svaleryd, Reference Svaleryd2009; Chen, Reference Chen2013; Braendle and Colombier, Reference Braendle and Colombier2016; Funk and Philips, Reference Funk and Philips2019).
2. Representing women: the potential need for a critical mass
The relationship between women's legislative representation and the allocation of government spending is an example of how increasing women's numeric (i.e., descriptive) representation can lead to improvements in women's substantive representation (Schwindt-Bayer and Mishler, Reference Schwindt-Bayer and Mishler2005). Since women legislators share a common gender identity and similar life experiences with women in society, they are expected to be better representatives of women's substantive interests than men legislators. Indeed, interviews reveal women legislators frequently express an interest in representing women's policy interests (Dittmar et al., Reference Dittmar, Sanbonmatsu and Carroll2018). Moreover, women legislators’ expressed interests frequently translate into actions: they participate more when a women's issue is at stake (Pearson and Dancey, Reference Pearson and Dancey2011; Funk et al., Reference Funk, Morales and Taylor-Robinson2017) and propose and support legislation congruent with women's interests (Kittilson, Reference Kittilson2008; Volden et al., Reference Volden, Wiseman and Wittmer2018).
Scholars theorize that in order for the relationship between women's numeric and substantive representation to be fully realized, women must reach a certain threshold—or critical mass—in the legislature. Largely inspired by Kanter's (Reference Kanter1977) seminal study on gender balance in corporations, scholars have been intrigued with the idea of critical mass; in particular, whether women's share of the legislature needs to transition from skewed (85 percent men to 15 percent women) to tilted (65:35) or balanced (50:50) before women legislators can effectively influence legislative outcomes.
Many studies seek to identify a breakpoint in women's representation that explains shifts toward greater gender equality in political processes and outcomes. The conventional expectation is that there is no relationship (or only a weak relationship) between women's numeric and substantive representation below the critical mass point; however, beyond this point, the relationship is expected to become much stronger. The literature has identified several possible critical mass thresholds. The most commonly hypothesized threshold is 30 percent (Dahlerup, Reference Dahlerup1988). However, scholars theorize thresholds as low as 15–20 percent (Thomas, Reference Thomas1994; Beckwith and Cowell-Meyers, Reference Beckwith and Cowell-Meyers2007; Swiss et al., Reference Swiss, Fallon and Burgos2012), or as high as 40–50 percent (Kanter, Reference Kanter1977; Funk et al., Reference Funk, Morales and Taylor-Robinson2017).
Critical mass theory reached its peak of popularity in the late 1980s and early 1990s. Since then, scholars have grown increasingly skeptical of it, not only due to the lack of consistent empirical support, but also because of the theory's over-simplicity; that is, its failure to adequately account for the inner-workings of legislatures, the potential for backlash in response to women's increased presence, the cultures and contexts in which women legislators operate, and the divisions that exist among women (e.g., partisan, ideological, and identity-based) that might prevent them from coordinating or from representing women's substantive interests (Childs and Krook, Reference Childs and Krook2006; Grey, Reference Grey2006; Beckwith and Cowell-Meyers, Reference Beckwith and Cowell-Meyers2007; Krook, Reference Krook2015). These shortcomings have led to calls for studies on critical actors and critical acts in lieu of critical mass (Ayata and Tütüncü, Reference Ayata and Tütüncü2008; Childs and Krook, Reference Childs and Krook2009; Johnson and Josefsson, Reference Johnson and Josefsson2016).
Yet, the basic idea behind critical mass—that women legislators will be unable to effectively shape outcomes and represent the interests of women in the absence of sufficient numbers—remains intuitively appealing to both scholars and policymakers. Indeed, this logic is frequently used to advocate for the adoption of gender quotas (Childs and Krook, Reference Childs and Krook2009). Furthermore, several studies of women's representation do find evidence of critical mass effects (Bratton and Ray, Reference Bratton and Ray2002; Studlar and McAllister, Reference Studlar and McAllister2002; Schwindt-Bayer and Mishler, Reference Schwindt-Bayer and Mishler2005; Swiss et al., Reference Swiss, Fallon and Burgos2012; Barnes and Burchard, Reference Barnes and Burchard2013). There is also evidence of critical mass effects in sectors beyond politics, including business (Joecks et al., Reference Joecks, Pull and Vetter2013) and the media (Correa and Harp, Reference Correa and Harp2011), as well as experimental evidence that gender composition matters in conjunction with institutional rules and procedures (Karpowitz et al., Reference Karpowitz, Mendelberg and Mattioli2015).
3. A machine learning approach to critical mass theory
Recent skepticism of critical mass theory may be justified given the lack of consistent evidence produced by previous studies. There are, however, two reasons to give pause. First, inconsistent evidence of a critical mass effect might be explained by insufficient methodological tools that can identify potential breakpoints or nonlinearities in the relationships between women's numeric representation and outcomes of interest. After all, testing for nonlinear effects using standard linear models is challenging since it requires closely approximating the underlying functional form parametrically. Second, historically low variation in levels of women's legislative representation may also explain the paucity of evidence for critical mass in national-level studies.
Although our study is unable to parse out the exact causal mechanisms by which critical mass might occur (but see Karpowitz et al., Reference Karpowitz, Mendelberg and Mattioli2015), below we use tree-based machine learning techniques to uncover underlying relationships—and possible nonlinearities in these relationships—between women's numeric representation and government spending. Machine learning techniques originated in computer science and statistics, where they are often used to maximize predictive ability in a set of out-of-sample data. In the social sciences, there is growing interest in using these techniques as a data-driven approach to study questions that standard parametric models cannot easily address (Montgomery et al., Reference Montgomery, Olivella, Potter and Crisp2015; Muchlinski et al., Reference Muchlinski, Siroky, He and Kocher2016; Bonica, Reference Bonica2018; Montgomery and Olivella, Reference Montgomery and Olivella2018).
3.1 Theoretical relationships between women's representation and government spending
We examine whether increases in women's representation are related to government spending in education, healthcare, and defense. Empirically, these outcomes offer the most data coverage across space and over time compared to other categories of spending. Theoretically, we expect greater spending on education and healthcare to be more reflective of women's substantive interests compared to spending on defense. Although each of these policy issues is relevant to all citizens, women tend to be disproportionately impacted by and concerned with social issues, such as education and healthcare, while the same is true for men for issues of security and defense (Diekman and Schneider, Reference Diekman and Schneider2010). Research on public opinion and voting behavior finds important differences in men and women's attitudes toward both social policy and foreign policy issues (Fite et al., Reference Fite, Genest and Wilcox1990; Diekman and Schneider, Reference Diekman and Schneider2010). These gender differences exist not only among the general public, but are also reflected in the preferences and behaviors of elected officials (Bolzendahl, Reference Bolzendahl2011; Koch and Fulton, Reference Koch and Fulton2011; Funk and Philips, Reference Funk and Philips2019).
Previous research offers different expectations about the relationship between levels of women's representation and government spending. Figure 1 summarizes these expectations by showing several possible functional forms. On the vertical axis, we plot spending on traditionally feminine policy issues, while the horizontal axis depicts women's share of the legislature. First, there may be no relationship (Figure 1a), as suggested by scholars urging for studies of critical actors and critical acts (Bratton, Reference Bratton2005; Childs and Krook, Reference Childs and Krook2009). There could also be a linear relationship (Figure 1b), which is the most common form specified in empirical research (Kittilson, Reference Kittilson2008; Koch and Fulton, Reference Koch and Fulton2011). However, critical mass theory suggests women's representation will have no effect (Figure 1c), or only a small effect (Figure 1d), until a certain threshold is reached (Kanter, Reference Kanter1977; Dahlerup, Reference Dahlerup1988). The relationship could also take on a more complex form than previously theorized, such as one with two breakpoints (Figure 1e). We suggest this relationship could be reflective of a critical mass interval, wherein the effect of women's representation is only significant between the two breakpoints. Another possibility is that women's representation may have no effect beyond a certain threshold or critical limit point, perhaps indicative of a glass ceiling or diminishing effect (Figure 1f).

Fig. 1. Hypothesized effects of women's numeric representation on government expenditures. (a) No relationship. (b) Linear relationship. (c) No effect before critical mass point. (d) Small effect before critical mass point. (e) Critical mass interval. (f) Critical limit point.
4. Data and variables
We construct a dataset from several sources, including the Quota Adoption and Reform Over Time (QAROT) dataset (Hughes et al., Reference Hughes, Paxton, Clayton and Zetterberg2019), the World Bank's World Development Indicators (WDI), and Polity IV. The final dataset includes 149 countries from 2000 to 2016, allowing for extensive variation in women's legislative representation and other factors that might influence government spending. The inclusion of such cross-national and temporal variation also increases the generalizability of our findings.
We use expenditure data from the WDI dataset to measure government spending on education, healthcare, and defense, with each expenditure category expressed as a percentage of gross domestic product (GDP). We use data from the Inter-Parliamentary Union (IPU) to measure women's seat share in the lower or unicameral chamber of national parliaments.Footnote 1 Figure 2 shows the distribution of women's legislative representation across the countries and years included in the data. Women's presence in national legislatures has steadily increased since the 1990s, resulting in notable variation across countries and over time. For instance, in 2006, the between-country variance in women's representation was 107.79. By 2016, the variance had increased to 146.60. In the data overall, the percent women legislators ranges from 0 to 63.8 percent, with a mean of 17.47 percent.
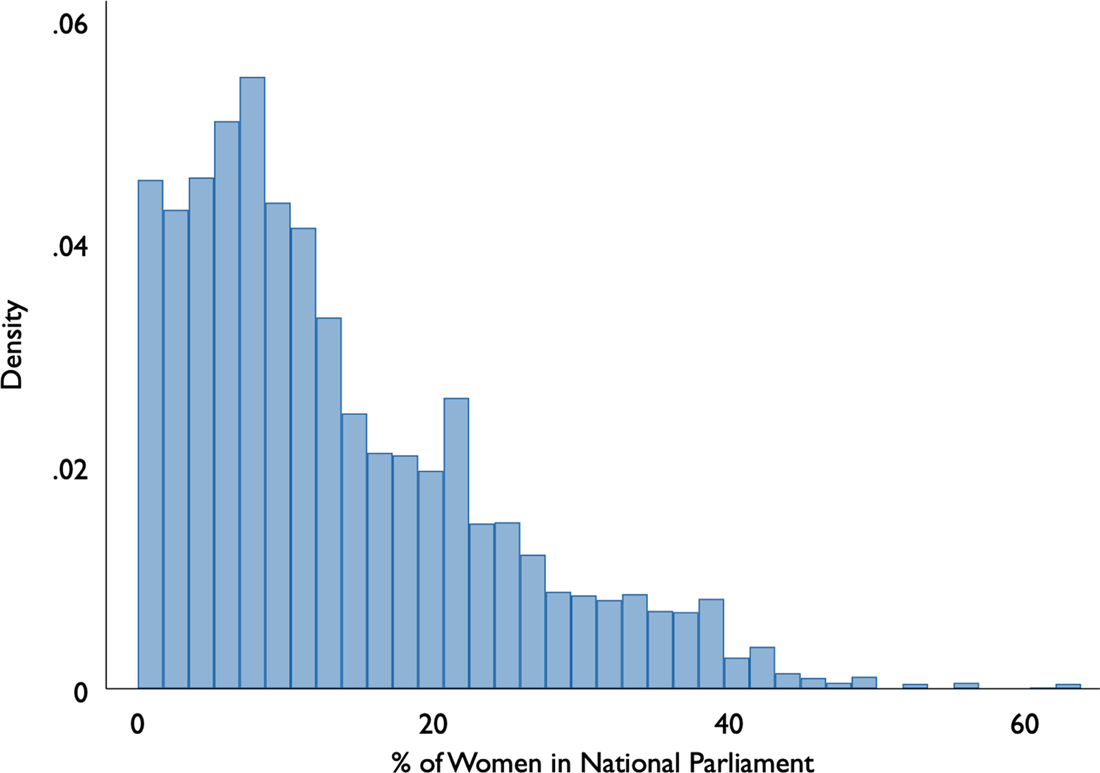
Fig. 2. Histogram of percent women in the lower or unicameral chamber.
4.1 Control variables
We control for several variables that might also influence how governments allocate spending. Compared to standard regression approaches, tree-based models are at a much lower risk of overfitting the data through the inclusion of too many variables (Montgomery and Olivella, Reference Montgomery and Olivella2018). Thus, we opt to include many plausibly-related variables. For instance, countries that prioritize women's representation through gender quotas may also allocate a larger share of expenditures to sectors that disproportionately affect women compared to countries that lack quota laws. We control for the presence of legislative gender quotas using several measures. First, we include a dummy variable for quota implementation that is coded “1” for the election year in which a quota is implemented and all subsequent years, regardless of quota enforcement or compliance (Hughes et al., Reference Hughes, Paxton, Clayton and Zetterberg2019). Second, we include a de facto threshold measure, which is the product of the minimum threshold stipulated by the quota law and the percentage of legislative seats to which the quota applies (Hughes et al., Reference Hughes, Paxton, Clayton and Zetterberg2019). Third, we replicate Clayton and Zetterberg's (Reference Clayton and Zetterberg2018) quota shock variable, which equals zero in all country-years that lack quotas and equals the percentage point change in women's representation induced by the quota for the year of implementation and all subsequent years.
We construct two measures from the QAROT dataset to capture the strength of quota laws. The first is an index ranging from 0 to 4, where 0 indicates the absence of a quota. Each country then receives one point for the year of quota implementation and each subsequent year, as well as one additional point for each of the following: a minimum threshold of 40 percent or higher, the existence of sanctions for quota noncompliance, and the inclusion of placement mandates (Funk et al., Reference Funk, Hinojosa and Piscopo2017). The second measure includes the same components as the first quota strength measure, except for the 40 percent threshold, and also accounts for the respective strength of the sanctions or placement mandates (if present) as well as the presence of legislated mechanisms for filling seats in the case of reserved seat systems.
We use the WDI data to control for variables that shape demand for government spending, including the age dependency ratio; spending on agriculture, forestry, and fishing as a percent of GDP; crude birth rate; employment to population ratio; fertility rate; foreign direct investment; constant GDP; annual GDP growth; GDP per capita; import of goods and services as a percent of GDP; inflation; female and male labor force participation rates; female share of the total labor force; female and male life expectancies at birth; lifetime risk of maternal death; maternal mortality rate; annual population growth; population density; total population; female share of the total population; prevalence of anemia among non-pregnant women; percent rural population; primary school enrollment rate; trade as a percent of GDP; and the total and male unemployment rates. We control for level of democracy using Polity IV, which ranges from −10 (autocracy) to +10 (democracy). Finally, we control for time effects using a continuous variable for year.Footnote 2
5. Methodological approach: supervised machine learning
To test the importance of women's representation for determining the allocation of government spending, and explore the possibility of nonlinear effects, we turn to tree-based machine learning techniques. Random forests are an ensemble approach which can be used for predicting continuous outcomes, given a set of predictors. The approach underlying all tree-based models can be summarized as follows (Montgomery and Olivella, Reference Montgomery and Olivella2018): first, a cut-point is selected along one of the predictors that partitions the data-space into two regions, R 1 and R 2, where a single prediction is made in each region. The “best” predictor for this partition is the one that minimizes the sum of the squared error between the predicted and actual values. This results in the first “node,” or split. Next, the best split to partition R 1 into two regions is identified, and another split is identified to partition R 2 into two regions. Then, these four regions are partitioned, and so on. The process continually grows the regression tree by node splits until a stopping criterion is reached (e.g., when only five observations are left in each branch). When no more splits are possible for a given branch, the branch has reached its terminal node. The regression tree can then be fed with new data and used to make predictions.
Extensions to this approach have several advantages over those that rely on a single regression tree (Hastie et al., Reference Hastie, Tibshirani and Friedman2009). First, a single tree tends to overfit the sample, leading to poor performance out of sample. Our approach, by bootstrap sampling the data many times, growing a tree on each of these bootstrapped samples, and averaging the predictions over these trees, tends to reduce out-of-sample prediction variance while still remaining unbiased. This process is known as bootstrap aggregating, or “bagging.” Random forests, which we use below, extend bagging by forcibly de-correlating trees from one another by making the algorithm choose from a random subset of predictors at each node. Again, the intuition is that by averaging over many trees, the average prediction of these (now less correlated) trees should be highly accurate.
Following Hastie et al. (Reference Hastie, Tibshirani and Friedman2009), our prediction function is:
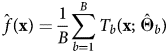
where x is our set of c predictor variables, B is the total number of grown trees (also the number of bootstrap samples), and $\hat {\Theta }_b$ is the set of parameter estimates that comprises each tree T b. In addition to the split variables used for a given tree (recall these were chosen to minimize the sum of the squared error in a given bootstrapped sample), the parameters in $\hat {\Theta }_b$
 also include the node cut-points, the random subset of m < c variables that are forced at each node, and the values and minimum size of the terminal nodes. We used cross-validation to set some of these hyperparameters across the B = 300 trees, including m = 14 subset variables at each node, and terminal node sizes of one.Footnote 3
One disadvantage of ensemble-type models such as random forests is that they can be difficult to present and interpret, as presenting the entire set of results would involve examining 300 trees for each dependent variable. Because of this, researchers frequently report a series of plots that summarize various aspects of the random forests. We opt to take this approach given our inductive emphasis, as opposed to statistical hypothesis testing; however, we do perform the latter in the penultimate section.
6. Women's representation matters for government spending
We first use our approach to determine whether women's representation is important for predicting government expenditures relative to alternative factors. For each spending outcome, we use measures of variable importance to determine whether women's numeric representation matters for predicting the level of government expenditures. Since the data are bootstrapped, out-of-bag prediction rates (i.e., rates of how well the model predicts data not randomly sampled for inclusion in the model) are estimated. The most common type of variable importance measure uses out-of-bag observations to construct a measure of the difference between the average prediction error for each tree and the prediction error produced when each of the predictor variables have been randomly permuted. Then, this is averaged over all the trees and scaled by the standard deviation of these differences. Thus, larger-scaled average differences indicate that a predictor does a better job in reducing prediction error than its randomly permuted counterpart, and this variable can be considered an important predictor.
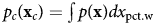
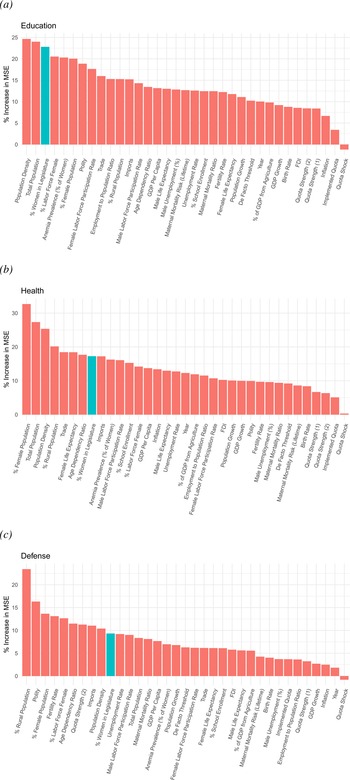
Figure 3 presents variable importance plots for education, healthcare, and defense spending. The percent women legislators is the third most important variable (of 35 total) for explaining education expenditures, as shown in Figure 3(a). Figure 3(b) shows that women's legislative representation is the eighth most important variable for predicting spending on healthcare. For defense spending, shown in Figure 3(c), women's representation is the tenth most important predictor. In sum, these results suggest that women's representation is important for explaining spending in all three areas.

Fig. 3. Variable importance plots. (a) Education. (b) Health. (c) Defense.
7. The effect of women's numeric representation is nonlinear
Unlike parametric approaches, random forests are completely nonparametric, allowing us to detect potential nonlinear effects of women's representation without having to specify an assumed functional form. This is ideal for our purposes, since the underlying relationship between expenditures and women's representation remains unknown and disputed in the literature. Unfortunately, because of this flexibility, random forests do not lend themselves to straightforward interpretation of effects as in parametric models.
One way around this is to use partial dependence plots, PDPs (Friedman, Reference Friedman2001; Greenwell, Reference Greenwell2017). We are interested in x pct.w, women's legislative representation. Given our set of all other c predictors (i.e., all but women's representation), xc = {x 1, x 2, …, x c}, and prediction function ${\hskip2pt \hat {\hskip-2pt f}} ( {\bf x})$ , where x ∈ {x pct.w, xc}, we can write the partial dependence function as:

where p c(xc) is the marginal probability density of xc (Greenwell, Reference Greenwell2017).Footnote 4 This is estimated given the model as:
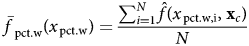
In other words, to create PDPs, we hold all control variables, xc, at their actual values for a given observation i, set x pct.w to a fixed quantity of interest for all i, run these pairs through the prediction function $\hat {f}( x_{\rm {pct.w}, \, i},\; \, {\bf x}_c)$ , and average over all N observations to obtain an expected value of the outcome $\bar {f}_{\rm {pct.w}}( x_{\rm {pct.w}})$
 , given the fixed value of x pct.w. We then set x pct.w to a different value, again keeping all control variables at their observed values, recalculate the new average prediction, and so on. In short, the PDP is a plot of the expected value of the outcome, $\bar {f}_{\rm {pct.w}}( x_{\rm {pct.w}})$
 , across the entire range of x pct.w, over the marginal distribution of all other predictors. PDPs are similar to the well-known observed-value approach in parametric contexts (Hanmer and Kalkan, Reference Hanmer and Kalkan2013).
We plot PDPs for each expenditure area in Figure 4. The percentage of women legislators is shown on the horizontal axis (in addition to a rug plot corresponding to the actual values in the sample), while the expected value of the expenditure variable is shown on the vertical axis. Thus, the solid line in the plot shows the expected value of the expenditure variable across levels of women's representation, averaged over the marginal distribution of all other observed predictor values for all other observations.

Fig. 4. PDPs of women's representation support critical mass.
The left plot in Figure 4 shows the expected values of education expenditures across levels of women's legislative representation. Education spending falls below 4.4 percent of GDP when women make up less than 20 percent of the legislature. But, the expected value for education spending jumps from 4.4 percent to almost 4.8 percent as women's representation approaches around 21 percent. Education expenditures then appear to be somewhat constant when women's representation is between 21 and 38 percent. Yet, expenditures again appear to increase—from just under 4.8 percent to over 5 percent of total expenditures—when women make up between 38 and 41 percent of the legislature. Finally, we observe another leveling-off effect at approximately 5.1 percent of GDP after representation surpasses about 41 percent.
To summarize, we observe a first spike of about 0.40 percentage points in education spending, and a second spike of about 0.20 percentage points. Although these effects may seem small, recall that these expected values represent the level of education expenditures across different values in women's representation after averaging over the effects of every other variable in the model, and they are expressed as a percentage of GDP. Given the low variation in government spending in the overall dataset, we interpret these effects to be substantively meaningful.Footnote 5 Furthermore, these findings could be interpreted as supporting critical mass theory; although, the findings are more indicative of a critical mass interval between 20 and 41 percent (or perhaps two intervals, 20–21 and 38–41 percent) rather than one critical mass point.
The center plot in Figure 4 shows expected values of healthcare spending across values of the percent women legislators. A nonlinear, but somewhat constant, effect occurs at just under 15 percent women legislators, followed by a steady 0.25 percentage point increase in healthcare spending until representation surpasses 30 percent. After this point, the effect of women's representation increases very minimally just past 40 percent women in legislature and then disappears. These findings again suggest the presence of a critical mass interval, between approximately 15 and 30 percent women, wherein the presence of women legislators produces a significant increase in the level of government spending on healthcare.
Finally, the right plot in Figure 4 shows that as women's representation increases, the level of defense spending tends to decrease, consistent with findings from prior research. As women's representation increases from 0 to 30 percent, we observe a 0.40 percentage point decrease in the expected value of defense spending. Yet, when women's representation reaches about 30 percent, defense spending flatlines at about 1.75 percent of GDP. Traditional critical mass theory suggests that women legislators will not be able to effectively shape policy outcomes until a certain threshold is reached. We see the opposite effect here; increases in women's representation predict decreases in defense spending until a certain critical limit point, around 30 percent, has been reached.
These findings suggest that women's representation has nonlinear effects on government spending, offering some support for critical mass theory. However, for government spending on education and healthcare, there appears to be a critical mass interval (or two intervals in the case of education) as opposed to a single critical mass point. Moreover, the results for defense spending appear to be opposite of what critical mass theory hypothesizes. Rather than a critical mass threshold, we observe what appears to be a point after which women's representation no longer influences defense spending, or a critical limit point. These findings do not clearly align with prior expectations offered by the literature. Rather, our machine learning approach produces a more nuanced picture of how women's representation affects government spending outcomes.
8. The effect of women's representation varies across contexts
Below, we examine whether the relationship between women's representation and government spending is conditional on a third variable. We present these conditional relationships using three-dimensional PDPs. The intuition is similar to that described above, but now we condition on both percent women and an additional variable (i.e., examining all possible pairwise combinations of the two) over the marginal distribution of all other variables. We examine whether the effect of women's representation on government spending varies across (1) level of democracy measured using Polity scores, (2) the passage of time measured in years, and/or (3) the implementation of a gender quota.
8.1 Level of democracy
Figure 5 shows PDPs across values of democracy and women's legislative representation for each of the three spending variables. Since machine learning approaches have difficulty extrapolating predictions beyond the data-space on which they were trained, and following the general advice of not extrapolating beyond the actual sample-space, we only show PDP predictions across the two variables that lie inside the predictor space that the model was trained on (Greenwell, Reference Greenwell2017). Shaded values indicate that the democracy-women's representation pair was actually present in the data, whereas white space indicates that the combination of values did not exist in the data.

Fig. 5. Conditional relationships between percent women legislators and democracy. (a) Education. (b) Health. (c) Defense.
Figure 5(a) suggests that the effect of women's representation on education spending may be conditional on a country's level of democracy. Although women's representation on its own still exerts a positive, nonlinear effect on education spending (as seen in Figure 4), increasing women's legislative representation has a smaller effect in countries with higher levels of democracy. For example, the effect of increasing women's representation (moving from left to right) when the Polity score is − 5 results in a larger increase in education expenditures compared to when the Polity score is 8 or higher. In other words, the positive effect of women's legislative representation on education spending appears to be greatest in less democratic countries. Likewise, we see the conditional effect when moving from lower to higher levels of democracy while holding women's representation constant. For example, a country with 20 percent representation is expected to have much lower levels of education spending if Polity is − 7 compared to 10.
In Figure 5(b), we also find evidence of a conditional effect between democracy and women's representation in predicting health spending. The shift from blue tones in the lower left quadrant to red tones in the upper right quadrant of the graph indicates that as women's representation increases and the level of democracy increases, spending on healthcare increases as well. We see the same patterns here as with education spending. The effect of women's representation on health spending varies across the level of democracy.
Figure 5(c) shows the effect of women's representation on defense spending across levels of democracy. The patterns presented in this graph diverge from those presented in Figures 5(a) and 5(b). Here, democracy appears to be a more important predictor of defense spending than women's representation. Across all levels of women's representation, defense spending is expected to be less than 2 percent of GDP when Polity is about 7.5 or higher (blue tones), around 2–3 percent of GDP when Polity is between about −7.5 and 7.5 (purple tones), and greater than 4 percent of GDP when Polity is −7.5 or less (red tones). These results suggest the effect of women's representation on defense spending is not conditioned by level of democracy, in contrast to the findings for education and health spending.
8.2 Passage of time
Figure 6 presents PDPs for the effect of women's representation across time for each dependent variable. Figure 6(a) shows that as the percentage of women in the legislature increases, the level of government spending on education also increases. This effect does not appear to be conditional on the passage of time. The figure shows three largely distinct blocks of spending (blue, pink, and red) that correspond to levels of women's representation, and also mirror the critical mass interval identified in the preceding section (see Figure 4).
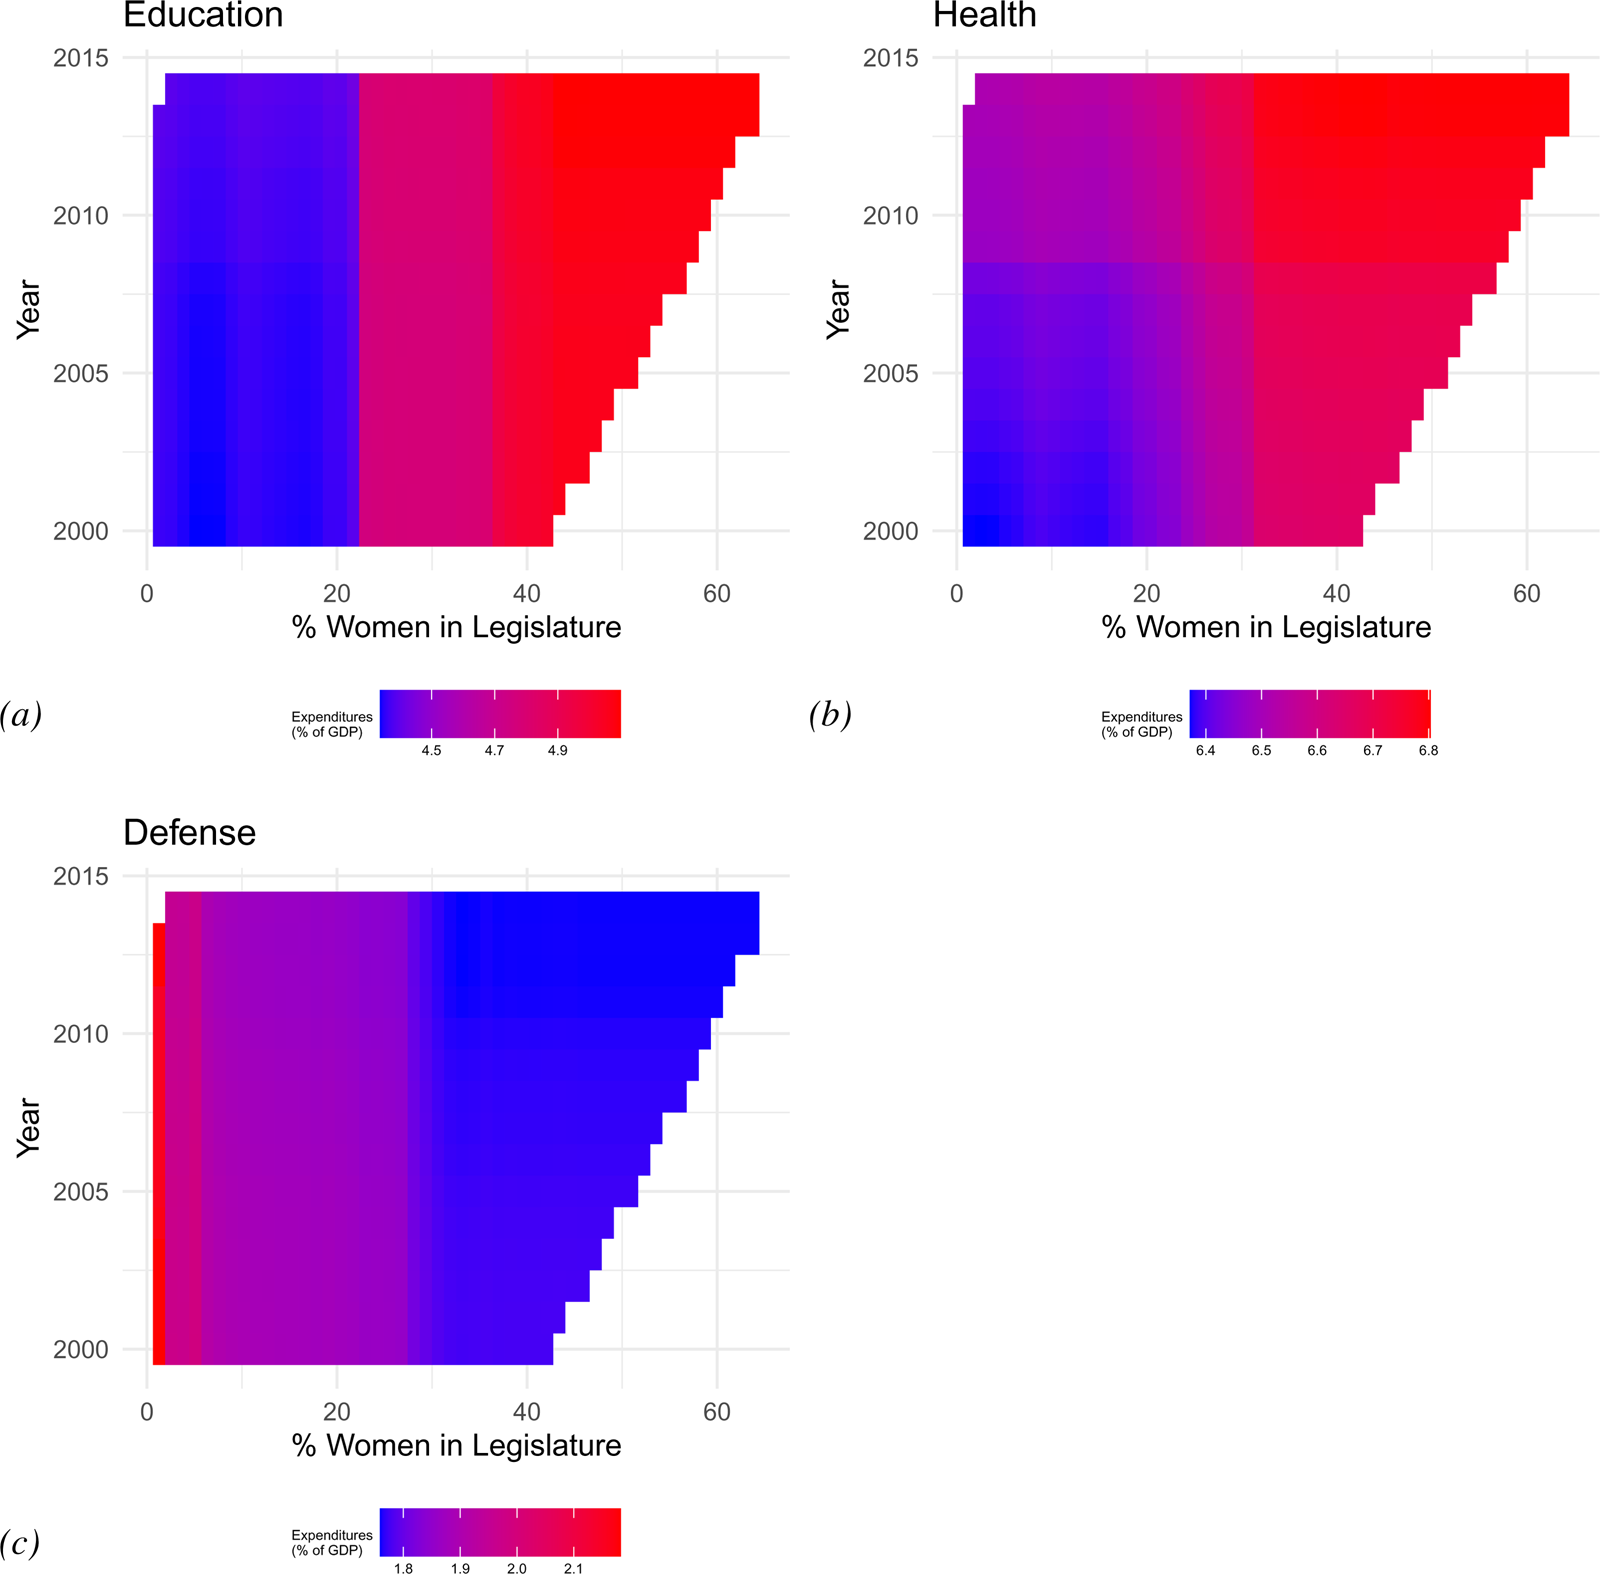
Fig. 6. Conditional relationships between percent women legislators and time. (a) Education. (b) Health. (c) Defense.
Figure 6(b) shows the conditional relationship between women's representation and time for health spending. The effects of women's legislative representation change across both levels of representation and also the passage of time. The pure blue tones in the bottom left quadrant gradually shift to pure red tones in the upper right quadrant of the graph. This color gradation indicates that health spending increases as both women's legislative representation increases and as more time passes. For example, when the legislature is 10 percent women, health spending is greater in the year 2012 compared to the year 2000. Yet, if we compare expected values across 2012, we also see greater spending in countries with higher percentages of women legislators (moving from left to right on the graph). These findings indicate that the highest levels of health spending have occurred in recent years in countries with the highest levels of women's representation.
Finally, Figure 6(c) shows the conditional relationship between women's representation and time on defense spending. Moving from left to right on the graph, we see that defense spending decreases as the percentage of women legislators increases. The blue tones that emerge on the right-hand side of the graph mirror the leveling-off effect we observed for defense spending in Figure 4. In Figure 6(c), there is a slight blending of red and purple tones when women's representation is less than 30 percent, indicative of nonlinear decreases in defense spending. Yet, when women's representation exceeds 30 percent, we see consistent levels of defense spending (pure blue tones) at less than 1.8 percent of GDP. This again provides evidence of a critical limit in the effect of women's representation on defense spending.
8.3 Gender quota laws
Figure 7 presents the results of the interaction between women's representation and the implementation of gender quotas. Since this variable is dichotomous, we show two-dimensional PDPs, where the solid line represents countries that lack a quota and the dashed line represents countries with a quota in place. The patterns presented here largely echo those presented in Figure 4. For education and defense spending, the solid and dashed lines almost entirely overlap one another, indicating that the effect of women's representation is not conditional on the presence of a quota. Countries with quotas have slightly higher levels of healthcare spending; however, the difference is marginal, suggesting the effect of women's representation is not conditional on quota implementation.

Fig. 7. Conditional relationships between percent women legislators and quota implementation. Note: Solid line, no quota; dashed line, quota is implemented.
8.4 Robustness
We probe the robustness of our findings in several ways in the supplemental materials. First, we present alternative visualizations of the relationship between women's representation and government spending, including individual conditional expectation (ICE), local dependence (LD), and accumulated local effects (ALE) plots. We also address the possibility that both changes in women's representation and the allocation of government expenditures are determined by government ideology (Inglehart and Norris, Reference Inglehart and Norris2003) by including a control variable for whether the largest governing party in the legislature is left-leaning. These results are nearly identical to the main findings.Footnote 6 Finally, we estimate expected values of each expenditure category using four alternative modeling strategies: a piecewise regression with two estimated breakpoints, a generalized additive model (GAM) with smoothed functions for the percent women legislators (as well as the 10 other most important covariates shown in Figures 3a, 3b, and 3c), a linear regression where the percent women is approximated by a cubic polynomial, and a neural net with a single hidden layer with 17 nodes. All plots show effects similar to those produced by the random forest partial dependence plots, although the predictions for healthcare spending using a GAM are the most dissimilar.
9. Parametric tests adapted from the machine learning approach
Machine learning offers several advantages for identifying nonlinear relationships, as demonstrated in the preceding sections. However, one limitation is that they do not produce measures of uncertainty, such as confidence intervals, that can be used for hypothesis testing.Footnote 7 But, the results of non-parametric models can be used to inform parametric models for the purpose of statistical inference. We recommend the use of linear splines as a way to apply parametric models to test hypotheses about nonlinear relationships, based on the data-driven results from the PDPs in order to specify where the breakpoints lie. We show a brief illustration here for education expenditures, and provide a detailed step-by-step discussion of how to implement this approach as well as results for the other dependent variables and robustness checks in the supplementary materials.
Figure 4 shows that the effect of women's representation on education spending changes whenever women reach approximately 20–21 and 38–41 percent of the legislature. Based on these findings, we create two knots at the center of each of these intervals, placing linear splines at 20.5 and 39.5 percent women legislators. In addition to the splines, we also include a set of control variables. Unlike non-parametric models, such as random forests, parametric tests are constrained by degrees of freedom, which means that a more parsimonious model is required. We selected the 12 most important variables as determined by the variable importance plots (including our key variable). Since these are panel data, we estimate a fixed-effects model with year dummies.
The results for education spending appear in Table 1, where we show the coefficients, along with associated standard errors, for our breakpoint model. For comparison, we also include results from a model where we assume a linear effect of women's representation, and find that it is positive (with a coefficient of 0.013) and statistically significant. In contrast, in our breakpoint model, we find that only the middle interval (women's representation between the interval 20.5 and 39.5 percent is statistically significant, although the effect size more than doubles relative to the no-breakpoint model. At either high (above 39.5 percent) or low (below 20.5 percent) values of women's representation, there is no statistically significant effect, which lends support to our earlier finding of a critical interval. As shown by Akaike's information criterion (AIC) values, the breakpoint model is slightly preferred to its linear alternative.
Table 1. Education spending
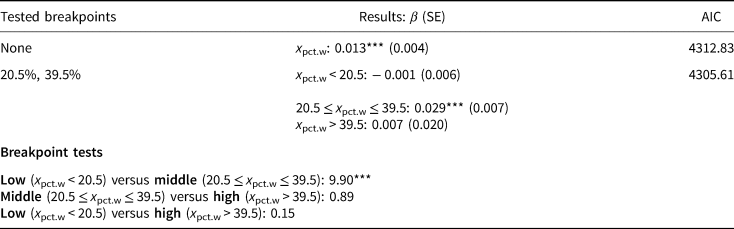
Note: “Results” column displays the percent women in the legislature (x pct.w) coefficient(s) with standard errors in parentheses (OLS with two-way fixed effects). Controls included but not shown. Breakpoint tests display F-statistics that the contrast of the two effects is equivalent to 0. “AIC” column displays Akaike's information criterion.
$^{\ast }{\rm p} < {0}.1$ , $^{\ast \ast }{\rm p}< {0}.05$
 , $^{\ast \ast \ast }{\rm p} < {0}.01$
 .
.
Of course, astute readers may note that the critical mass literature is actually a test of whether the effect size changes across low to high values of women's representation, not necessarily whether the effects are different from zero. Given that a unique slope is calculated for each interval, a joint test can determine whether the effects across intervals are statistically different from one another. As shown in Table 1, we easily reject the null hypothesis that the low and middle interval effects are equivalent to one another, which suggests evidence of a critical mass. In contrast, we do not find that the middle and high interval effects differ from one another, which offers some evidence against our critical limit finding above. We also find no evidence of any difference between the low and high intervals, which is not surprising given how close to zero both coefficients are in the top of Table 1. Overall, our parametric results further support our previous findings from our machine learning approach, while offering a (still flexible) statistical test that many may find useful for testing whether hypotheses are supported.
10. Discussion and conclusion
Women hold seats in national legislatures at higher rates than ever. We have examined one potential consequence of this broader trend: that women's presence in legislatures affects the allocation of government expenditures and leads to greater spending on policy issues that disproportionately concern women. Using supervised tree-based machine learning techniques, we assessed the importance of women's numeric representation as a predictor of spending on education, healthcare, and defense. We then identified possible nonlinearities in these relationships as a way to test critical mass theory. We examined whether the effect of women's representation is conditional on a third variable, including level of democracy, the passage of time, and gender quota laws. Finally, we used our inductive machine learning approach to better inform a parametric model, for which we could create testable hypotheses.
We find that women's representation is an important predictor of spending in all three areas, especially education and healthcare. These findings are especially noteworthy given the complex nature of the budgetary process. We also find evidence that the relationships between women's representation and government spending are nonlinear and vary across time and level of democracy. These findings offer some support for the idea that the effect of women legislators varies across levels of women's representation, as suggested by critical mass theory. However, these relationships appear to be even more complex than previously theorized.
In the cases of education and healthcare spending, there appears to be a critical mass interval, rather than one critical mass point. Women's representation has a positive effect on education spending when women compose 20–41 percent of the legislature, and a positive effect on healthcare spending when women make up 15–35 percent of the legislature. However, women's representation appears to have little effect both before and after these critical mass intervals. In the case of defense spending, increases in women's representation lead to decreases in defense spending until women's representation reaches approximately 30 percent. After this point, women's representation again appears to have little effect, suggesting a critical limit point rather than a critical mass threshold.
The finding that women's representation does not significantly influence spending on education and healthcare below a certain breakpoint aligns well with traditional critical mass theory. What is not widely theorized by previous research is that the effect of women's representation will then dissipate after a certain upper threshold has been reached. For all expenditure areas, we find that beyond a certain breakpoint, spending is no longer influenced by women's representation. This could be interpreted in several ways.
One interpretation is that the critical limit point is an indication of gender equality: true gender equality in the legislature is achieved when women legislators can act on diverse policy issues and are no longer tasked with being the primary representatives of women's interests (Heath et al., Reference Heath, Schwindt-Bayer and Taylor-Robinson2005). Second, men legislators who are surrounded by many women legislators might become more aware of women's interests and begin to champion these issues themselves. Third, these findings could be indicative of a ceiling effect, meaning that after a certain threshold, women are unable to enact more changes to government spending. Fourth, the critical limit point could be interpreted as a manifestation of backlash in response to women's increased presence in the legislature. That is, there may be pushback against women legislators’ efforts once women reach a threshold that is seen as threatening to men (Grey, Reference Grey2006; Beckwith and Cowell-Meyers, Reference Beckwith and Cowell-Meyers2007; Krook, Reference Krook2015). A fifth possibility is that we lack a sufficient number of observations to make firm conclusions about the critical limit point.
In sum, our results suggest that critical mass may be at play, but the relationships between women's representation and outcomes of interest are likely even more complicated than previously hypothesized. Future research should continue to examine how women's numeric representation affects outcomes related to women's substantive representation and beyond, whether these relationships are nonlinear, and whether they vary across different contexts and outcomes. The flexibility provided by data-driven approaches such as machine learning are useful for identifying potential underlying relationships; however, they are less useful for explaining why these relationships exist.Footnote 8 Future research is needed to tease out the causal mechanisms at play, and which interpretation(s) of these findings is supported across different contexts.
Supplementary material
The supplementary material for this article can be found at https://doi.org/10.1017/psrm.2021.51.


 Open access