


1 Introduction
The conjoint survey experiment allows researchers to estimate the relative importance of two or more factors in individuals’ decisions (Hainmueller, Hopkins, and Yamamoto Reference Hainmueller, Hopkins and Yamamoto2014). Although only recently introduced to political science, conjoint experiments have gained popularity as a powerful and flexible analytical tool. In the standard conjoint experiment, respondents are asked to choose among options that have a fixed number of attributes with randomized values. On the basis of respondents’ choices, scholars can simultaneously make inferences about the effects of several different attribute values on the decisions of interest within the studied population. This is an important advantage over standard survey experiments that manipulate one attribute at a time. In addition, conjoint experiments are robust to certain response quality issues such as survey satisficing (Bansak et al. Reference Bansak, Hainmueller, Hopkins and Yamamoto2019).
An important development with regard to randomized experiments concerns the estimation of heterogeneous treatment effects (Imai and Strauss Reference Imai and Strauss2011). Currently, such heterogeneities in conjoint experiments are addressed by comparing subgroups in terms of average marginal component effects (AMCEs). Recent suggestions regarding this practice include the application of a hierarchical Bayesian approach to model AMCE variability (Horiuchi, Smith, and Yamamoto Reference Horiuchi, Smith and Yamamoto2018), and the use of marginal means rather than AMCEs as the comparison benchmark (Leeper, Hobolt, and Tilley Reference Leeper, Hobolt and Tilley2020). However, subgroup comparisons have essential limitations as a method to explore effects’ heterogeneity. Importantly, they can use only known categories, leaving potentially important latent heterogeneities unidentified. Furthermore, classifying respondents into subgroups often involves arbitrary decisions that may influence the results. For instance, what is the cutoff point between those high versus those low in ethnocentrism? Or should party-leaning independents in the United States be treated as partisans? Altogether, comparisons based on categorizing respondents into types ignore a large share of variation in preferences across the population, which may be of substantive interest to researchers.
Consider the following example. A conjoint study of immigration preferences reveals that Americans prefer to admit immigrants who are educated and proficient in English, while immigrants’ origin countries do not have much impact (Hainmueller and Hopkins Reference Hainmueller and Hopkins2015). Yet, important variation in preferences within the population may still exist. Even when the average effect is positive, as it is in the case for immigrants’ education, preferences may vary in strength. If education is highly important for some respondents but not really important for others, it is still possible to observe an average effect that is positive and statistically reliable on a conventional level.
The same logic as above is true for null results. For instance, according to the same study, immigrants from Somalia are, on average, neither rewarded nor punished in terms of Americans’ admission choices (when compared with immigrants from India as the baseline). This may mean, however, that some respondents strongly oppose admitting Somali immigrants while others strongly support their admission (e.g., for humanitarian reasons). Importantly, these potential differences in preferences may not always follow known characteristics of respondents, such as ethnocentrism or partisanship. In fact, if such heterogeneities exist but are orthogonal to the partisan conflict on immigration, that could be a substantively interesting finding.
Therefore, I propose an alternative approach to explore effects’ heterogeneity in conjoint experiments. Specifically, I offer a systematic procedure for obtaining respondent-level preference estimates: individual marginal component effects (IMCEs). IMCEs represent estimated causal quantities—the effects of specific treatment components, or attribute values—for each individual respondent. These allow the researcher to estimate the full distributions of preferences within the population.Footnote 1 Similarly, IMCEs can be used to explore the relationships between different preference dimensions.
There are additional reasons why obtaining individual-level effects from conjoint experiments is of theoretical and methodological value. One major benefit of obtaining IMCEs is the capacity to use them as measures of preferences in subsequent analyses, such as regression; this is similar to methods that derive individual-level estimates from list experiments (Imai, Park, and Greene Reference Imai, Park and Greene2015). Conjoint analysis, after all, is a method of measurement: it allows researchers to assess the direction and strength of citizens’ preferences with respect to some attributes of interest. As a measurement method, conjoint experiments possess a number of essential advantages compared with standard survey questions: enhanced realism, multidimensionality, and reduced social desirability concerns. Estimating IMCEs would allow researchers to use them in regression analysis as predictors of politically relevant attitudes and behaviors. This capacity to move beyond describing mean preferences within the population would increase overall value of conjoint experiments as a method.
Estimated IMCEs can also help to further demonstrate the external validity of conjoint experiments. Existing studies validate conjoint experiments by contrasting their results with real-life behavioral benchmarks at the aggregate level (e.g., Hainmueller, Hangartner, and Yamamoto Reference Hainmueller, Hangartner and Yamamoto2015). IMCEs, in turn, can be used to test whether conjoint experiments validly measure individual preferences. Consider a recent study that employs eye-tracking data as a comparison benchmark for AMCE estimates from a conjoint experiment (Jenke et al. Reference Jenke, Bansak, Hainmueller and Hangartner2020). Obtaining IMCEs would allow the researcher to assess the correspondence between the measures of attribute importance based, respectively, on conjoint experiment and eye movement for each individual. The approach may identify respondents for whom this correspondence is better or worse—and, potentially, explore the correlates of these individual differences.
The proposed procedure to estimate IMCEs relies on the same set of assumptions as the estimation of average effects in conjoint studies. It also involves only minor adjustments to the design of conjoint tasks such that unbiased IMCE estimates can be feasibly obtained. These adjustments include using a rating (rather than choice) outcome, minimizing the number of randomized values for each attribute, and maximizing the number of rated profiles. I also develop two alternative methods to account for uncertainty of IMCE estimates based on, respectively, the normality assumption and nonparametric bootstrap. Computation of IMCEs, investigation of their distributions, and estimation of relationships to other variables can be implemented in commonly used statistical software.
To demonstrate how the proposed method can be applied in practice, I run a survey study that partially replicates a conjoint experiment on immigrant admission to the United States, with recommended design adjustments. Then, I explore the distributions of the estimated IMCEs. I find that the preferences with respect to the substantive attributes of potential immigrants tend to be asymmetric: almost nobody prefers those who are less educated, speak poor English, and violate entry rules. Respondents who prefer immigrants with college degrees, English fluency, and no status violations are much more numerous, and these imbalances lead to significant average effects. At the same time, most respondents do not appear to have reliable preferences on the substantive attributes of potential immigrants, as the corresponding IMCEs are too uncertain. Importantly, these asymmetric distributions and widespread indifference to immigrants’ education, English proficiency, and status history could not have been identified without estimating IMCEs.
Overall, this paper advances the methodology of conjoint experiments as a tool for political research. It demonstrates how individual-level estimates of preferences can be obtained from conjoint tasks and used in further analyses—thus moving beyond simple descriptions of average preferences within specific populations. The proposed procedure can be easily applied in other domains where conjoint experiments have proved useful.
2 Individual Marginal Component Effect
Average marginal component effect (AMCE) obtained from conjoint experiments is defined as the marginal effect of the attribute averaged over the joint distribution of the remaining attributes. It is conceptually related to the average treatment effect (ATE): the difference in mean outcomes between treatment and control groups.Footnote 2 Experimental researchers have to rely on averaging across respondents due to what is known as the fundamental problem of causal inference: unit treatment effect (UTE) can almost never be recovered. However, since respondents in conjoint experiments often rate multiple profiles with randomized attribute values, it is possible to obtain estimates for treatment effects at the unit level—that is, for an individual respondent.Footnote 3 These quantities are of little interest when the goal is to describe preferences in the general population. Nevertheless, individual-level estimates of preferences obtained from conjoint experiments can be used to explore how preferences vary within the population and relate to other political attitudes.
These quantities can be estimated from conjoint experiments using what I call the individual marginal component effect (IMCE). It relates to the AMCE the same way UTE relates to ATE: IMCE recovers the effect of interest for each unit of analysis (i.e., the individual survey respondent) instead of relying on averages. The word “individual” in effect designation, therefore, refers to the individual respondent (unit), not to the individual profiles, attributes, or values.
When the assumptions of (1) stability and no carryover effects, (2) no profile-order effects, and (3) completely independent randomization of the profiles in a conjoint experiment hold, IMCEs can be estimated independently for each respondent. Define a sample of respondents indexed $i = 1, \dots , I$
. Each respondent rates a predefined number of profiles indexed
$i = 1, \dots , I$
. Each respondent rates a predefined number of profiles indexed $j = 1, \dots , J$
. Let
$j = 1, \dots , J$
. Let $ \operatorname {\mathrm {\mathbf {y}}}_i = (y_{i1}, \dots , y_{iJ})$
be the vector of length J containing ratings given by respondent i to presented profiles. Profiles are described in terms of attributes indexed
$ \operatorname {\mathrm {\mathbf {y}}}_i = (y_{i1}, \dots , y_{iJ})$
be the vector of length J containing ratings given by respondent i to presented profiles. Profiles are described in terms of attributes indexed $l = 1, \dots , L$
. Let
$l = 1, \dots , L$
. Let $ \operatorname {\mathrm {\mathbf {x}}}_{il} = (x_{i1l}, \dots , x_{iJl})$
be the vector of length J containing values of attribute l from profiles presented to respondent i. For simplicity and without loss of generality, assume that attribute l has only two possible values:
$ \operatorname {\mathrm {\mathbf {x}}}_{il} = (x_{i1l}, \dots , x_{iJl})$
be the vector of length J containing values of attribute l from profiles presented to respondent i. For simplicity and without loss of generality, assume that attribute l has only two possible values: $x_{ijl} \in \{0,1\}$
. Then, respondent-specific regressions take the form of
$x_{ijl} \in \{0,1\}$
. Then, respondent-specific regressions take the form of
where $\alpha _{il}$
and
$\alpha _{il}$
and $\beta _{il}$
are respondent-specific regression parameters to be estimated and
$\beta _{il}$
are respondent-specific regression parameters to be estimated and
![]() is the vector of respondent-specific errors. Define
is the vector of respondent-specific errors. Define
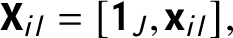 $$ \begin{align} \operatorname{\mathrm{\mathbf{X}}}_{il} = [\boldsymbol{1}_J, \operatorname{\mathrm{\mathbf{x}}}_{il}], \end{align} $$
where $\boldsymbol {1}_J$
is an all-ones vector of length J. Then, IMCE of attribute l for respondent i, denoted
$\boldsymbol {1}_J$
is an all-ones vector of length J. Then, IMCE of attribute l for respondent i, denoted $\pi _{il}$
, can be estimated as
$\pi _{il}$
, can be estimated as
 $$ \begin{align} \big( \hat\alpha_{il}, \hat\beta_{il} \big) &= (\operatorname{\mathrm{\mathbf{X}}}_{il}^{\operatorname{{\mathrm{T}}}} \operatorname{\mathrm{\mathbf{X}}}_{il})^{-1} \operatorname{\mathrm{\mathbf{X}}}_{il}^{\operatorname{{\mathrm{T}}}} \operatorname{\mathrm{\mathbf{y}}}_i, \nonumber \\ \hat\pi_{il} &= \hat\beta_{il}. \end{align} $$
3 Design Requirements
Practical challenges for estimating IMCEs require certain adjustments to the standard conjoint design. First, the estimation of AMCEs relies on relatively large samples with effective numbers of observations equal to the number of respondents times the number of rated profiles. Estimating IMCEs, in turn, requires samples as small as the number of rated profiles per respondent, usually not exceeding two dozen. This precludes the researcher from achieving the benefits of large-sample theory, meaning that the estimator of IMCEs has to have good small-sample properties. One such estimator is ordinary least squares (OLS): since the exogeneity assumption holds in a conjoint experiment by design, OLS estimates of IMCEs are unbiased. However, since the OLS estimator works most efficiently with interval dependent variables, conjoint experiments aimed at estimating IMCEs have to employ numerical ratings of profiles rather than discrete choice responses.
Second, the number of potential attribute values that can be used in a conjoint experiment aimed at estimating IMCEs is limited. Since attribute values are randomized, there is always a chance that an individual respondent is never presented with a profile containing a specific attribute value. In this case, IMCE cannot be estimated. To minimize such occurrences, the number of potential values for each single attribute should be minimized. It is necessary to note that even with minimal numbers of attribute values, respondents who never see at least one attribute value will likely appear in the dataset anyway—but such cases will be rare and completely at random.
The third practical aspect of estimating IMCEs concerns the number of profiles that respondents rate. Increasing this number decreases the probability of cases when an individual respondent is never presented with a specific attribute value. Additionally, greater numbers of rated profiles improve reliability of estimated IMCEs. At the same time, there are limits to the number of rated profiles related to both survey costs and respondent fatigue. Therefore, the number of rated profiles should be maximized—up until the point survey satisficing becomes a problem, which is around 30 (Bansak et al. Reference Bansak, Hainmueller, Hopkins and Yamamoto2018).
4 Accounting for Uncertainty
Even though IMCE estimates are unbiased under complete randomization, they are also uncertain. Since IMCE estimation relies on relatively small numbers of observations, the resulting measurement error, though random, can be relatively large. Since the ultimate goal of obtaining IMCEs is using them in subsequent analyses, treating point estimates as true values can inflate the reliability of estimated associations. Here, I propose a procedure of accounting for uncertainty of IMCE estimates: instead of using point estimates, potential IMCE values are drawn multiple times from their estimated sampling distributions.
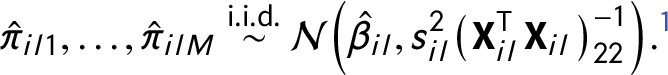
The sampling distributions of IMCEs can be estimated either parametrically or nonparametrically. Parametric estimation relies on the normality assumption: given a normal distribution of errors, the OLS estimator is normally distributed with the mean equal to the true parameter value. Then, IMCE values can be drawn M times from this distribution with standard deviation approximated using the standard error
The alternative way of estimating the sampling distribution of IMCEs makes use of a nonparametric bootstrap. Start from sampling pairs $(x_{ijl}, y_{ij})$
from the empirical distribution, i.e. resampling with replacement
$(x_{ijl}, y_{ij})$
from the empirical distribution, i.e. resampling with replacement
 $$ \begin{align} \big( \operatorname{\mathrm{\mathbf{x}}}^*_{ilm}, \operatorname{\mathrm{\mathbf{y}}}^*_{im} \big) = \big[ (x^*_{il1m}, y^*_{i1m}), \dots, (x^*_{ilJm}, y^*_{iJm}) \big] \overset{\text{i.i.d.}}{\sim} \hat{F}_i, \end{align} $$
where $m \in \{1,\dots ,M \}$
. Also, define
$m \in \{1,\dots ,M \}$
. Also, define
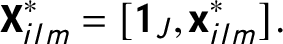 $$ \begin{align} \operatorname{\mathrm{\mathbf{X}}}_{ilm}^* = [\boldsymbol{1}_J, \operatorname{\mathrm{\mathbf{x}}}^*_{ilm}]. \end{align} $$
Then, plausible values of $\hat \beta _{ilm}$
—and, respectively,
$\hat \beta _{ilm}$
—and, respectively, $\hat \pi _{ilm}$
—can be obtained by re-estimating the OLS regression for each of the M samples from
$\hat \pi _{ilm}$
—can be obtained by re-estimating the OLS regression for each of the M samples from $\hat {F}_i$
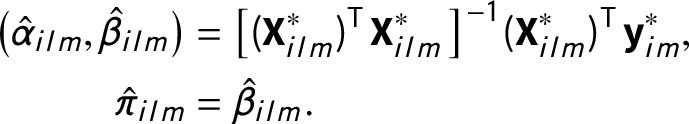 $$ \begin{align} \big( \hat\alpha_{ilm}, \hat\beta_{ilm} \big) &= \big[ (\operatorname{\mathrm{\mathbf{X}}}_{ilm}^*)^{\operatorname{{\mathrm{T}}}} \operatorname{\mathrm{\mathbf{X}}}_{ilm}^* \big]^{-1} (\operatorname{\mathrm{\mathbf{X}}}_{ilm}^*)^{\operatorname{{\mathrm{T}}}} \operatorname{\mathrm{\mathbf{y}}}_{im}^*, \nonumber \\ \hat\pi_{ilm} &= \hat\beta_{ilm}. \end{align} $$
It is necessary to note that, given the random character of the bootstrap process, some resamples can result in the absence of variance on specific attribute values (which would prohibit the estimation of the corresponding IMCE). In such cases, resampling can be repeated as necessary to obtain the required number of complete replications.
Independently of how the sampling distributions are estimated, the plausible IMCE values can be employed in consequent analyses using the method proposed for multiple imputations (Rubin Reference Rubin1987). First, the quantities of interest are estimated for all datasets containing randomly drawn plausible values of IMCEs. Second, the results of these estimations are aggregated using guidelines for calculating average point estimates, combined between- and within-imputation variances, and adjusted degrees of freedom.
5 Empirical Application: Immigrant Admission
To evaluate the proposed method, I designed and fielded a survey study with an embedded conjoint experiment. Participants were recruited using the Lucid panel in December 2019. Lucid samples match the American National Election Study on a number of important demographic benchmarks (Coppock and McClellan Reference Coppock and McClellan2019). A total of 1,003 respondents with unique identifiers completed the questionnaire. Of them, 74 respondents used the exact same rating scores for all profiles in the conjoint experiment. After excluding them, the analyzed sample consisted of 929 individuals. Participants’ demographics were supplied by the Lucid panel. The sample characteristics were the following: the mean age was 45.3 years; the gender ratio was 48.7% male to 51.3% female; the median household income was $40,000–$44,999; also, 69.7% of respondents were non-Hispanic whites. Finally, 40.2% of respondents were Democrats, 34.1% were Republicans, and 25.7% were independents.
The key part of the survey was a conjoint experiment that partially replicated an immigrant admission study (Hainmueller and Hopkins Reference Hainmueller and Hopkins2015), with adjustments necessary to feasibly estimate IMCEs. In the experiment, each respondent rated 15 pairs of profiles (30 profiles total) of potential immigrants in terms of preference for being admitted to the United States. The conjoint part of the study was programmed on the Qualtrics survey platform using the Conjoint Survey Design Tool (Strezhnev et al. Reference Strezhnev, Hainmueller, Hopkins and Yamamoto2014).
Profiles of hypothetical immigrants were described in terms of six attributes. Attributes were selected following the original experiment to be replicated, as well as the current literature on politics of immigration. They included age and gender (Ward Reference Ward2019), race/ethnicity (Valentino, Brader, and Jardina Reference Valentino, Brader and Jardina2013), education (Valentino et al. Reference Valentino2019), English proficiency (Newman, Hartman, and Taber Reference Newman, Hartman and Taber2012), and legality of prior visits to the United States (Wright, Levy, and Citrin Reference Wright, Levy and Citrin2016). Respondents rated immigrant profiles using an 11-point scale from 0 = Definitely not admit to 10 = Definitely admit.
To make profiles look more realistic, the vignettes used more than two possible values for some attributes in descriptions presented to respondents. However, these values were chosen so that they could be easily dichotomized to feasibly estimate IMCEs. For instance, English proficiency was collapsed into categories “Good” (attribute values “High” or “Very high”) and “Poor” (attribute values “Very low” or “Low”). Values for all attributes were fully and independently randomized with uniform distributions—all values of an attribute had equal probabilities of being presented. See Figure 1 for an example of conjoint profiles as presented to respondents and Table 1 for the full list of attribute values.
The survey also included a short question battery to assess respondents’ ethnocentrism adapted from a longer version (Bizumic and Duckitt Reference Bizumic and Duckitt2012). Respondents were asked about their agreement or disagreement with statements about general preference for their cultural in-group. The following is a sample item: “In most cases, I like people from my culture more than I like others.” Answers were given on a 7-point Likert-type scale from 1 = Strongly disagree to 7 = Strongly agree.Footnote 5

Figure 1 Experimental design.
Table 1. Attributes for immigrant profiles in conjoint experiment.
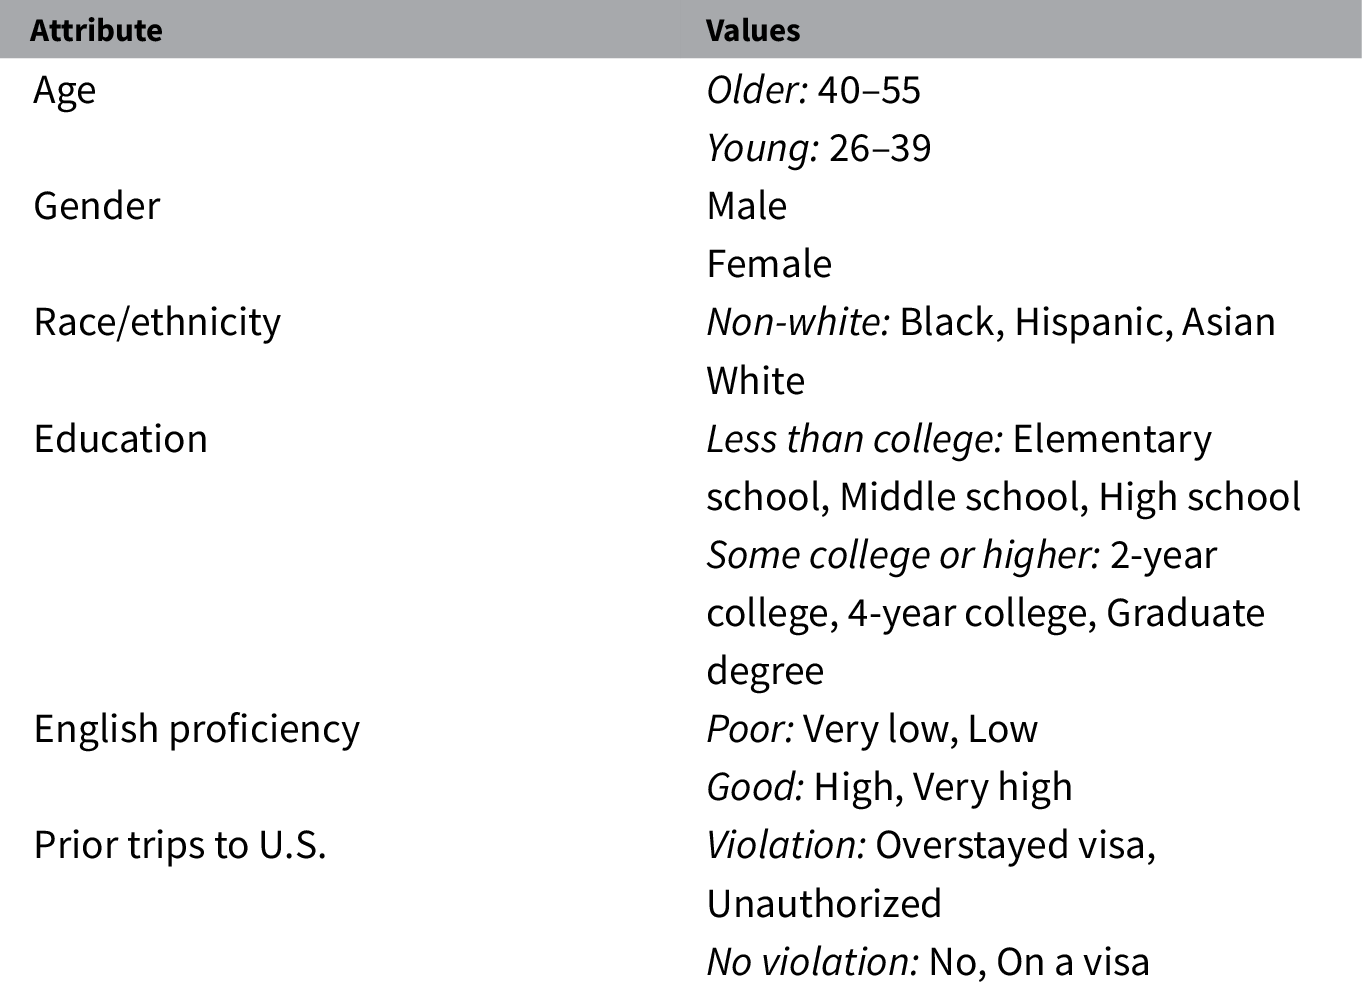
Note. Age values (in years) were randomly chosen from the specified intervals. Collapsed values are in italics.
6 IMCE in the Immigrant Admission Experiment
I start with replicating the aggregate results of the immigration admission task, with the conjoint design adjusted for estimation of IMCEs.Footnote 6 To do so, I estimate AMCEs using the standard procedure. Results are presented in Figure 2. Following the guidelines, standard errors are clustered on the level of respondents (Hainmueller et al. Reference Hainmueller, Hopkins and Yamamoto2014). Overall, AMCE estimates very closely replicate results of the previous immigrant admission study—given the design differences. Respondents hold relatively strong preferences for admitting immigrants who have at least some college education, speak English well, and have not violated U.S. immigration rules in the past. The estimated effects of immigrants’ race and age on admission preferences are extremely close to zero. Finally, respondents exhibit slight preference for immigrant women over men, on average.
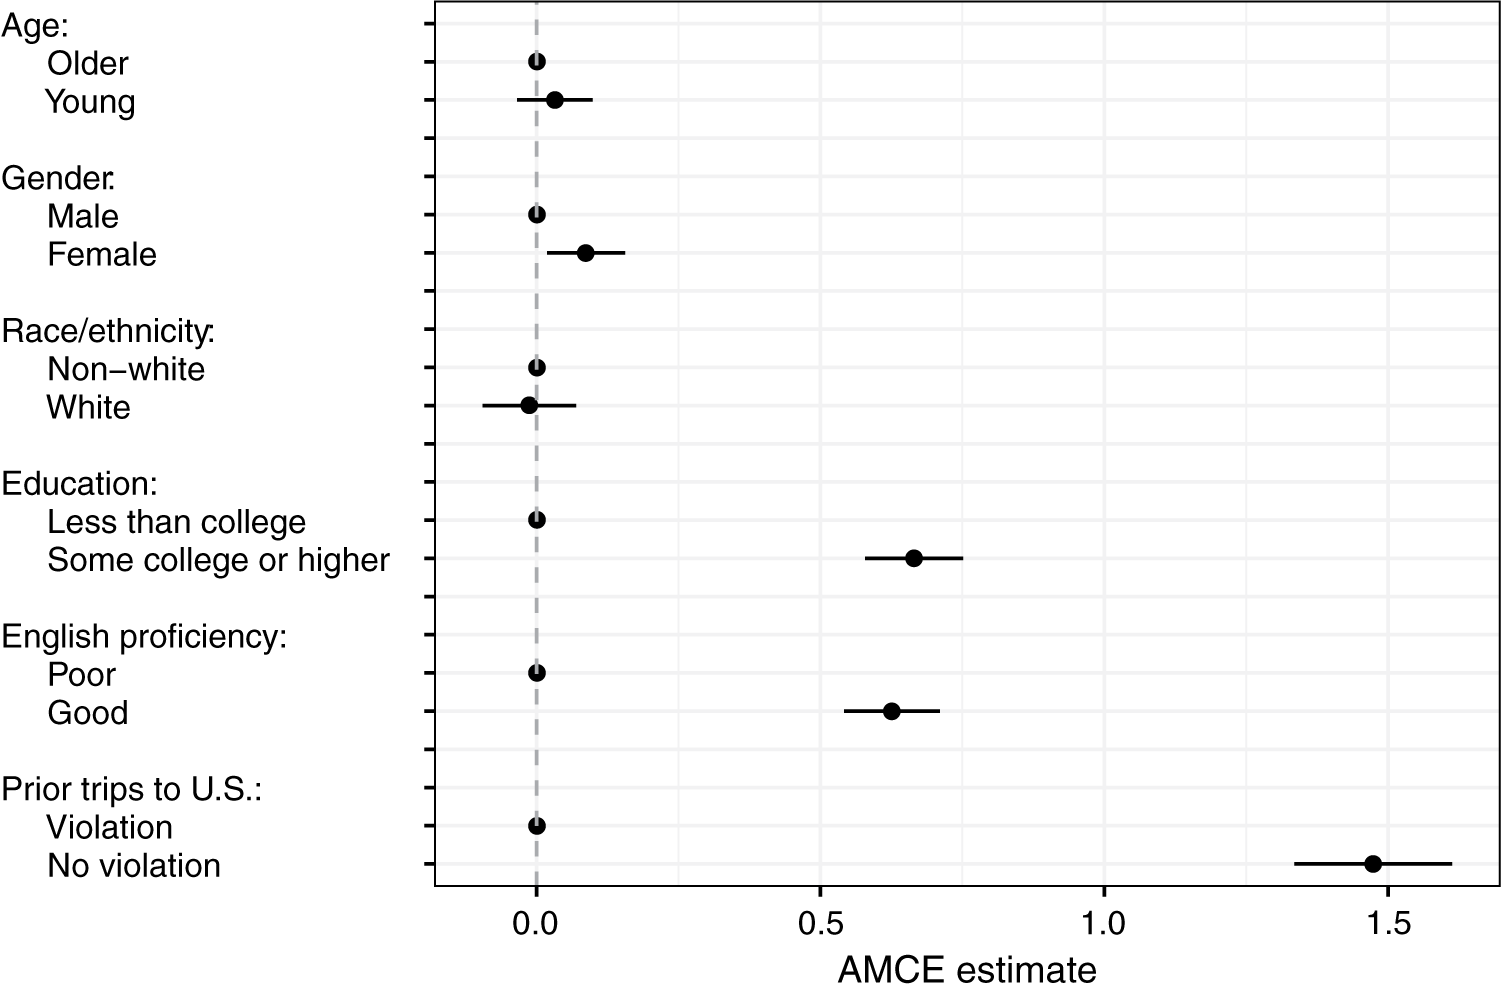
Figure 2 Effects of profile attributes on admission preference ratings.
The successful replication is important, because it demonstrates comparability between the standard conjoint design and the adjusted one.Footnote 7 Recall that the adjustments necessary to feasibly estimate IMCEs involve simplifications, including the minimization of possible values per profile—at least in the analysis, if not in the task itself. However, even with this simplified design, I have obtained the same substantive result: Americans prefer immigrants with high-skilled occupations, good knowledge of English, and a commitment to following immigration rules. Overall, a relatively simple conjoint experiment with only six attributes and minimal numbers of values per attribute successfully replicates a much more complicated study with detailed vignettes.
From a practical standpoint, the successful replication permits me to proceed with the next step of the analysis: estimating IMCEs. To do so, I obtain IMCE point estimates calculated according to Equation (3). IMCEs on all six preference dimensions are successfully estimated for 928 out of 929 respondents.Footnote 8 As a result of the binary character of all analyzed attributes, IMCE estimates have straightforward interpretations. For instance, the education attribute IMCE reflects the direction (sign) and strength (magnitude) of each respondent’s preference for immigrants with at least some college education vis-a-vis those without college education.Footnote 9
Table 2 presents IMCE frequencies for all preference dimensions by estimates’ direction and reliability.Footnote 10 They reveal a clear distinction between demographic and substantive attributes of immigrants. Frequencies of IMCEs for age, gender, and race show that the large majorities of respondents have no reliable preferences on these attributes. However, those with reliable preferences for and against youngsters, females, and whites as immigrants, though very rare, are still present in the sample.
Table 2. Frequencies of attributes’ individual marginal component effects by direction.
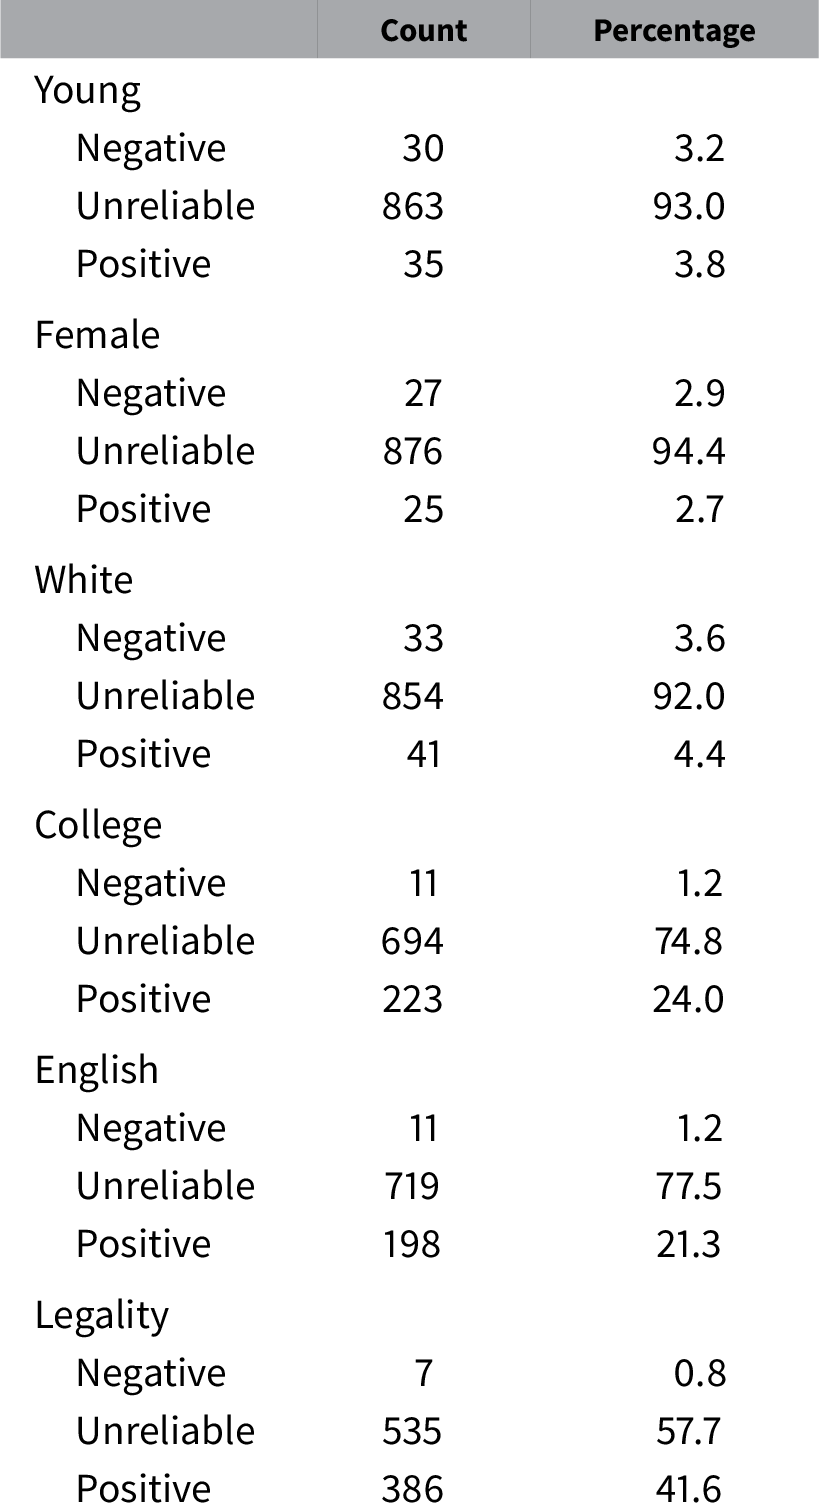
Note. Percentages may not sum up to 100 due to rounding. Negative effect = point estimate negative, 95% CI does not include zero. Unreliable effect = 95% CI includes zero. Negative effect = point estimate positive, 95% CI does not include zero.
It is interesting that the majority of respondents also do not have reliable preferences on immigrants’ education, English proficiency, and legal history. At the same time, those with reliable preferences for highly educated, English-proficient, and authorized immigrants are relatively numerous: from 25% to 40% of the sample depending on the attribute. Since almost nobody prefers immigrants who have no college degrees, poor English skills, or prior status violations, the average effects for these attributes are in the expected direction. Overall, distributions of IMCEs for substantive attributes of immigrants are asymmetric.Footnote 11
Since essential variation in preferences estimated via IMCEs exists, I move to exploring how they covary. Correlations between different dimensions of preferences, estimated using IMCEs for the corresponding conjoint attributes, are presented in Table 3. Results suggest that preference dimensions are mostly independent from one another. The only correlation of note is that respondents who prefer English-proficient immigrants also tend to prefer those with college education.
Table 3. Preference correlations based on individual marginal component effect point estimates.
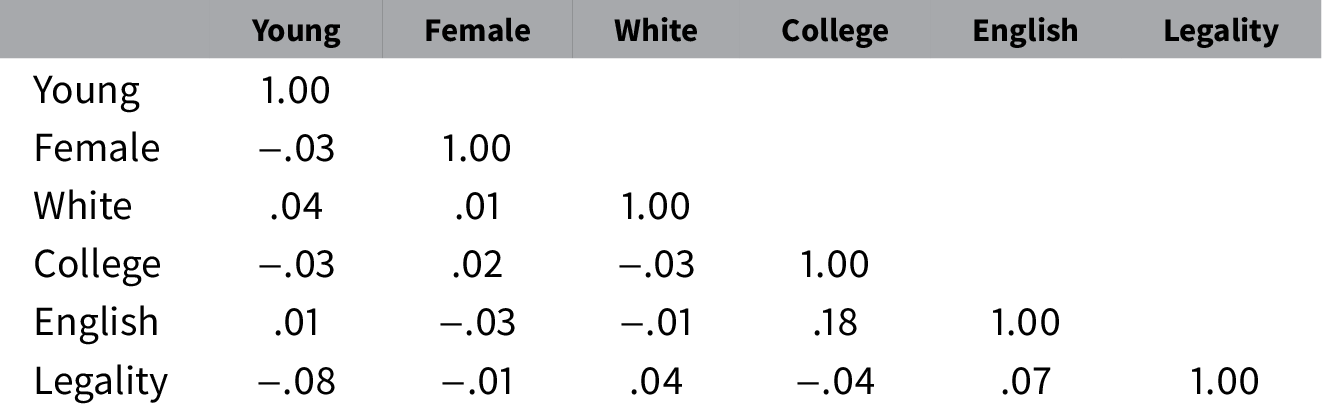
Note. Entries are Pearson’s r coefficients.
Finally, I turn to estimating the relationships between IMCEs and other individual-level variables of interest. For these analyses, I obtain the following sets of data, in addition to IMCE point estimates: (1) 100 plausible values for each IMCE drawn from the normal distribution according to Equation (4) and (2) 100 plausible values for each IMCE obtained using nonparametric bootstrap according to Equation (7). All bivariate relationships, therefore, are estimated with three sets of IMCE values: point estimates, imputed using the normality assumption, and imputed using a nonparametric bootstrap. Point and variance estimates for analyses with imputed datasets are obtained using the guidelines for multiple imputations.
Figure 3 presents the bivariate relationships of IMCEs with ethnocentrism, education, and partisanship. These variables are used in the analysis as interval and rescaled to the 0–1 range for comparison purposes. The earlier investigation of the variation of immigration preferences within the American electorate has revealed the “hidden consensus” along all these covariates (Hainmueller and Hopkins Reference Hainmueller and Hopkins2015). According to my results, this finding—for the most part—seems to hold when IMCEs are used to estimate the relationships of interest. Education and ethnocentrism are not strongly or consistently associated with preferences for immigrant admission on any dimension. At the same time, a pronounced relationship emerges between preference for immigrants with no prior status violations and partisanship. Specifically, Republicans tend to prefer potential immigrants who do not break the rules (vs. those who do) to a greater extent than Democrats. This result may reflect the increased partisan divide over illegal/undocumented immigration in the past years.
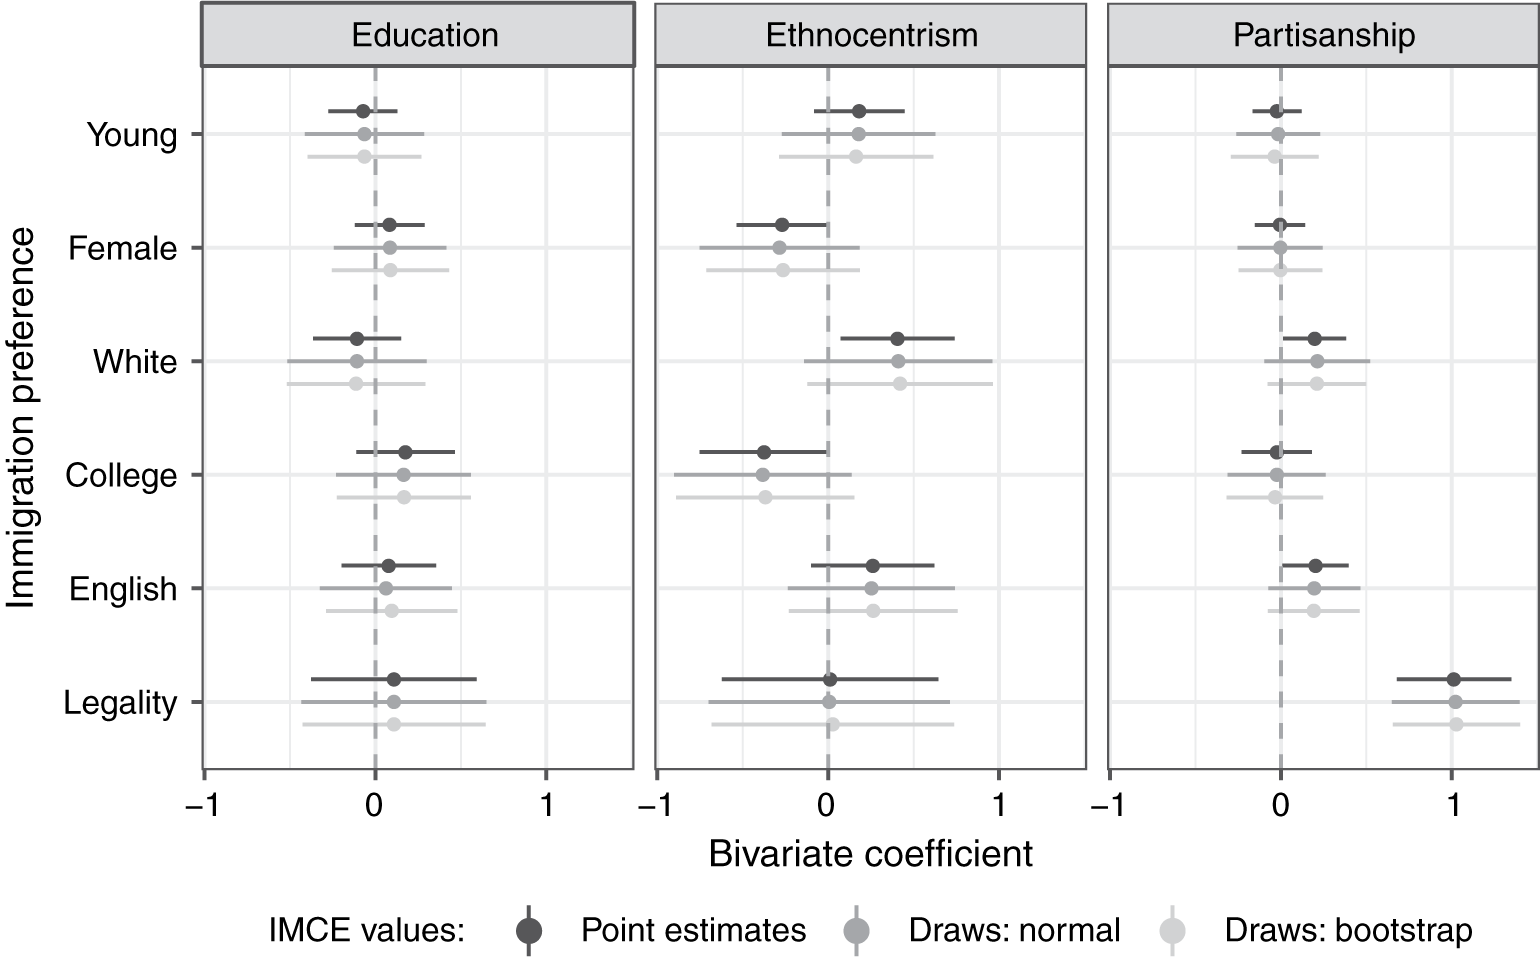
Figure 3 Bivariate relationships of IMCEs with education, ethnocentrism, and partisanship.
Altogether, the application of IMCEs from an immigration admission conjoint experiment represents an important extension to the results reported previously. Specifically, respondents’ preferences with respect to three attributes of potential immigrants—education, English proficiency, and previous status violations—are positively skewed. Nontrivial shares of respondents prefer immigrants with college degrees, good knowledge of English, and no history of unauthorized presence in the United States, whereas almost no one prefers those with the opposite traits. At the same time, for majorities of respondents, IMCEs for these attributes are not reliably different from zero. This suggests that respondents with clearly defined preferences on immigration are a minority—but their demands are pronounced enough to produce significant AMCEs.
7 IMCE Estimation: A Brief Guide
Researchers need to consider several important steps when designing and analyzing conjoint experiments aimed at estimating IMCEs:
-
1. Feasible estimation of IMCEs requires a few important adjustments to the conjoint design. It means that the decision about whether to estimate IMCEs should be made at the experiment design stage.
-
2. Raw data exported from most survey platforms usually do not adhere to the format necessary to estimate IMCEs. Therefore, the data need to be reshaped making sure that unique respondent identifiers are preserved.
-
3. IMCEs are estimated independently for each respondent using OLS regressions and recorded in a separate dataset. These individual-level estimates are linked back to survey data using unique respondent identifiers.
-
4. Uncertainty of IMCE estimates can be accounted for by making multiple random draws from estimated sample distributions of IMCEs. These draws can be used in inferential analyses as multiple imputations.
-
5. Some robustness checks are recommended even if IMCEs have been successfully obtained. Since estimating IMCEs requires large numbers of rated profiles, it is important to test for the stability of measured preferences.
Scripts used to (1) process raw survey data, (2) estimate and record IMCEs, (3) draw probable values from IMCE sample distributions estimated using normal approximation and nonparametric bootstrap, and (4) estimate the relationships between IMCEs and respondent-level covariates in the immigrant admission replication study are available with the online replication materials.
8 Discussion of Design Requirements
As a result of the recommended adjustments to the design of conjoint experiments, the proposed procedure involves important trade-offs—of which researchers should be aware. IMCE estimation relies on the OLS method with relatively small numbers of observations and, thus, conjoint tasks should use interval rating outcomes, especially if the normality assumption is invoked to account for estimates’ uncertainty. Therefore, the estimation of IMCEs may be less compatible with conjoint designs that necessarily imply binary choices as outcomes due to their substantive research questions. Since conjoint experiments generally permit both rating and binary outcomes, researchers can use this opportunity to compare effects estimated using interval and binary dependent variables. However, inclusion of both rating and choice responses for each conjoint scenario increases overall length of the survey. In the case of length limitations, maximizing the total number of rated profiles per respondent may be more important.
Additionally, the number of potential randomized values for each attribute should be minimized. This can be achieved in two ways: researchers can use relatively broad attribute values either at the design stage or at the analysis stage. Consider the immigrant admission example. Profiles of potential immigrants can be described as showing a “Low” or “High” level of education in the task itself. Alternatively, profile descriptions can use specific education levels, such as “High school” or “4-year college.” Then, these values can be collapsed into broader categories, such as “Less than college” versus “College or higher,” for the purpose of IMCE estimation. The latter option is preferable, because it increases profiles’ realism and limits potential differences in respondents’ interpretations of less specific labels. Moreover, when a diverse set of attribute values is used in the conjoint task itself, it is still possible to estimate AMCEs for the specific attribute values. Such analysis can be used as a diagnostic tool to make sure that the effects of broader categories are not driven by specific values—and, therefore, whether collapsing them is justified.
It is necessary to emphasize that even though this study collapses values for all conjoint attributes into binary categories, this is not an absolute necessity. It is still possible to obtain IMCEs with more than two randomized values per attribute if and when dichotomization is particularly undesirable. For instance, exploring individual-level preferences with regard to Hispanic or Asian immigrants, rather than just “non-white,” can be of substantive interest. However, researchers should remember that the number of values per attribute can only be increased to a reasonable degree and that it is done at the expense of decreased statistical power for IMCE estimation.
Finally, the number of rated profiles per respondent should be maximized, ideally close to the 30 profiles, which is currently considered the upper limit. The absolute minimum number of profiles needed to obtain reliable IMCE estimates, and whether such a number exists as a firm boundary, should be addressed in future research. As of now, a conservative recommendation would be to use no fewer than 20 rated profiles per respondent. This means that the conjoint task has to be relatively long, possibly limiting opportunities to include other items in the same survey for time or cost considerations.
Reduction of these trade-offs can be another promising direction for further research. For instance, the application of hierarchical/multilevel modeling may improve the efficiency of IMCE estimation—and thus give researchers additional leeway in some of the design choices discussed in this section. However, making assumptions about the hierarchical structure of the data can lead to biased IMCE estimates, and future studies should explore whether resulting gains in efficiency outweigh such bias.
9 Concluding Remarks
The flexibility and power of conjoint experiments earned them popularity among political researchers over a relatively short period of time. Currently, conjoint analyses are employed to measure average preferences within certain populations by exploring respondents’ behaviors in multidimensional choices. In this paper, I have moved the methodological literature one step further by showing that estimates of individual-level preferences can be obtained from conjoint experiments and then used in subsequent analyses. These quantities, which I call IMCEs, can be estimated without making any assumptions on top of those necessary for the standard conjoint analysis. However, several practical recommendations for the conjoint design ensure that IMCEs can be feasibly estimated. They require the researcher to use interval rating outcomes, minimize the number of randomized values per attribute, and maximize the number of rated profiles per respondent. Also, since the main reason for estimating IMCEs is to use them in subsequent analyses, adjusting for estimates’ uncertainty is necessary. This can be achieved by drawing multiple plausible values of IMCEs from their sampling distributions that, in turn, can be estimated using either the normality assumption or nonparametric bootstrap.
I have demonstrated how the proposed procedure can be used in practice by partially replicating the conjoint study of immigrant admission to the United States—with design adjusted to feasibly estimate IMCEs. I have employed IMCE estimates from this conjoint experiment to explore distributions of preferences, correlations between preference dimensions, and relationships of preferences to other respondent-level variables. I have found that preference distributions are often asymmetric, preferences intercorrelations are generally low, and relative preferences for immigrants without status violation history are greater among Republicans. Overall, the application of IMCEs allows extending previous findings by revealing skewed preferences: demand for educated, English-proficient, and rule-abiding immigrants is not universal, as many respondents do not have reliable preferences with regard to these attributes.
Estimating and using IMCEs from conjoint experiments can also be useful for studying political phenomena other than preferences. An example would be multidimensional stereotypes about politically relevant social categories that researchers have recently started to explore with conjoint analysis (Flores and Schachter Reference Flores and Schachter2018; Goggin, Henderson, and Theodoridis Reference Goggin, Henderson and Theodoridis2020). IMCEs can be applied to study political implications of such stereotypes. For instance, an influential argument connects opposition to government welfare programs among U.S. whites with stereotypes of welfare recipients as African Americans (Gilens Reference Gilens1999). Conjoint experiments can be used to assess prominence of race in stereotypes about welfare recipients, and IMCEs can be employed to estimate the impact of race, relative to other stereotype dimensions, on welfare policy opinions. Since respondents are often hesitant to reveal sensitive stereotypes in standard survey self-reports, the application of conjoint experiments as an individual-level measurement tool might be particularly useful. Altogether, researchers’ ability to obtain estimates for IMCEs and use them in consequent analyses can make conjoint experiments an even more potent and popular tool in political methodology.
Acknowledgement
Earlier versions of this project were presented at the Annual Meeting of the Society for Political Methodology, the Annual Meeting of the American Political Science Association, and the Interdisciplinary Seminar in Social Science Methodology at the University of Michigan. I am grateful to Dan Hopkins, Gary King, Mayya Komisarchik, Walter Mebane, Dan Myers, Kevin Quinn, Yuki Shiraito, Nick Valentino, and Liz Zechmeister as well as four anonymous reviewers and Jeff Gill, the editor of Political Analysis, for their helpful comments. This work was supported in part by the Garth Taylor Fellowship in Public Opinion and Gerald R. Ford Fellowship at the University of Michigan, and by the Humane Studies Fellowship.
Data Availability Statement
Replication code for this article can be found in Zhirkov (Reference Zhirkov2020).
Supplementary Material
For supplementary material accompanying this paper, please visit https://doi.org/10.1017/pan.2021.4.


 Open access