Introduction
Quinoa (Chenopodium quinoa Willd.) is an Andean crop with exceptional nutritional properties and to adapt to very diverse agroecological conditions (Jaikishun et al., Reference Jaikishun, Li, Yang and Song2019). Currently, quinoa has become more important because it is a native species with high agronomic, nutritional and export value (Galindo et al., Reference Galindo, Pont, Saenz-Nebot and Benavente2021), mainly due to the great existing genetic diversity, which is expressed in the different colours of panicles, leaves, grain, plant height, saponin content, panicle type and grain quality (Manjarres et al., Reference Manjarres, Morillo, Ojeda, Cárdenas and Arias2021a, Reference Manjarres, Arias, Morillo, Ojeda and Cárdenas2021b; Melini and Melini, Reference Melini and Melini2021). Due to the great adaptability of quinoa to various environments as well as its dietary benefits, this crop has expanded its distribution to new growing areas outside its region of origin (Shen et al., Reference Shen, Tang and Li2021). Therefore, in more than 70 countries around the world, quinoa germplasm has been evaluated through the application of modern improvement techniques in the search for cultivars with higher yields and adaptation to adverse environmental conditions (Iftikhar et al., Reference Iftikhar, Abbas, Saqib, Shabbir, Amjad, Shahid, Ahmad, Iqbal and Ahmad2021; Manjarres et al., Reference Manjarres, Arias, Morillo, Ojeda and Cárdenas2021b).
Colombia has a wide biodiversity which must be conserved and used sustainably, since there is currently an increase in the loss of biological diversity. In addition to its economic, social and cultural importance, quinoa is preserved and used for agronomic research purposes with a view to obtaining new varieties (García et al., Reference García, Zurita, Stechauner, Roa and Jacobsen2020) which is of great importance the characterization of its germplasm for the knowledge of its genetic diversity and its appropriate use. In order to know its germplasm, characterizations and evaluations of quinoa collections, complementary methodologies based on morphological, biochemical and molecular markers have been carried out. Genetic diversity is crucial in plant breeding programmes to improve agronomic traits and facilitate the global expansion of quinoa (El-Harty et al., Reference El-Harty, Ghazy, Alateeq, Al-Faifi, Khan, Afzal, Alghamdi and Migdadi2021).
Molecular techniques have been relevant for the study of plant genomes, offering higher levels of reliability when compared to those that are only limited to studying morphological, anatomical or ecophysiological characteristics (Platten et al., Reference Platten, Cobb and Zantua2019). Zhang et al. (Reference Zhang, Gu, Liu, Lv, Zhou, Lu, Liang, Bao and Zhao2017) reported that breeding to improve quinoa was restricted because of a lack of genetics and genomic information about the crop. They suggested that the knowledge of the plant's genomic variation, population structure and genetic diversity is necessary. Several studies have classified quinoa genotypes using molecular markers technologies (Salazar et al., Reference Salazar, De Lourdes Torres, Gutierrez and Torres2019; Wang et al., Reference Wang, Wu, Zou, Zhang, Wang, Chang, Song and Nie2019; El-Harty et al., Reference El-Harty, Ghazy, Alateeq, Al-Faifi, Khan, Afzal, Alghamdi and Migdadi2021; Laosatit et al., Reference Laosatit, Taytragool, Pimsaythong, Somta and Tanadul2021). Inter-simple sequence repeat (ISSR) markers are simpler to use than simple sequence repeat (SSR) markers, which are frequently used for genotyping quinoa. ISSR markers are inexpensive and are easily scored manually, and prior knowledge of the target sequences flanking the repeat regions is not necessary, which is not true for SSR markers (Morillo et al., Reference Morillo, Manjarres and Morillo2017; Saad-Allah and Youssef, Reference Saad-Allah and Youssef2018).
In Colombia, studies of genetic diversity in quinoa are scarce (Morillo et al., Reference Morillo, Manjarres and Morillo2017, Reference Morillo, Manjarres, Reyes and Morillo2020a, Reference Morillo, Manjarres, Reyes and Morillo2020b; García et al., Reference García, Zurita, Stechauner, Roa and Jacobsen2020), suggests that Colombian genotypes have high genetic variability at the intraspecific level (Morillo et al., Reference Morillo, Manjarres, Reyes and Morillo2020b). Furthermore, the morphological characterizations in Colombian germplasm also suggest a wide phenotypic variation (Manjarres et al., Reference Manjarres, Arias, Morillo, Ojeda and Cárdenas2021b). However, no selection processes have been carried out within formal improvement programmes that lead to the release of varieties, so it is the farmers themselves who select their seed cycle after production cycle.
The lack of characterization and evaluation studies could limit selection and improvement as well as cultivation of expansion of quinoa (Saad-Allah and Youssef, Reference Saad-Allah and Youssef2018). The genetic diversity of Colombian quinoa could be an important tool in the search for unique adaptive, production, quality and resistance characteristics for breeding programmes that seek to explore the genetic background of this species (García et al., Reference García, Zurita, Stechauner, Roa and Jacobsen2020). The objective of this study was to evaluate the genetic diversity of Colombian quinoa from Cundinamarca department, to establish strategies in breeding and conservation programmes that can lead to more efficient selection processes and identify genotypes with agronomic, industrial or pharmaceutical characteristics.
Materials and methods
Vegetal material
We evaluated 36 genotypes of C. quinoa belonging to the genetics materials: Tunkahuan, Aurora, Blanca de Jericó and Blanca Subachoque, come from the department of Cundinamarca, Colombia, Vereda Santa Rosa, Subachoque located at 4°17′51.5″ latitude and 74°27′77″ longitude.
DNA extraction and quality check
The molecular characterization was carried out in the Laboritorio de investigaciones en Biología Molecular at the Universidad Pedagógica y Tecnológica de Colombia, in Tunja at 2.820 msnm with an average temperature of 13°C. The five genetic materials were germinated under greenhouse conditions in Tunja, Boyacá where a total of 36 genotypes were selected according to the morphological differences observed and the colour of the corresponding oxalates (Table 1).
Table 1. Genotypes of Chenopodium quinoa W. used for molecular characterization with ISSR markers

The DNA extraction was done with the protocol of Dellaporta et al. (Reference Dellaporta, Wood and Hicks1983), as modified by Muñoz et al. (Reference Muñoz, Morillo and Morillo2008). The total DNA was visualized on 0.8% agarose gels in a Maxicell Primo EC-340 electrophoresis chamber. The concentration was determined with spectrophotometry in a Biotek EPOCH2 device; subsequently, the dilution was carried out using HPLC water for a total volume of 100 μl to 10 ng/μl, stored at −20°C.
ISSR amplification
A total of 8 ISSR primers synthesized by Technologies Inc. Bioneer Corporation (Alameda, California, USA) were used: CCA (DDB(CCA)5; CGA (DHB(CGA)5); ACA (BDB(ACA)5); GT (VHV(GT)5G; AG (VHV(AG)5G; CT (DYD(CT)7C); TG (DYD(TG)7C); CA (DBDA(CA)7. The designations are used for the degenerative site: H (A or T or C); B (G or T or C); V (G or A or C) and D (G or A or T). The ISSRs were selected from a data base of ISSRs applied in previous studies based on their high polymorphic content and broad coverage of the quinoa genome (Al-Naggar et al., Reference Al-Naggar, El-Salam, Badran and El-Moghazi2017; Morillo et al., Reference Morillo, Manjarres and Morillo2017; Saad-Allah and Youssef, Reference Saad-Allah and Youssef2018). The PCR reactions were performed with 1X buffer, 1.5 mM Mgcl2, 0.2 mM dNTPs, 1 U Taq Polymerase, 2 μM primer and 10 ng genomic DNA for a final volume of 25 μl. The PCR cycles consisted of an initial denaturation at 95°C for 5 min, followed by 37 cycles at 95°C for 30 s, annealing temperature 58°C (GT), 50°C (AG, CA, ACA), and 55°C (CCA, TG, CT, CGA) for 45 s, extension at 72°C for 2 min, and a final extension at 72°C for 7 min. The DNA fragments were separated on 2% agarose gel run at 100 volts for 3 h using 0.5% TBE, and stained with 0.5 μg/ml Gel red dye loading buffer then visualized under transilluminator.
Genetic diversity analysis
Amplified products were scored as present (1) or absent (0) to construct a binary matrix. Genetic similarity (GS) was estimated for all genotype pairs using the equation (Nei and Li, Reference Nei and Li1979):

where GSij represents the similarity estimated between the genotypes i and j, based on the ISSR data, Nij is the total number of bands common to i and j, and Ni and Nj correspond to the number of bands found in genotypes i and j. The matrix generated with GS estimates was used to cluster the genotypes in a dendrogram obtained by the unweighted pair group with arithmetic mean (UPGMA) using Numerical Taxonomy System for Personal Computer NTSYS statistical software (version 2.02 PC, Setauket, New York, USA). Cophenetic correlation coefficient between similarity matrix and dendrogram cophenetic values was estimated to validate the dendrogram in relation to the original similarity estimates and the binary data matrix analysed using COPH and MXCOMP programs in NTSYS-pc.
Genetic diversity parameters such as the percentage of polymorphic loci, unbiased heterozygosity and coefficient of genetic differentiation (Fst) with a 95% confidence interval, were estimated with the TFPGA program (Tools For Population Genetic Analysis, version 1.3, 1997).
The genetic structure analysis was done based on Bayesian model (Hubisz et al., Reference Hubisz, Falush, Stephens and Pritchard2009) as implemented in the STRUCTURE program version 2.3.4. The number runs for K values ranging from 1 to 8 were executed with a burn-in length of 100,000 tailed by 1,000,000 Monte Carlo Markov Chain (MCMC) interactions using admixture model. The number of subpopulations was determined using the Delta K (ΔK) ad hoc method proposed by (Evanno et al., Reference Evanno, Regnaut and Goudet2005) and implemented in the online tool Structure Harvester (Earl and VonHoldt, Reference Earl and VonHoldt2012) to estimate the most likely K in each set of passion fruit accessions. Finally, an analysis of molecular variance (AMOVA) was computed using GenAlEx 6.5 program (Peakal, Australian National University, Canberra, Australia) to identify the proportion of variation among and within the groups established according to the population structure analysis.
Results
ISSR polymorphism analysis
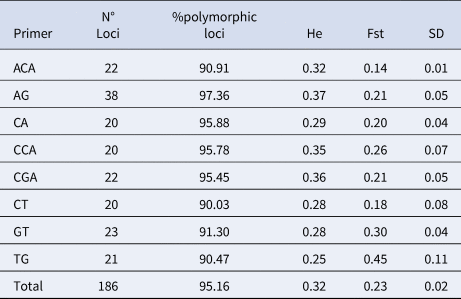
The genetic characterization of 36 quinoa genotypes using eight ISSR primers yield a total 186 bands with an average of 23.25 bands for each primer. The fragment lengths ranged from 110 to 1700 bp. Among the total bands, 177 (95%) were polymorphic (Table 2.). The highest (38) and lowest (20) number of bands were generated by primers AG and CA, CCA, CT, respectively. In the online Supplementary Fig. S1 the amplication pattern generated by the TG primer is displayed (Additionally in online Supplementary Figs S2–S8 the amplification pattern of the other ISSR markers is shown). The TG marker made the greatest contribution to the observed variation with a 0.45 Fst which means it can be useful for the differentiation of genetic materials of genus Chenopodium in intra-interspecific genetic diversity studies (Table 2).
Table 2. Number of loci and percentage of polymorphic loci, estimated average heterozygosity and coefficient of genetic differentiation (Fst) for eight ISSR primers assessed in 36 Chenopodium quinoa W. genotypes from Cundinamarca, Colombia
Genetic diversity
The average estimated heterozygosity value and percentage of polymorphic loci for the total population was 0.32 and 95%, respectively. The coefficient of genetic differentiation (Fst) obtained in evaluating 36 quinoa materials with eight ISSR markers was 0.23 with a standard deviation of 0.02 (Table 2).
Genetic relatedness among Quinoa spp.
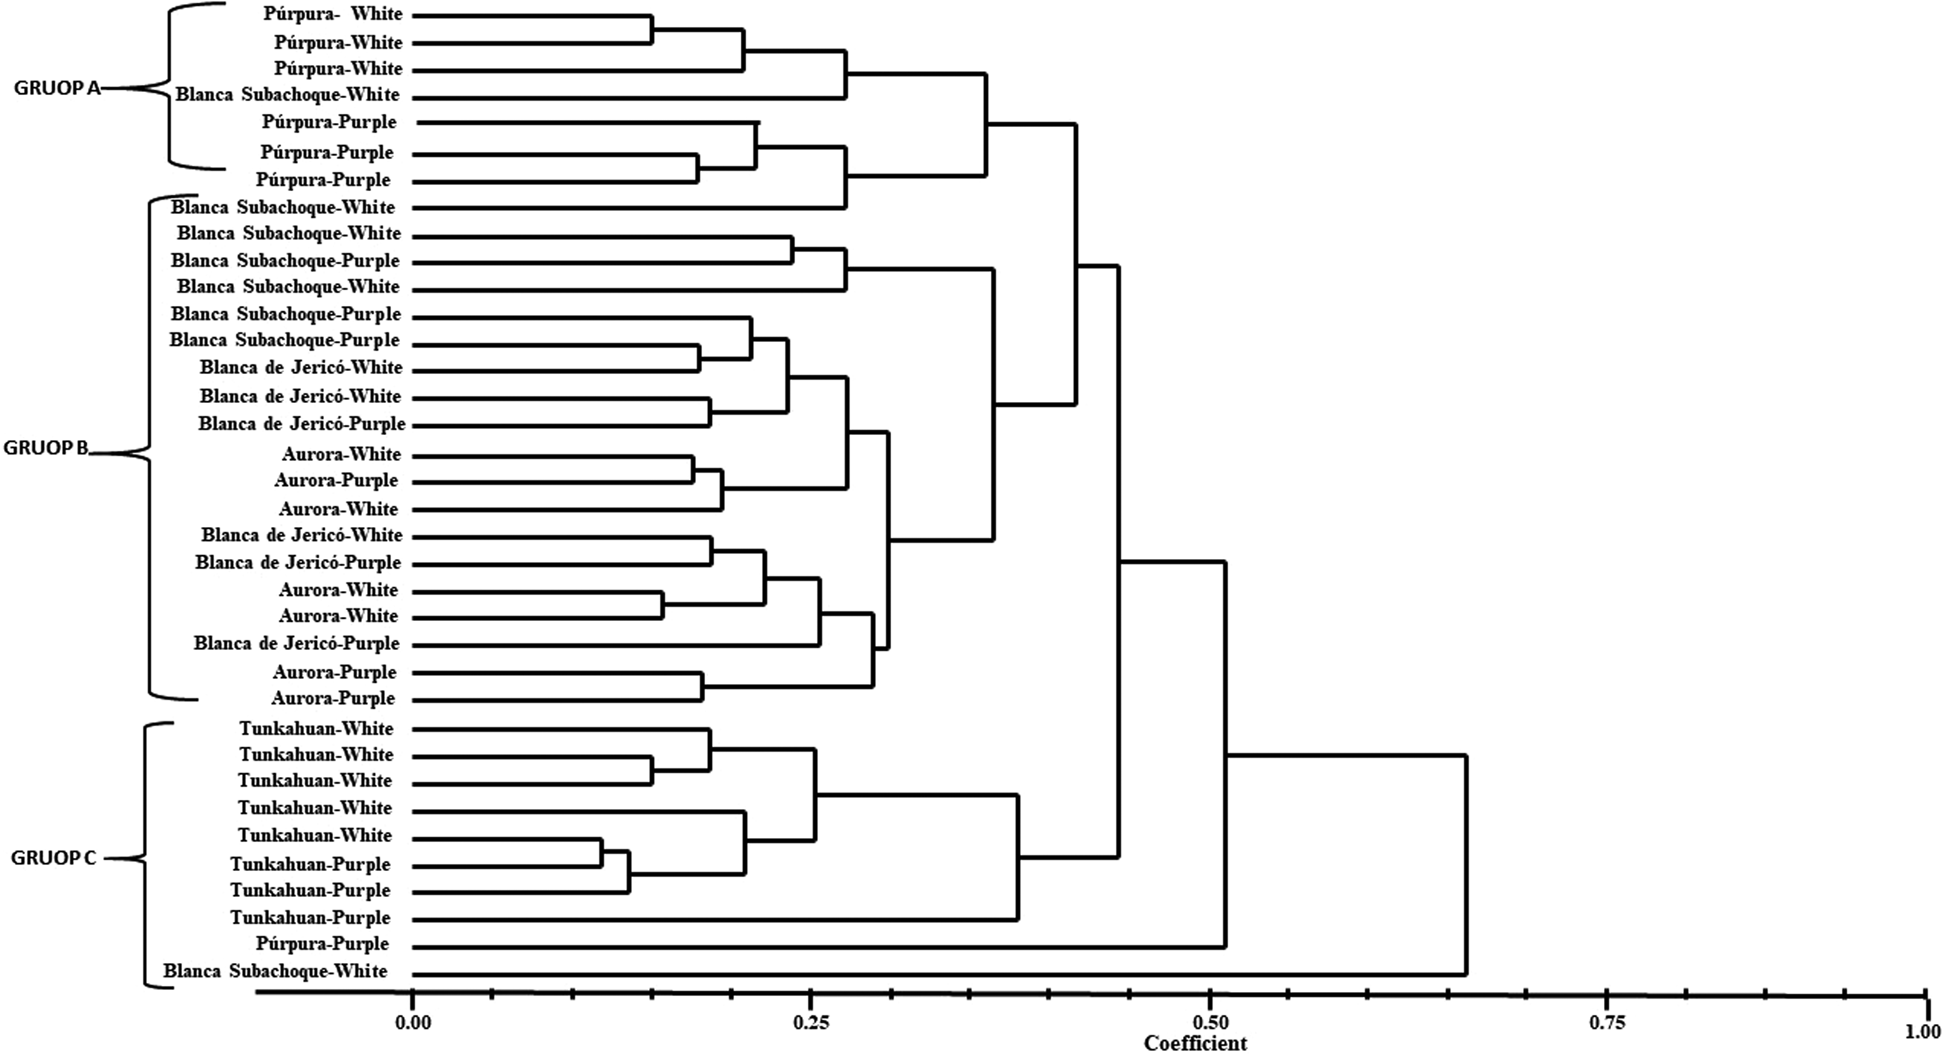
The UPGMA analysis clustered the 36 genotypes into three groups (A, B, C) at a similarity level of 0.40 (Fig. 1). The distinct groups were also supported by a high cophenetic correlation coefficient (r = 0.78). In general, the genotypes try to be clustered by accession, however, some mixtures of individuals of different accession, with different calcium oxalate colours could be evidenced, as well as of different geographical origin, within the groups. All individuals in the same accession were highly homogeneous. Group A, the quinoa accessions presented genetic distances between 0.60 and 0.80. In this group we find a total of eight individuals, most of them belonging to the Purple genetic material with purple and white oxalate colours, in addition, two White Subachoque genetic materials with white oxalates are included. Group B, with 18 genotypes, clusters the majority of genotypes of Blanca Subachoque, Blanca de Jericó and Aurora with white and purple oxalates, being one of the most diverse groups by showing a loose distribution of individuals and the genetic flow between them.

Fig. 1. Dendrogram of quinoa genotypes base on the Nei-Li similarity Coefficient and estimated with eight ISSR markers with UPGMA, SAHN and TREE classification methods of NTSYS-pc, version 1.8 (Exeter Software, NY, USA).
In group C it was observed that it was mainly made up of Tunkahuan individuals with white and purple oxalates. However, it was also possible to show that the Purple and White genotypes from Subachoque with purple and white oxalates respectively were the most diverse and did not make up any group, which may be due to the morphological characteristics of these materials.
The analysis with the Structure program (Pritchard et al., Reference Pritchard, Stephens and Donnelly2000) showed the peak in delta K at K = 3, suggesting the presence of three main populations (Fig. 2(a)). Thus, the quinoa from Cundinamarca, Colombia was structured into 3 genetic groups (G1, G2 and GC) (Fig. 2(b)). These groups were established according to the evaluated genotypes (Púrpura, Blanca Subachoque, Blanca de Jericó, Aurora and Tunkahuan) and the colour of their oxalates (White and purple). Although a mixture of different genetic individuals was also evidenced in the groups, which corroborates the results found in the UPGMA analysis. This showed that the genetic diversity of quinoa germplasm does not have a specific geographic pattern and that there are other evolutionary forces that govern its diversity (Fig. 3).
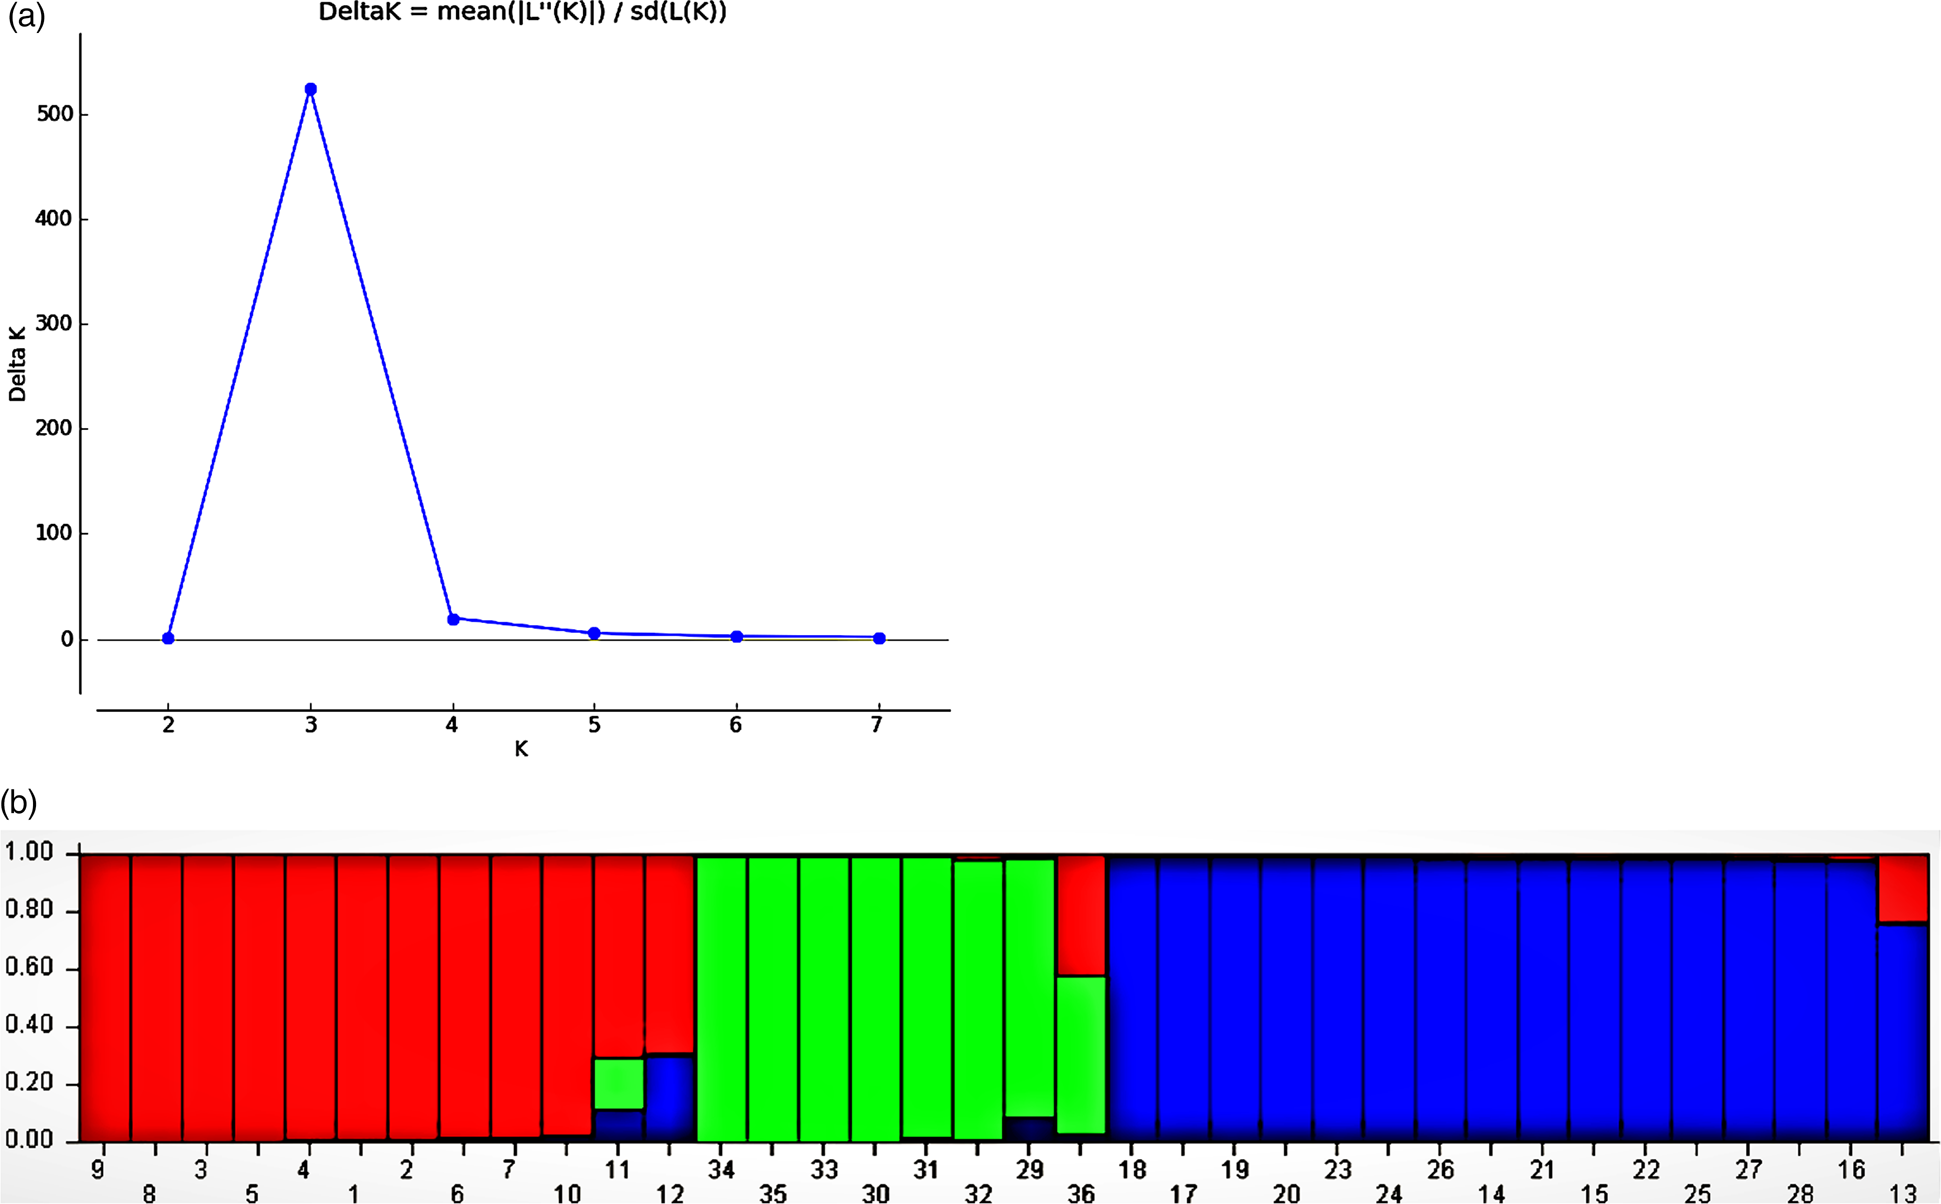
Fig. 2. (a) Population structure of 36 genotypes, Evanno's method with an optimal model of K = 3. (b) Grouping of Cundinamarca quinoa genotypes (Groups A, B and C). Each vertical bar represents an individual sample, and the colour of the bar indicates the probability that an individual will be assigned to one of the identified groups.
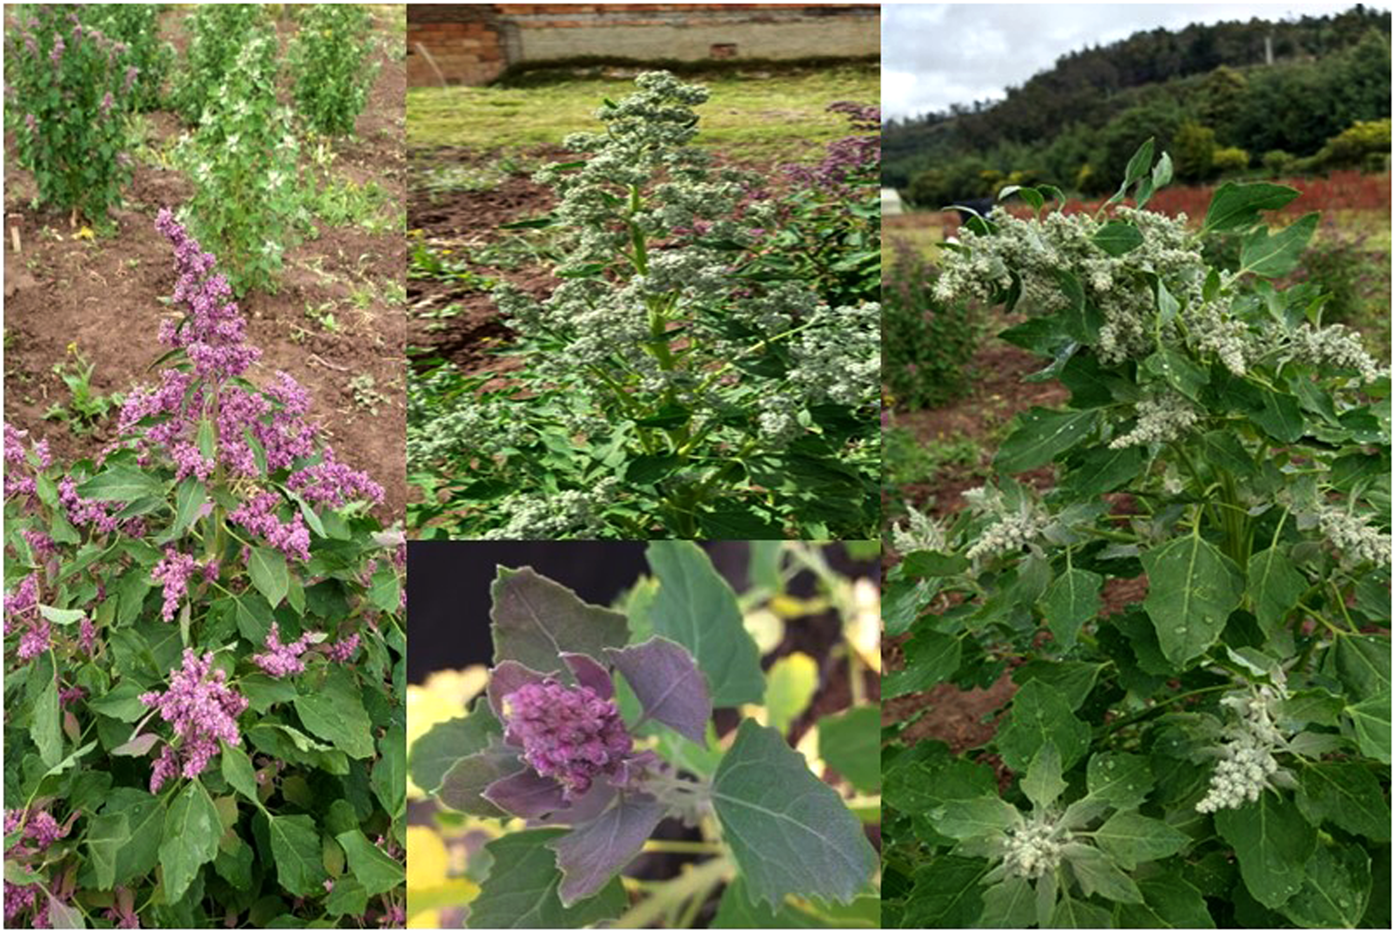
Fig. 3. Phenotypic diversity of the quinoa panicle observed in the field.
The molecular variance analysis AMOVA showed that the genetic variation observed in the evaluated quinoa genotypes was mainly within groups, with 77% (Table 3). The remaining 23% was due to the component of genetic variance between the groups, which was significant (PhipT = 0.23, P ≤ 0.001).
Table 3. Analysis of molecular variance (AMOVA) among and within populations using eight ISSR markers

df, Degree of freedom.
* Significance test after 1000 permutations.
Discussion
ISSR polymorphism analysis
The ISSR markers used to characterize the genetic diversity of C. quinoa genotypes from department of Cundinamarca, Colombia yielded a total of 186 loci with approximately 95% polymorphism (Table 2). The number of bands and the percentages of polymorphism found in this study are suitable for estimated genetic parameters when compared with others research in quinoa that used ISSR markers (Al-Naggar et al., Reference Al-Naggar, El-Salam, Badran and El-Moghazi2017; Morillo et al., Reference Morillo, Manjarres and Morillo2017; Saad-Allah and Youssef, Reference Saad-Allah and Youssef2018). Heterozygosity values ranged between 0.25 (TG) and 0.37 (AG). Ott (Reference Ott1992), considers a molecular marker as polymorphic if the value of H is greater than or equal to 1.0 and highly polymorphic if it is equal to or greater than 0.7, therefore the ISSR evaluated in this study are polymorphic and can be used in the evaluation of the genetic diversity at the inter and intra specific level in different germplasm in quinoa (Al-Naggar et al., Reference Al-Naggar, El-Salam, Badran and El-Moghazi2017; Morillo et al., Reference Morillo, Manjarres and Morillo2017; Laosatit et al., Reference Laosatit, Taytragool, Pimsaythong, Somta and Tanadul2021). Microsatellite markers (SSR) had been used efficiently in genetic characterization within quinoa germplasm from Ecuador, Colombia, Peru, Bolivia, Chile and Argentina (Romero et al., Reference Romero, Mujica, Pineda, Ccamapaza and Zavalla2019; Salazar et al., Reference Salazar, De Lourdes Torres, Gutierrez and Torres2019; Morillo et al., Reference Morillo, Manjarres, Reyes and Morillo2020a).
Genetic diversity
The values of the average heterozygosity and the percentage of polymorphic loci show the existence of genetic diversity in the evaluated quinoa germplasm. The genetic differentiation coefficient (Fst = 0.23) (Table 2), according to Wright (Reference Wright1978), shows genetic differentiation, which is associated with the level of structuring of materials, which tends to stabilize as selection processes progress, since these materials are currently undergoing a selection process by farmers.
Our results with respect to the ISSR markers revealed moderate genetic variability among the studied genotypes. This finding is in accordance with the results of Saad-Allah and Youssef (Reference Saad-Allah and Youssef2018), and this level of genetic variability could be attributed to the reproduction processes of the species and seed exchange between farmers.
With these molecular tools it has been possible to identify genome-level differences and similarities that are associated with morphological characteristics such as grain and panicle colour, phenology and geographic distribution (Schmockel et al., Reference Schmockel, Lightfoot, Razali, Tester and Jarvis2017). On the contrary, the genetic diversity parameters found in this study show that the quinoa materials from Cundinamarca are very homogeneous, which corroborates the results obtained in the dendrogram and in the estimation of genetic distances; these results coincide with the research carried out by the quinoa genetic improvement programme in Chile (Fuentes et al., Reference Fuentes, Bazile, Bhargava and Martinez2012) and the studies by Romero et al. (Reference Romero, Mujica, Pineda, Ccamapaza and Zavalla2019) in the characterization of 29 accessions of the national collection of Peru using microsatellite markers, which allows theoretically inferring that there is a deficit of heterozygotes in the population and therefore, a greater number of homozygous individuals due to the high percentages of sel-fertilization.
In studies of characterization of genetic diversity in Chenopodium, with dominant and/or codominant molecular markers, high percentages of polymorphic loci and high values of heterozygosity have been obtained, which could be attributed to allotetraploid, to the self-pollination/cross-pollination mating system, ginomonoecia, self-incompatibility and male sterility (Yasui et al., Reference Yasui, Hirakawa, Oikawa, Toyoshima, Matsuzaki, Ueno, Mizuno, Nagatoshi, Imamura, Miyago, Tanaka, Mise, Tanaka, Mizukoshi, Mori and Fujita2016; Schepers et al., Reference Schepers, Pavese, Buerstmayr and Dohm2021) to the exchange of constant genetic information at the intra or interspecific level with wild and ancestral relatives (Morillo et al., Reference Morillo, Manjarres, Reyes and Morillo2020a). In this study, the quinoa materials evaluated come from the department of Cundinamarca and are the product of a selection process carried out by a producer interested in improving production, for which the phenotypic and genotypic characteristics are already more stable and the population more homogeneous, but different morphotypes can still be observed.
Genetic relatedness among quinoa spp
The genetic relationships among the 32 quinoa genotypes were assessed using data generated from ISSR markers. Based on Nei-Li similarity coefficients, the pairwise correlations were used to generate the dendrogram using (UPGMA) Unweighted Pair-Group Method with Arithmetic means due to higher cophenetic correlation coefficient (Fig. 1). The clusters were mainly made up of the genetic material evaluated and the colour of the oxalates (Fig. 3) that appear on the leaves and are responsible for helping to regulate the movement of the stomata, thus making the quinoa materials more tolerant to drought conditions, this could be because of its origin, as it has crossed or had variations induced by mutations and selection for several years (Saad-Allah and Youssef, Reference Saad-Allah and Youssef2018; García et al., Reference García, Zurita, Stechauner, Roa and Jacobsen2020). In other genetic diversity studies, the groupings of the evaluated germplasm have been given mainly by species, geographical origin or by ecotypes.
The grouping of the genotypes shows a loose distribution, no defined association pattern, which can be explained by the coevolutionary processes of the species with the environment, the reproduction system or the constant exchange of seed between the same producers (Manjarres et al., Reference Manjarres, Morillo, Ojeda, Cárdenas and Arias2021a).
This result could be explained by environmental and genotype-environment interactions that influence the phenotypic characters (Manjarres et al., Reference Manjarres, Morillo, Ojeda, Cárdenas and Arias2021a), Fuentes et al. (Reference Fuentes, Bazile, Bhargava and Martinez2012) reported that ecological constraints had increased quinoa diversity and that cluster analysis discriminated between the central Andes genotypes and southern latitudes genotypes. Bhargava et al. (Reference Bhargava, Shukla and Ohri2007) mentioned that hybridized quinoa genotypes from different clusters with different desirable genes for a specific trait could be facilitated to accumulate favourable genes of the trait in new lines. However, it is crucial to consider inter-cluster distances. The magnitude of hybrid vigour depends on the diversity between the two clusters’ parental and statistical distances (Noulas et al., Reference Noulas, Tziouvalekas, Vlachostergios, Baxevanos, Karyotis and Iliadis2017).
The population structure of the 32 quinoa genotypes was inferred using STRUCTURE 2.3.4 and the peak of delta K was observed at K = 3, suggesting the presence of three main populations (Fig. 2(a)). The classification of genotypes into populations based on the model-based structure from STRUCTURE 2.3.4 is shown in Fig. 2(b) The 36 genotypes were distributed to the main clusters and admixture. The results found in this analysis corroborate those obtained previously, which shows the high genetic homogeneity as well as the mixtures of individuals in different groups since there is still a segregation both at the genetic and phenotypic level of the space-temporal dynamics to which these materials are subjected to in their natural environment. Studies carried out in other Andean countries had already reported low variability in local varieties of quinoa, which was to be expected from the selection processes carried out by breeders (Morillo et al., Reference Morillo, Manjarres and Morillo2017; Romero et al., Reference Romero, Mujica, Pineda, Ccamapaza and Zavalla2019). Thus, genetic diversity decreases after systematic selection processes carried out by farmers or breeders (Noulas et al., Reference Noulas, Tziouvalekas, Vlachostergios, Baxevanos, Karyotis and Iliadis2017). Quinoa genotypes are grouped according to background these clustering patterns will be used in future research, including conservation, molecular assist breeding and phytochemical and physiological studies (Saad-Allah and Youssef, Reference Saad-Allah and Youssef2018; Shen et al., Reference Shen, Tang and Li2021).
The AMOVA showed that most of the genetic variation was according to differences within populations 77% (Table 3). This high variation could indicate the presence of higher levels of subdivision and hierarchy. The remaining 23% was due to the component of genetic variance between the groups, which was significant (PhipT = 0.23, P < 0.001); such genetic variation between groups might be used for conservation and breeding of this species. Similar results have been reported in other studies of genetic diversity in the genus Chenopodium using microsatellite markers (Romero et al., Reference Romero, Mujica, Pineda, Ccamapaza and Zavalla2019; Morillo et al., Reference Morillo, Manjarres, Reyes and Morillo2020b; El-Harty et al., Reference El-Harty, Ghazy, Alateeq, Al-Faifi, Khan, Afzal, Alghamdi and Migdadi2021).
The results obtained in this study show the potential that the ISSR markers have to discriminate genotypes and that there is genetic variation in the evaluated materials that require more efficient selection processes to obtain pure materials or varieties, the ultimate objective of genetic improvement programmes. The use of molecular markers can increase the efficiency of conventional plant breeding by identifying markers associated with the quantitatively inherited traits controlled by several generic loci and their genetic components are difficult to measure (Shahrajabian et al., Reference Shahrajabian, Sun and Cheng2021).
Conclusions
The ISSR markers allowed determining the variability existing genetics in quinoa materials evaluated by grouping them according to their genetic background.
The genetic diversity parameters found in this study show that the quinoa materials from Cundinamarca are very homogeneous, which corroborates the results obtained in the dendrogram and in the estimation of genetic distances and coincides with studies carried out by the Chilean breeding programmes and Peruvians, given the selection processes to which these materials are subjected in their natural environment.
Supplementary material
The supplementary material for this article can be found at https://doi.org/10.1017/S1479262123000060.
Acknowledgements
To the ‘Universidad Pedagógica y Tecnológica de Colombia, Vicerrectoría de Investigación y Extensión, Grupo de Investigación Competitividad, Innovación y Desarrollo Empresarial (CIDE)’ SGI 3107”.
Authors contributions
AMC collected basic data, organized data and wrote manuscripts. EHM performed the data analyses and wrote manuscript. MCBP contributed to the dataset integration and database construction.
Conflict of interest
There are no conflicts of interest to declare.