


Introduction
May (Reference May1988) asked how many species there are on Earth today and, not surprisingly, showed that we know more of some groups of organisms than of others. The question of how many species have ever existed on Earth is even more challenging (Simpson Reference Simpson1952). While incompleteness of the fossil record is an everlasting concern (Darwin Reference Darwin1872: chap. 10; Foote and Sepkoski Reference Foote and Sepkoski1999; Benton Reference Benton2009), over the years more and more fossil species have become known to research.
Attempts to assess completeness of the fossil record quantitatively have a long history. In the 1950s–1960s, the prevailing opinion was that we know a very small proportion of the fossil species. The species-level completeness of the fossil record was estimated to be up to 10% or likely less (Newell Reference Newell1959; Durham Reference Durham1967; Valentine Reference Valentine1970). Those estimates were primarily based on the marine record, but terrestrial vertebrates and plants have also been considered.
The perception of completeness shifted in the 1990s with development of more advanced analytical methods, such as Foote and Raup's FreqRat (Reference Foote and Raup1996), based on the distribution of taxonomic durations within fossil assemblages. Their initial estimates of species-level completeness of the fossil record of trilobites, bivalves or American Cenozoic mammals ranged from 60% to 90%. In the following years, researchers applied this approach to various regions and organismic groups (Alba et al. Reference Alba, Agusti and Moya-Sola2001; Johnson and Curry Reference Johnson and Curry2001; Sims Reference Sims2012; Davies et al. Reference Davies, Bell, Goswami and Halliday2017) and generally, except when applying it globally for bats (Eiting and Gunnell Reference Eiting and Gunnell2009), obtained similar results, suggesting relatively high or very high completeness of the record.
Although statistical approaches on taxonomic durations have been applied continentally, they are primarily local approaches, in that they require well-sampled fossil assemblages that would include multiple taxa repeatedly found within multiple stratigraphic horizons. This means that such approaches can realistically only be applied to some subsets of the global fossil record, those that allow intensive sampling possibilities. Naturally, estimates over such subsets show high completeness, but that does not reflect completeness of the global fossil record as a whole, as already noted by Foote and Raup (Reference Foote and Raup1996).
Thus, even though recent regional estimates or estimates at individual sites suggest quite high completeness, we still do not know how much of the fossil record we know globally, and, even more importantly, how evenly this knowledge extends across groups of organisms. Here we revisit the question of global completeness of the mammalian fossil record, placing it in the perspective of present-day biodiversity.
One can argue that even if all the biodiversity of today were to be preserved in the fossil record, not all the species would be detectable. This is because of cryptic species, which morphologically look identical, but do not interbreed and remain genetically separate. Also, if some species differ only by traits that are not preserved, they will not be distinguishable in the fossil record, which can make the fossil record appear less complete than it really is. At the same time, sexually dimorphic members of the same species can be described in the fossil record as separate species, which can make the fossil record appear spuriously more complete. These are questions of detectability.
The question we ask here is what fraction of species that lived during the Miocene are captured in the fossil record, not what fraction of species that lived and are detectable are captured in the fossil record. Thus, our purpose is not to assess the efforts of the research community (how much of those that are detectable have actually been found), but to address a more fundamental question—how much of the history of life we know from the fossil record.
Completeness of the Mammalian Fossil Record
Consider the Miocene, a time when many of the present mammalian families were already established. The planetary cooling and associated major ecosystem changes of the later Miocene (ca. 15–5 Ma), including the expansion of grassland biomes and the evolution of faunas adapted to open environments, have been a subject of intensive research in paleoecology and human evolution (Begun Reference Begun2010; Raia et al. Reference Raia, Carotenuto, Eronen and Fortelius2011; Stromberg Reference Stromberg2011; Fortelius et al. Reference Fortelius, Eronen, Kaya, Tang, Raia and Puolamaki2014). As a result of the great interest in this major ecosystem transition, the existing mammalian fossil record of the Miocene has arguably been resolved and scrutinized nearly as well as is practically possible.
To make use of this exceptional opportunity for the present purpose, we first need a baseline of how many fossil mammal species could be expected to have existed within the Miocene. If we know the standing diversity of species and the average species duration, we can compute how many faunal replacements would have happened over the time elapsed, and from there, how many species must have lived during the time period in total. This approach was used by Simpson (Reference Simpson1952) to estimate the total number of fossil species that ever lived.
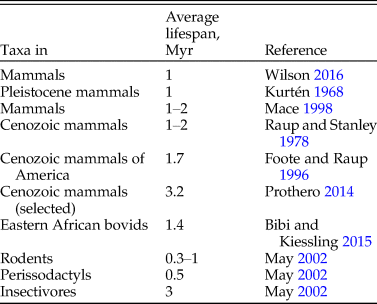
The ASM Mammal Diversity DatabaseFootnote * reports 6363 living mammal species, excluding domestic (19) and recently extinct species (101). Considering that the duration of mammalian species, while varying from group to group (Table 1), is about 1 Myr (May Reference May2002), about 18 faunal replacements would have happened during the nearly 18 Myr of the Miocene. The starting fauna could also potentially have made it into the fossil record; thus, if the standing diversity stayed constant from the beginning of the Miocene to the present day, we should expect a complete mammalian fossil record of the Miocene to contain roughly 19 timesFootnote † more species than the standing diversity today.
Table 1. Estimated durations of mammalian species.
In this case, 19 × 6363 ~ 121,000 fossil species are to be expected in the Miocene record for it to be considered complete or nearly complete. We can check how this rough baseline compares with the mammalian fossil record known to research. The NOW database of fossil mammalsFootnote ‡ reports 4505 mammal species for the Miocene (23.000–5.333 MaFootnote §) worldwide, excluding taxonomic names not identified to the species level. Similarly, the Paleobiology database PBDBFootnote ¶ reports 3811 mammal species for the Miocene, also excluding taxonomic names not identified to the species level.Footnote * There are 1787 species names in PBDB that are not in NOW for the Miocene. Based on a manual survey of a selected sample, quite a few of those names, such as Bos taurus or Mammuthus meridionalis, for example, are Pleistocene species, leaking over to the Miocene in PBDB because of very broad age ranges for some reported localities. Another set of those non-overlapping names are synonyms. Merging the two database lists for this analysis without manual curation would carry a high risk of many duplicated species, and manual curation of a merger is simply intractable for the purpose of this analysis. Some species from the non-overlapping list may be genuinely missing in NOW, but as is, NOW has given primary attention to resolving synonyms over the years, and, while ever incomplete, for the purpose of this analysis it appears to be a fairer representation of the whole Miocene mammalian record than PBDB or a merger of the two. Thus, we analyze NOW data as is in this study. As we know about 4500 fossil species from the Miocene, and the baseline from the present day suggests that there should have been about 121,000 species during that period, the mammalian fossil record for the Miocene as we know it from NOW may only contain about 4500/121,000 = 4% of all the species that existed during that epoch.
More formally, we can compute the completeness of the fossil record as:
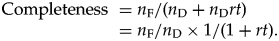
 $${\rm Completeness\ } = n_{\rm F}/n_{\rm D} \times d/( {d + t} ) , \;$$
where n F is the number of fossil species recorded in the fossil record, n D is the standing diversity, d is the average species duration (in millions of years), and t is time elapsed in (millions of years). Details of this formulation are given in Appendix A.1.
Whether the two main assumptions, a constant diversity over the later Cenozoic and average species duration of 1 Myr, are realistic is a matter of broad perspective. Possibly they are the best approximation we can currently achieve without directly using the very same fossil record whose completeness we are trying to assess.
Critically looking at Table 1, assuming that the expected species duration is around 1 Myr is perhaps the best we can do for the main scenario, in addition to sensitivity analysis. Figure 1A outlines how the estimate of completeness would vary under different species durations (keeping the standing diversity fixed for now).
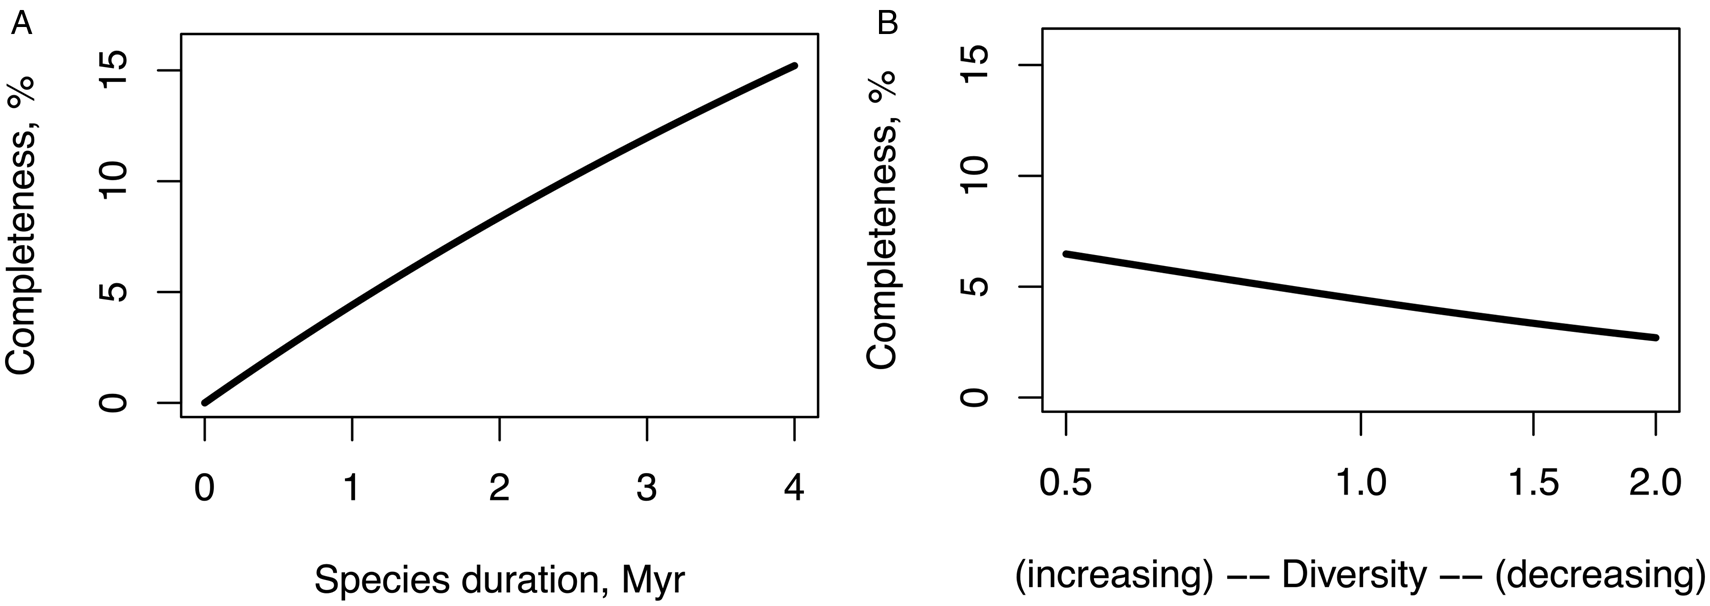
Figure 1. (A) Completeness estimates under different assumptions of expected species duration and standing diversity. (B) The diversity factor in the plot indicates what fraction of the present-day diversity is assumed at the beginning of the Miocene; e.g., 0.5 on the x axis means that the diversity at the start of the Miocene was half of the diversity today and has been linearly increasing since, and 2.0 means that it was twice of the diversity today and has been decreasing since.
If instead of assuming 1 Myr species duration, we increased it to 3 Myr, which is near the maximum estimate in Table 1, the completeness estimate would rise from 4% to around 10%. If, for the purpose of an exercise, we assumed that species duration was half a million years, close to the minimum in Table 1, the completeness estimate would fall to around 2%.
Similarly, Figure 1B shows sensitivity of the completeness estimate to the assumption about standing diversity. If instead of assuming a constant standing diversity, we assumed that the diversity has doubled during the last 23 Myr (while keeping the expected species duration at 1 million), the completeness estimate of the record would rise from 4% to 6%, and if we assumed that the diversity decreased by half during the Miocene, the completeness estimate would fall to 2%.
We made one additional and important assumption—we excluded from the main analysis those occurrences that were not identified to the species level. It is unrealistic that each or even any substantial part of unidentified species would be new, and even if it were so, the fact that the remains have not been identified to the species level signals that they were probably inadequate in some way, and thus the species, if indeed new, would not be adequately known to research anyway. Out of those excluded as unidentified, 742 are unnamed or informal species (indicated as variants of “sp” in NOW), which may eventually be recognized as new species. If all of them were recognized as new species, the completeness estimate would go up by about only 1%.
While completeness estimates vary under different assumptions, these sensitivity analyses suggest that the variations here explored are immaterial within realistic ranges. No matter how we look at this from various angles and with different assumptions, the estimates suggest that the global mammalian fossil record must still be quite incomplete.
Who Is Missing?
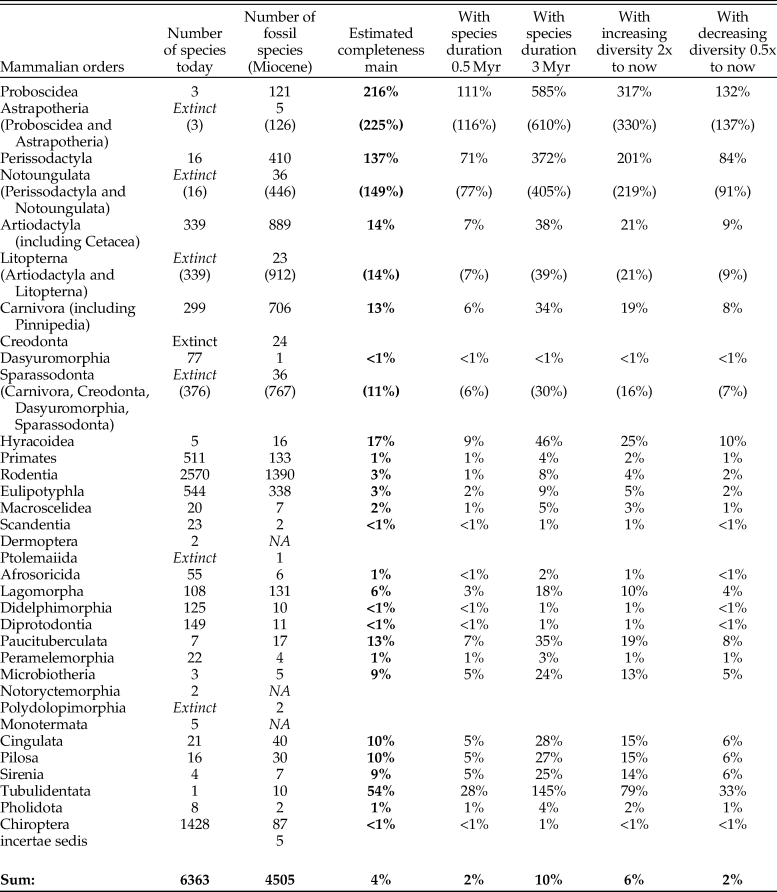
Could it be that the fossil record is missing some groups more than others? For example, small mammals? Or carnivores? Table 2 contrasts extant species counts by orders along with species counts from the Miocene fossil record in the NOW database. Coarsely assuming that the relative structure of ecosystems globally by taxonomic orders stays the same,Footnote * the average species duration is 1 Myr, and the standing diversity stays constant over the Miocene, the last column of Table 2 gives estimates of completeness of the fossil record within each taxonomic group. We see from the table that while estimates vary considerably across groups, one general finding is that the record of small mammals appears to be less complete than that of large mammals. And if the duration of some groups of small mammals is indeed shorter than 1 Myr, as Table 1 suggests for rodents, the actual completeness of their record would be about half of what our main scenario estimates.
Table 2. Number of species within orders today and in the Miocene fossil record (NOW database), as well as estimated completeness of the record. Completeness of the record is computed assuming that the proportions of orders and the diversity of mammalian species stay the same over the last 23 Myr and the duration of all mammalian species is 1 Myr. Italic gray type in brackets indicates interim sums. “Extinct” and “NA” in italics indicate the groups that are not available in that time unit. Bold indicates the main result.
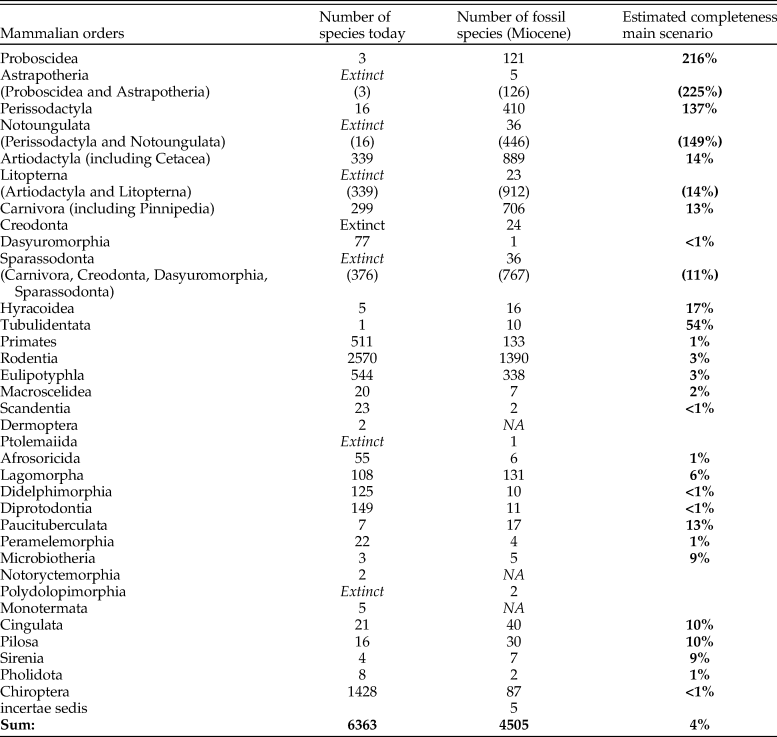
Even within large mammals contrasts are large. The estimates for Perissodactyla and Proboscidea imply that the record for these groups as we know it must be close to complete. That the estimates run over 100% is very likely, because the present-day diversity of those groups is dramatically lower than it should be in natural ecosystems, owing to both long-term decline and recent megafaunal extinctions. It is, for example, commonly thought (Janis Reference Janis1993) that artiodactyls have gradually replaced perissodactyls over the course of the Cenozoic and that the diversity of proboscideans has greatly declined in the geologically recent past. If we, fully speculatively and ignoring variations in the primary productivity, assumed that the recent extinctions of proboscideans have not happened, the standing diversity of proboscideans would be about 18–20 species including dwarf species on islands, or about 14–15 species if island dwarfs were excluded.Footnote * The former would give a 32% completeness estimate for proboscideans. If such perceptions were to be correct and held for perissodactyls as well, the true completeness of the ungulate orders would be more even, somewhat above the 15% obtained for artiodactyls and carnivores. Even with this speculative reasoning, the estimate for ungulates of around 20% would be much higher than the average estimate of 4% for all mammals.
Of all the large mammalian orders, the intensely studied primates appear to be most underrepresented, with a completeness estimate around 1%. If we were to reduce present-day primate diversity to what can be distinguished based on craniodental anatomy, this estimate would of course be higher, but it nonetheless appears that this intensely studied order is relatively poorly represented in the fossil record, notably below the average across all mammals.
Appendix A.2 gives complementary estimates by taxonomic groups with assumptions of shorter and longer average species durations, as well as increasing and decreasing standing diversity over time. The resulting estimates vary to an extent (from half to double as compared with the main scenario) but the main conclusion about structurally varying incompleteness firmly stands.
Are We Looking under a Streetlamp?
Our analysis suggests that the global completeness is low and much more in accord with the earlier estimates for the global record to be below 10% (Newell Reference Newell1959; Durham Reference Durham1967; Valentine Reference Valentine1970) than more recent regional estimates for mammals of around 60%–90% (Foote and Raup Reference Foote and Raup1996; Alba et al. Reference Alba, Agusti and Moya-Sola2001). Individual regions may well represent the completeness of local fossil communities, but this does not necessarily generalize to global completeness, as some communities may be far less represented than others.
One may wonder why local completeness is expected to be greater than global. The first, trivial reason is self-selection bias due to methodological constraints. Advanced statistical approaches require good samples. Foote and Raup's FreqRat (Reference Foote and Raup1996) needs at last four fossiliferous horizons and at least some fossils should be preserved in at least three horizons. In environments like tropical rain forests, where long-term preservation is inherently unlikely (Behrensmeyer at al. Reference Behrensmeyer, Kidwell and Gastaldo2000), although not impossible (Archer et al. Reference Archer, Hand and Godthelp1991), the likelihood of finding such fossiliferous sequences must be very low. One can only dream of such resolution for the fossil record of hominins, for instance. Evidently, if advanced statistical estimates come only from well-sampled assemblages, they would represent the completeness of those well-sampled assemblages and would not be representative of global completeness on average.
To be sure, large-scale analyses can include material from a wide range of depositional environments, and in this way species even from less fossiliferous environments (including outcrop unavailability) can potentially enter the data occasionally. But unless the proportion of environments in the fossil record reflects the proportion of environments in the real world (an extremely unlikely conjecture), estimates of completeness obtained this way will be biased in favor of the most fossiliferous environments.
Aside from whether a fossil locality is sampled more or less well, entire provinces or biomes may escape preservation because they do not intersect depositional basins or intersect them only partly. Today, only 16% of Earth's terrestrial land surface is within sedimentary basins; the remainder of the land is in upland areas that will not be represented in the future rock record (Nyberg and Howell Reference Nyberg and Howell2015), and this 16% does not represent current climatic zones of the Earth uniformly.
In general, fossil preservation is nonuniform over time and space and varies among taxa, depositional environments, sedimentary basins, and topography (Behrensmeyer at al. Reference Behrensmeyer, Kidwell and Gastaldo2000; Holland Reference Holland2016; Badgley et al. Reference Badgley, Smiley, Terry, Davis, DeSantis, Fox, Hopkins, Jezkova, Matocq, Matzke, McGuire, Mulch, Riddle, Roth, Samuels, Stromberg and Yanites2017). Moreover, “the pull of the recent” (Raup Reference Raup1979), the notion that recent past is better represented in the fossil record than the more distant past, may also bias estimates, although there is no consensus on this (Jablonski et al. Reference Jablonski, Roy, Valentine, Price and Anderson2003). Most importantly, there is much that does not preserve and can never be discovered, no matter how intensively explored (Nyberg and Howell Reference Nyberg and Howell2015; Holland Reference Holland2016).
From early arithmetic attempts to sophisticated computational models, approaches to quantitative estimation of completeness of the fossil record have been grounded in three main approaches: reasoning about fossil collection, preservation patterns, or macroevolutionary processes. Transitioning of methods toward the more and more computationally elaborate has come at the cost of requiring better sampled or more refined data to back them up.
Many early estimates of completeness were based on statistics about the collection processes, such as rates of discovery of new taxa over time (Newell Reference Newell1959) or species-to-specimen ratios (Durham Reference Durham1967), borrowing general reasoning from collector curve analyses in ecology (Preston Reference Preston1948), tailored for paleontology (Benton Reference Benton2009).
Later came approaches that draw upon assumptions about the preservation process and the configuration of stratigraphic sequences and fossil finds within them. Completeness estimates can be approached individually as the probability of sampling per species per time interval (Paul Reference Paul, Joysey and Friday1982) or jointly via the distribution of taxonomic durations (Foote and Raup Reference Foote and Raup1996; Foote et al Reference Foote, Sadler, Cooper and Crampton2019). Related, but solving a different task, are methods that estimate completeness of stratigraphic sequences (Schindel Reference Schindel1982).
The third type of approaches drew upon assumptions and models of macroevolutionary processes, including speciation rates or species durations. Simpson's (Reference Simpson1952) early attempt to estimate the number of species that ever lived falls under this category. The approach we use falls under this category as well. A numeric estimate of completeness comes from comparing the number of observed fossil taxa to the estimated total progeny (Kendall Reference Kendall1948). The total progeny can be estimated via assumptions about diversity dynamics (Valentine Reference Valentine1970), it may as well come from phylogenetically explicit speciation models (Benton et al. Reference Benton, Wills and Hitchin2000).
Apart from those three types of approaches, researchers have compared living species with the fossil record directly (Raup Reference Raup1979; Valentine Reference Valentine1989), without extrapolating over time. Such comparisons can only be plausible across the fossil record of the most recent past, the Pleistocene at most.
It is no news that fossil databases are incomplete. In addition to differences in preservation and biases in collection and study, there are synonymity challenges and challenges of taxonomic identification from incomplete specimens. Estimates of mammalian species duration are approximate averages, and changes in diversity over time, as well as relative proportions of different taxonomic groups in the past, are uncertain. The degree of this incompleteness is poorly known. Our coarse analysis suggests that completeness of the fossil record of terrestrial mammals might actually be both lower and far less even than has been lately expected. It seems that there is still a lot to discover—and not least for the long-term favorite order of Primates. Perhaps this is one reason why discoveries of new species of fossil primates tend to result in more phylogenetic tree-shaking than discoveries of new species of fossil rhinoceroses?
One way or another, it is clear that the fossil record as we know it is structurally imbalanced and will so remain. Beyond such superficial considerations, our results also suggest that it might be time to look more closely at the representativeness of the data available for analysis and consider its implications for our understanding of the evolutionary history of terrestrial mammals and their living environments. Are we in fact sampling mainly from the savanna-like environments of the past? How much is happening out of sight, in the less fossiliferous environments or outside the active sedimentary basins? Will we even ever know?
Acknowledgments
We thank J. Saarinen for enumerating recently extinct species of proboscideans. This research was partially supported by the Academy of Finland (grant no. 314803 to I.Ž.). This is a contribution from the Valio Armas Korvenkontio Unit of Dental Anatomy in Relation to Evolutionary Theory.
Data Availability Statement
The code for reproducing data processing along with a spreadsheet calculating completeness are publicly available via GitHub: https://github.com/zliobaite/completometer.
Appendix
A.1. Derivation and Alternative Formulations of the Completeness Estimate
A.1.1. Main Variant with Constant Species Duration
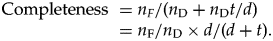
Completeness of the fossil record over a time period (t) can be defined as a fraction of the number of species in the fossil record over the number of species that lived during the time period, denote the two numbers n F and n L, respectively. Then,
 $${\rm Completeness} = n_{\rm F}/n_{\rm L}.\;$$
n F comes from the fossil record at hand. n L. can be estimated if we know the expected duration of a species (d) and the standing diversity (n D). Then, assuming that the species duration and the standing diversity stayed constant over the analysis period, the number of species that lived during the analysis period and thus potentially could have made into the fossil record, is
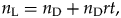
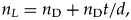 $$n_L = n_{\rm D} + n_{\rm D}t/d, \;$$
where n D is the standing diversity, d is the average species duration (in millions of years), and t is time elapsed (in millions of years). The first component is needed to account for the initial set of species at “time zero” that could have potentially made it into the fossil record as well. Then,
 $${\rm Completeness\ } = n_F/ ( {n_{\rm D} + n_{\rm D}t/d} ) = n_{\rm F}/n_{\rm D} \times d/( {d + t} ) .$$
A.1.2. An Alternative with Assumptions about Speciation Rates instead of Species Duration
An alternative equivalent formulation of completeness measure is possible using speciation rates instead of species duration. Note that in a closed world (without immigration), the speciation rate is inverse of the average species duration, that is,
 $$r = 1/d.$$
Continuing to assume a closed world, the number of species that lived during the analysis period is a sum of the number of ancestors at the start of the analysis period and their total progeny during the analysis period, that is,
 $$n_{\rm L} = n_{\rm D} + n_{\rm D}rt, \;$$
and from here
 $${\rm Completeness\ } = n_{\rm F}/ ( {n_{\rm D} + n_{\rm D}rt} ) = n_{\rm F}/n_{\rm D} \times 1/( {1 + rt} ) .$$
A.1.3. An Alternative with Increasing or Decreasing Standing Diversity over Time
For relaxing the assumption about constant species duration, we need to assume how the duration changes over time. The most straightforward way for present purposes is to assume that the duration changes linearly over time and that the expected species duration is attributed to the point of species origination in time. Then, the expected number of species that lived over the analysis period can be approximated as
 $$n^\ast _{\rm L}\approx n_0 + n_{\rm A}t/d, \;$$
where n 0 is the standing diversity at the beginning of the analysis period, n A is the average standing diversity over the analysis period, d is the expected species duration, and t is time elapsed.
If a linear increase in the standing diversity is assumed, then
 $$n_{\rm A} = ( {n_0 + n_t} ) /2, \;$$
where n t is the standing diversity at the end of the analysis period.
In this analysis, because we use the standing diversity of the present day as a reference and the analysis period is from 23.000 Ma to 5.333 Ma, computing the average standing diversity for our analysis is slightly more entangled. We assume that the standing diversity has doubled (scenario 1) and reduced by half (scenario 2) during the last 23 Myr; thus, in scenario 1,
 $$n_0 = 2n_{\rm L}, \;$$
and in scenario 2,
 $$n_0 = 0.5n_{\rm L}, \;$$
where nL is the standing diversity today. More generally,
 $$n_0 = an_{\rm L}.$$
We need to compute the average standing diversity not from the beginning of the Miocene to today, which would be a simple average (αn now + n now)/2, but across the Miocene, which is
 $$n_{\rm A} = ( {n_t = 23{\rm Ma}} + n_{t = 5.333{\rm Ma}} ) /2.$$
Assuming linear change in the standing diversity,
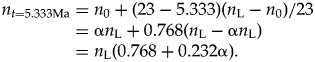 $$n_{t = 5.333{\rm Ma}} = n_0 + ( {23 - 5.333} ) ( {n_{\rm L} - n_0} ) /23 = {\rm \alpha }n_{\rm L} + 0.768( n_{\rm L}-{\rm \alpha }n_{\rm L}) = n_{\rm L}( 0.768 + 0.232{\rm \alpha }) .$$
Then, under scenario 1 (increasing diversity, α = 0.5), n t=5.333Ma = 0.884 n L, and under scenario 2 (decreasing diversity, α = 2) n t=5.333Ma = 1.232 n L.
Then,
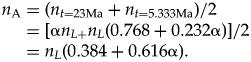 $$n_{\rm A} = ( n_{t = 23{\rm Ma}} + n_{t = 5.333{\rm Ma}} ) /2 = [ {\rm \alpha }n_{L + }n_L( 0.768 + 0.232{\rm \alpha }) ] /2 = n_L( 0.384 + 0.616{\rm \alpha }) .$$
Under scenario 1, n A = 0.692, and under scenario 2, n A = 1.616.
A.2. Complementary Sensitivity Analysis
Table A.1 gives completeness estimates for different taxonomic groups under different assumptions about the excepted duration of species and standing diversity.
Table A1. Number of species within orders today and in the Miocene fossil record (NOW database), as well as estimated completeness of the record with different assumptions. For the main scenario (“main”) completeness of the record is computed assuming that the proportions of orders and the diversity of mammalian species stay the same over the last 23 Myr and the duration of all mammalian species is 1 Myr. Italic gray type in brackets indicates interim sums. “Extinct” and “NA” in italics indicate the groups that are not available in that time unit. Bold indicates the main result.


 Open access