


Introduction
Throughout the Proterozoic and early Paleozoic records, most organic-walled microfossils consist of vesicular remains of uncertain biological affinity, collectively assigned to the informal group “Acritarcha” (Evitt Reference Evitt1963). Acritarchs have traditionally been classified using an essentially phenetic form-taxonomic scheme (Downie et al. Reference Downie, Evitt and Sarjeant1963; Evitt Reference Evitt1963) routinely used in biostratigraphy. In particular, the abundance and cosmopolitan distribution of many acritarch taxa throughout the Cambrian Period (Molyneux et al. Reference Molyneux, Delabroye, Wicander and Servais2013) have led to the extensive use of acritarchs to correlate regional biostratigraphic schemes previously based on skeletal faunas or to provide relative age constraints in areas where other sources are absent (Moczydłowska Reference Moczydłowska1991, Reference Moczydłowska1998, Reference Moczydłowska1999; Moczydłowska and Zang Reference Moczydłowska and Zang2006; Zang et al. Reference Zang, Moczydłowska and Jago2007; Palacios et al. Reference Palacios, Jensen, Barr, White and Miller2011, Reference Palacios, Jensen, Barr, White and Myrow2018, Reference Palacios, Högström, Ebbestad, Agić, Høyberget, Jensen, Meinhold and Taylor2020; Rushton et al. Reference Rushton, Brück, Molyneux, Williams and Woodcock2011; Ahn and Zhu Reference Ahn and Zhu2017).
Despite being evidently polyphyletic, morphological and ultrastructural evidence suggests that a substantial subset of Cambrian acritarchs represent various developmental stages in the life cycle of unicellular phytoplankton (Tappan Reference Tappan1980; Colbath and Grenfell Reference Colbath and Grenfell1995; Talyzina and Moczydłowska Reference Talyzina and Moczydłowska2000; Moczydłowska Reference Moczydłowska2010, Reference Moczydłowska2016). These comprise the numerous small (<100 μm), symmetrical acanthomorphs (process-bearing acritarchs) often preserving excystment structures (Butterfield Reference Butterfield1997; Talyzina and Moczydłowska Reference Talyzina and Moczydłowska2000; Knoll et al. Reference Knoll, Javaux, Hewitt and Cohen2006; Moczydłowska and Willman Reference Moczydłowska and Willman2009; Moczydłowska Reference Moczydłowska2010). As such, the acritarch record offers crucial, albeit indirect, glimpses into the evolution of primary producers from a time when complex multi-tiered food webs were first being established during the Cambrian (Butterfield Reference Butterfield1997, Reference Butterfield2007, Reference Butterfield2011; Vidal and Moczydłowska-Vidal Reference Vidal and Moczydłowska-Vidal1997; Moczydłowska Reference Moczydłowska2002, Reference Moczydłowska2011; Peterson and Butterfield Reference Peterson and Butterfield2005).
Large-scale patterns of phytoplankton diversity have traditionally been explored using form-taxonomic counts (Tappan and Loeblich Reference Tappan and Loeblich1973; Vidal and Knoll Reference Vidal and Knoll1982; Knoll Reference Knoll1994; Strother Reference Strother, Jansonius and McGregor1996, Reference Strother2008; Vidal and Moczydłowska-Vidal Reference Vidal and Moczydłowska-Vidal1997; Moczydłowska Reference Moczydłowska1998, Reference Moczydłowska2011; Knoll et al. Reference Knoll, Javaux, Hewitt and Cohen2006; Nowak et al. Reference Nowak, Servais, Monnet, Molyneux and Vandenbroucke2015; Zheng et al. Reference Zheng, Clausen, Feng and Servais2020) and compared with corresponding metazoan diversity (Moczydłowska Reference Moczydłowska2002, Reference Moczydłowska2011; Butterfield Reference Butterfield2004; Nowak et al. Reference Nowak, Servais, Monnet, Molyneux and Vandenbroucke2015). A meaningful evaluation of the timing and patterns of early phytoplankton evolution has nevertheless been hampered by problems of form taxonomy and the polyphyletic nature of acritarchs. As well as concealing diversity sourced from multiple distantly related clades, a direct diversity-based reading of the acritarch record is further confounded by the problems of distinguishing ecophenotypic or ontogenetic variants. Indeed, modern algal protists exhibit tremendous intraspecific disparity, expressed as successive growth stages dependent on a variety of environmental parameters (e.g., Sandgren Reference Sandgren1983; Kokinos and Anderson Reference Kokinos and Anderson1995; Ellegaard Reference Ellegaard2000; Luo et al. Reference Luo, Krienitz, Pflugmacher and Walz2005; Naselli-Flores et al. Reference Naselli-Flores, Padisák and Albay2007). When imparted to the fossil record, such phenotypic plasticity could act to artificially inflate “species” diversity, or conversely deflate diversity through instances of morphological convergence. For instance, morphologically simple form taxa such as Leiosphaeridia are almost certainly produced by a wide range of more or less distantly related clades (Butterfield et al. Reference Butterfield, Knoll and Swett1994; Talyzina and Moczydłowska Reference Talyzina and Moczydłowska2000; Willman and Moczydłowska Reference Willman and Moczydłowska2007; Javaux and Knoll Reference Javaux and Knoll2017; Slater and Budd Reference Slater and Budd2019), leading to an underestimation of phytoplankton diversity (and/or the inclusion of non-phytoplankton). By contrast, individual biological species may produce a spectrum of cysts, envelopes, and other recalcitrant structures throughout their life cycles, each of which may have been described as a distinct acritarch taxon, resulting in an overestimation of standing diversity (Butterfield Reference Butterfield2004, Reference Butterfield2005a,Reference Butterfieldb). Postmortem chemical and physical processes add another problematic dimension to a direct reading of acritarch diversity, because such processes can result in a range of secondary features that are easily mistaken for diagnostic ones (e.g., split or curled processes; Grey and Willman Reference Grey and Willman2009). Difficulties in recognizing form taxa beyond underlying sources of taphonomic, ontogenetic, and/or other intraspecific variation has led to significant inconsistencies in naming (Stricanne and Servais Reference Stricanne and Servais2002; Servais et al. Reference Servais, Stricanne, Montenari and Pross2004; Mullins and Servais Reference Mullins and Servais2008).
The range of small acanthomorphic acritarchs encompassed by the Cambrian form genus Skiagia typifies these taxonomic dilemmas. The morphology and dimensions of the diagnostically funnel-shaped processes of Skiagia form the basis of its species-level subdivisions (Downie Reference Downie1982; Moczydłowska Reference Moczydłowska1991, Reference Moczydłowska1998). These subtle differences in the specific taxonomy of Skiagia have been used to correlate uppermost Fortunian to basal Miaolingian sedimentary successions worldwide (Moczydłowska Reference Moczydłowska1991, Reference Moczydłowska1999; Moczydłowska and Zang Reference Moczydłowska and Zang2006; Landing et al. Reference Landing, Geyer, Brasier and Bowring2013). In particular, two widely used markers are the first appearance datum (FAD) of Skiagia ornata, which slightly precedes the as yet undefined Fortunian/Cambrian Stage 2 boundary; and the FAD of Skiagia ciliosa, which lies within Cambrian Stage 3, below the first appearance of olenellid trilobites. More recently, however, species of the Skiagia-plexus have been recognized as distinct stages in an algal life cycle (Moczydłowska Reference Moczydłowska2010), a factor at odds with their sequential appearance in the fossil record (Zhang et al. Reference Zhang, Ahlberg, Babcock, Choi, Geyer, Gozalo, Stewart Hollingsworth, Li, Naimark, Pegel, Steiner, Wotte and Zhang2017; Palacios et al. Reference Palacios, Högström, Ebbestad, Agić, Høyberget, Jensen, Meinhold and Taylor2020). As with many acritarch form taxa, Skiagia species are also characterized by extended synonymy lists and ambiguous transitional morphotypes (Moczydłowska Reference Moczydłowska1991, Reference Moczydłowska2011) detailing a history of taxonomic inconsistencies. A critical evaluation of the taxonomy of this important acritarch is therefore needed.
Here we take a novel approach to this persistent problem and use multivariate ordination techniques to shed light on the morphological matrix underlying the definition of Skiagia species and their phenotypic variation, following the principles of population analysis (Le Hérissé Reference Le Hérissé1989; Fatka and Brocke Reference Fatka and Brocke2008). Palynological preparations from a previous study (Vidal and Peel Reference Vidal and Peel1993) were used to detect morphological patterns of variation in Skiagia at the scale of a single siliciclastic succession from the Buen Formation (Cambrian Series 2, Stages 3–4), North Greenland. Combined with an independent examination of life cycle stages and their discrete features, this quantitative approach offers the prospect of clarifying the complex relationships among morphology, taxonomy, and paleobiology in a local Skiagia population.
Materials and Methods
Sampled Locality and Stratigraphy
This study is based on acritarch assemblages from two horizons in the lower Cambrian Buen Formation at the Brillesø site, southern Peary Land, North Greenland (Fig. 1). The geological and biostratigraphic context of the sampled locality is outlined below.
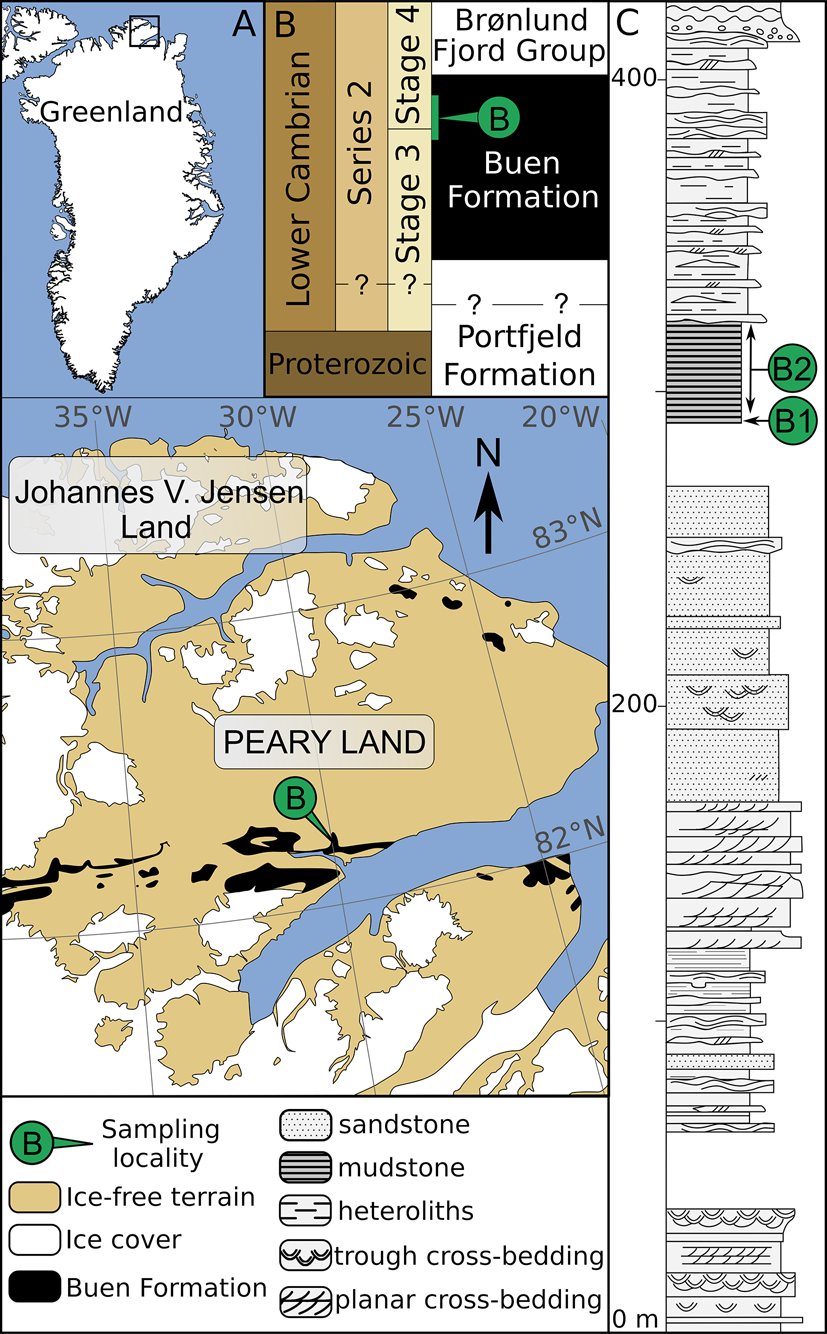
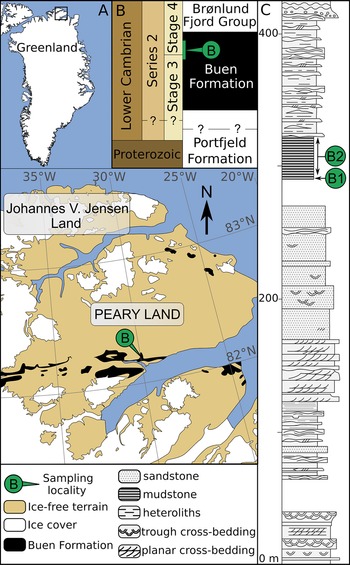
Figure 1. Geological map and stratigraphy of the sampled area (redrawn from Wallet et al. Reference Wallet, Slater, Willman and Peel2021). A, Map of Greenland with magnified area showing the lateral extent of early Cambrian strata in southern Peary Land (after Soper and Higgins Reference Soper and Higgins1987). B, Stratigraphic subdivision of Neoproterozoic–early Cambrian sediments in North Greenland and their tentative correlation with the international stratigraphic chart (after Ineson and Peel Reference Ineson and Peel2011). Inferred stratigraphic location of sampled horizons is shown in green. C, Sedimentary log of the Buen Formation at its type locality and nearby outcrops (after Vidal and Peel Reference Vidal and Peel1993), showing sampled horizons at Brillesø locality 1 (B1) and Brillesø locality 2 (B2; Peel and Willman Reference Peel and Willman2018).
The Buen Formation (Cambrian Stages 3‒4) mainly outcrops along an east-west-trending belt extending eastward to the southern margin of Peary Land (Fig. 1A,B). Successions from these localities are informally subdivided into a sandstone-dominated lower member deposited in shallow-shelf settings and a mudstone-dominated upper member deposited in outer-shelf conditions (Vidal and Peel Reference Vidal and Peel1993; Ineson and Peel Reference Ineson and Peel1997; Fig. 1C). A more detailed account of the early Cambrian geology of North Greenland is given by Higgins et al. (Reference Higgins, Ineson, Peel, Surlyk and Sønderholm1991), Vidal and Peel (Reference Vidal and Peel1993), Ineson and Peel (Reference Ineson and Peel1997, Reference Ineson and Peel2011), and Peel and Willman (Reference Peel and Willman2018).
The Brillesø site (southern Peary Land; Fig. 1A) previously yielded both acritarchs (Vidal and Peel Reference Vidal and Peel1993) and small carbonaceous fossils (Slater et al. Reference Slater, Willman, Budd and Peel2018; Wallet et al. Reference Wallet, Slater, Willman and Peel2021) from the upper member of the Buen Formation. The acritarch assemblage has previously been assigned to the Heliosphaeridium dissimilare–Skiagia ciliosa Zone of Dyeran Stage (Cambrian Stages 3‒4; Vidal and Peel Reference Vidal and Peel1993; Fig. 2). It includes Skiagia ciliosa, Skiagia cf. pura, Pterospermella solida, Cymatiosphaera cf. postii, Leiovalia tenera, Multiplicisphaeridium dendroideum, Heliosphaeridium dissimilare, Heliosphaeridium lubomlense, Heliosphaeridium obscurum, and Goniosphaeridium cf. volkovae. Reexamination of the palynological material retrieved by Vidal and Peel (Reference Vidal and Peel1993) also revealed the presence of Pterospermella velata (Fig. 2I) and Granomarginata prima (Fig. 2L), which are known from the underlying Asteridium–Comasphaeridium and Skiagia ornata–Fimbriaglomerella membranacea Zones of Terreneuvian–Cambrian Stage 3 age (Moczydłowska Reference Moczydłowska1991). However, the poorly constrained biostratigraphic and paleogeographic range of these species is being continuously expanded (Landing et al. Reference Landing, Geyer, Brasier and Bowring2013; Palacios et al. Reference Palacios, Jensen, Barr, White and Myrow2018; Slater and Willman Reference Slater and Willman2019; Zheng et al. Reference Zheng, Clausen, Feng and Servais2020). The trilobite record at Brillesø includes Mesolenellus hyperboreus from the Olenellus Zone (Cambrian Stages 3‒4), but the lower part of the upper member (locality B1; Fig. 1C) also yielded the nevadiid Limniphacos perspicullum. These levels were tentatively correlated with the Nevadia addyensis Zone of the Montezuman Stage (Cambrian Stage 3; Hollingsworth Reference Hollingsworth2011; Peel and Willman Reference Peel and Willman2018). The consistent records of acritarchs and trilobites at Brillesø therefore strengthen support for the Cambrian Stages 3–4 age of the oldest pterobranch (Slater et al. Reference Slater, Willman, Budd and Peel2018) and crustacean (Wallet et al. Reference Wallet, Slater, Willman and Peel2021) fragments that have been recovered as small carbonaceous fossils from the same locality.

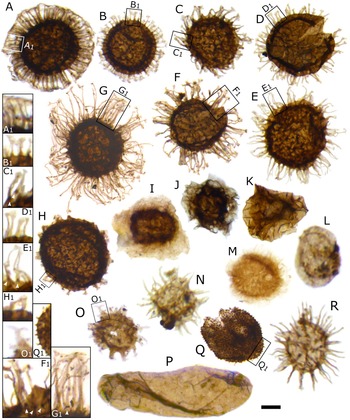
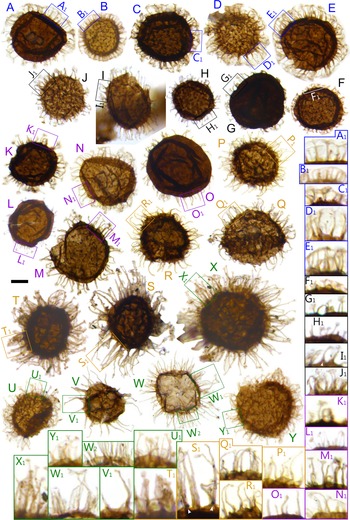
Figure 2. Acritarch assemblage from the Buen Formation, Brillesø. A–H, Acritarchs from the Skiagia-plexus. Magnified areas show detail of process morphology, with plug-like structures indicated by white arrowheads. A, Skiagia scottica Downie, Reference Downie1982. B, Skiagia ciliosa (Volkova, Reference Volkova, Rozanov, Missarzhevskij and Volkova1969) Downie, Reference Downie1982 (morphotype A). C, Skiagia ciliosa (Volkova, Reference Volkova, Rozanov, Missarzhevskij and Volkova1969) Downie, Reference Downie1982 (morphotype B). D, Skiagia orbiculare (Volkova, Reference Volkova, Volkova, Zhuravleva, Zabrodin and Klinger1968) Downie, Reference Downie1982. E, Skiagia compressa (Volkova, Reference Volkova, Volkova, Zhuravleva, Zabrodin and Klinger1968) Downie, Reference Downie1982. F, Skiagia ornata (Volkova, Reference Volkova, Volkova, Zhuravleva, Zabrodin and Klinger1968) Downie, Reference Downie1982. G, Skiagia cf. compressa. H, Skiagia cf. pura. I, Pterospermella velata Moczydłowska, Reference Moczydłowska1988. J, Pterospermella solida (Volkova, Reference Volkova, Rozanov, Missarzhevskij and Volkova1969) Volkova, Reference Volkova, Kirjanov, Piscun, Pashkyavichene, Jankauskas, Keller and Rozanov1979 (in Volkova et al. Reference Volkova, Kirjanov, Piscun, Pashkyavichene, Jankauskas, Keller and Rozanov1979). K, Cymatiosphaera cf. postii. L, Granomarginata prima Naumova, Reference Naumova1960. M, Comasphaeridium molliculum Moczydłowska and Vidal, Reference Moczydłowska and Vidal1988. N, Goniosphaeridium cf. volkovae Hagenfeldt, Reference Hagenfeldt1989. O, Multiplicisphaeridium dendroideum (Jankauskas, Reference Jankauskas and Zhuravleva1976) Jankauskas and Kirjanov, 1979 (in Volkova et al. Reference Volkova, Kirjanov, Piscun, Pashkyavichene, Jankauskas, Keller and Rozanov1979), magnified area shows divided process termination. P, Leiovalia tenera Kirjanov, Reference Kirjanov1974. Q, Lophosphaeridium dubium (Volkova, Reference Volkova, Volkova, Zhuravleva, Zabrodin and Klinger1968) Moczydłowska, Reference Moczydłowska1991, magnified area shows detail of spinose surface sculpture. R, Heliosphaeridium dissimilare (Volkova, Reference Volkova, Rozanov, Missarzhevskij and Volkova1969) Moczydłowska, Reference Moczydłowska1991. Specimens A–N, Q–R are deposited in the Natural History Museum of Denmark, Copenhagen; Specimen O is deposited at the Museum of Evolution, Uppsala, Sweden. Specimens have the following numbers: A, MGUH 33960; B, MGUH 33961; C, MGUH 33962; D, MGUH 33963; E, MGUH 33964; F, MGUH 33965; G, MGUH 33966, H, MGUH 33967; I, MGUH 33968; J, MGUH 33969; K, MGUH 33970; L, MGUH 33971; M, MGUH 33972; N, MGUH 21534; O, PMU 36118-2; P, MGUH 33973; Q, MGUH 33974; R, MGUH 33975. Scale bars, 10 μm; in L, N, R, and magnified areas, 5 μm.
Sampled Horizons and Palynological Material
Sampling data are given by Vidal and Peel (Reference Vidal and Peel1993), Peel and Willman (Reference Peel and Willman2018), and Wallet et al. (Reference Wallet, Slater, Willman and Peel2021) and are summarized here. Nine palynological preparations corresponding to three samples collected by Grønlands Geologiske Undersøgelse (Geological Survey of Greenland, GGU prefix) from the Brillesø site were processed by Vidal and Peel (Reference Vidal and Peel1993) using a standard acid maceration procedure (Vidal Reference Vidal1988). GGU sample 184002 was recovered from a 60-cm-thick horizon of iron-stained dark-gray mudstones (“Brillesø locality 1,” B1; Fig. 1C) corresponding to the lowermost part of the upper member of the Buen Formation. GGU samples 184003 and 184004 were retrieved from a nearby outcrop of dark-gray mudstones (“Brillesø locality 2,” B2; Fig. 1C) stratigraphically 9 m above Brillesø locality 1 and span a bed thickness of 2.1 m and 1 m, respectively. All specimens are deposited in the Natural History Museum of Denmark, Copenhagen; except specimen PMU 36118-2 (Fig. 2O), hosted at the Museum of Evolution, Uppsala, Sweden.
Our palynological analysis revealed a total of six Skiagia species (all three samples combined); namely Skiagia scottica Downie, Reference Downie1982, S. ciliosa (Volkova, Reference Volkova, Rozanov, Missarzhevskij and Volkova1969) Downie, Reference Downie1982, Skiagia orbiculare (Volkova, Reference Volkova, Volkova, Zhuravleva, Zabrodin and Klinger1968) Downie, Reference Downie1982, S. ornata (Volkova, Reference Volkova, Volkova, Zhuravleva, Zabrodin and Klinger1968) Downie, Reference Downie1982, Skiagia compressa (Volkova, Reference Volkova, Volkova, Zhuravleva, Zabrodin and Klinger1968) Downie, Reference Downie1982, and S. cf. pura Moczydłowska, Reference Moczydłowska1988. Identification was based on original diagnoses (Volkova Reference Volkova, Volkova, Zhuravleva, Zabrodin and Klinger1968, Reference Volkova, Rozanov, Missarzhevskij and Volkova1969; Downie Reference Downie1982; Moczydłowska Reference Moczydłowska1988) and subsequent taxonomic descriptions (e.g., Knoll and Swett Reference Knoll and Swett1987; Hagenfeldt Reference Hagenfeldt1989; Vidal and Peel Reference Vidal and Peel1993; Moczydłowska Reference Moczydłowska1991, Reference Moczydłowska2011; Vanguestaine et al. Reference Vanguestaine, Brück, Maziane-Serraj and Higgs2002; Palacios et al. Reference Palacios, Jensen, Barr, White and Miller2011, Reference Palacios, Högström, Ebbestad, Agić, Høyberget, Jensen, Meinhold and Taylor2020). Specimens having long (> ~30% of the vesicle diameter), tubular, and typically numerous (>50) processes were attributed to S. ornata (Figs. 2F, 3), while similar vesicles with shorter (~20%‒30% of the vesicle diameter) and generally fewer processes were attributed to S. orbiculare (Figs. 2D, 3). Skiagia ciliosa specimens are represented by two morphotypes in the studied assemblage (Moczydłowska Reference Moczydłowska1991; Vidal and Peel Reference Vidal and Peel1993); specimens from morphotype A have short (< ~20% of the vesicle diameter) and slender processes (Fig. 2B); while specimens from morphotype B exhibit longer (20‒30% of the vesicle diameter), more robust processes (Fig. 2C) with distinctively widened bases. Specimens having long (> ~30% of the vesicle diameter) processes with a widened base, imparting an irregular outline to the vesicle, were identified as S. compressa (Figs. 2E,G, and 3). Specimens referred to as S. cf. pura differ from S. pura Moczydłowska, Reference Moczydłowska1988 in having shorter and less numerous processes, but share their broad funnel-shaped morphology (Fig. 2H).
Specimens were photographed under light microscopy at a range of focal depths and measured from stacked images using the software ImageJ. Measurements were obtained from a total of 191 specimens, including 82 specimens of S. scottica, 42 specimens of S. ciliosa, 25 specimens of S. orbiculare, 24 specimens of S. ornata, and 18 specimens of S. compressa. Skiagia ciliosa morphotypes A and B were not distinguished in this study owing to the known overlap in their disparity (Moczydłowska Reference Moczydłowska1991). Skiagia pura specimens were too rare to be usefully included in the analysis.
Methods
A total of 10 parameters were measured in Skiagia specimens from all three samples, forming the basis of our multivariate analyses. Independent counts of life cycle structures in all five Skiagia species were performed on a separate collection of specimens from the same palynological preparations as those used for the main morphometric study. A detailed description of measured parameters, ordination techniques, and life cycle analysis is given below.
Measured Parameters
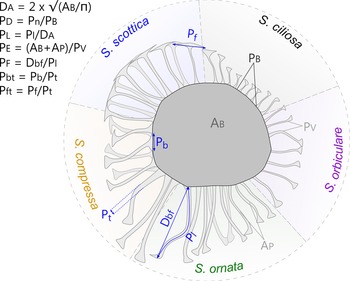
Among the selection of 10 parameters used in this morphometric study, 7 were chosen to reflect the original diagnoses of Skiagia species (Volkova Reference Volkova, Volkova, Zhuravleva, Zabrodin and Klinger1968, Reference Volkova, Rozanov, Missarzhevskij and Volkova1969; Downie Reference Downie1982; Moczydłowska Reference Moczydłowska1991; Fig. 3): process density (P D), process length (P L), process evenness (P E), width of the tubular process (P t), basal expansion rate (P bt), apical expansion rate (P ft), and process solidity (P s). Process density is the ratio between the number of processes protruding from the central body (Pn) and the length of the process-bearing surface (equivalent to the perimeter of the central body P B if the entire vesicle is preserved). The length of processes (P L) was measured on the longest fully observable process, from base to tip, and divided by the vesicle diameter (D A, see below) to remove overall size dependence. Process evenness (P E) was calculated as the area/perimeter ratio of entire specimens and measures the degree of indentation of their outline. This parameter captures the propensity of processes to join each other at the tip, a typical feature of Skiagia scottica (Downie Reference Downie1982; Moczydłowska Reference Moczydłowska1991). However, when processes are loose, P E is expected to be dependent on other features such as process density, flexibility, and length. Area (A B + A P) and perimeter values (P V) were automatically calculated from binary images following consistent thresholding of all photographs (T = 238), hence P E may also partly depend on the thickness of the wall, as the lightest portions of vesicle fall beyond the threshold value. The width of the tubular process (P t) was measured from the tubular portion of the processes, between the conical base and funnel-shaped tip. The basal expansion rate (P bt) is defined here as the ratio between the width of the conical base (P b) and the width of the tubular process (P t), while the apical expansion rate (P ft) is the ratio between the width of the funnel-shaped process termination (P f) and the width of the tubular process (P t). Both P b and P f were measured on the widest bases and funnels, respectively. Process solidity (P s) is the ratio between the pixel intensity value of the central body wall (T V, see below) and the pixel intensity value of the process wall. This parameter captures the color difference between the central body and processes, which features in original descriptions of S. ciliosa (Volkova Reference Volkova, Rozanov, Missarzhevskij and Volkova1969).

Figure 3. Measured parameters and their variations across the five Skiagia morphotypes selected for multivariate analyses. D A: vesicle diameter, calculated from the area of the central body (A B; i.e., vesicle lacking processes) assuming the circularity of its outline; P D: process density, calculated as the ratio between process number (Pn) and the length of the process-bearing surface, considered as the entire perimeter of the central body (P B) in complete vesicles; P L: size-independent estimator of process length (P l) measured on the longest, complete process; P E: process evenness, calculated as the total vesicle area (i.e., sum of the central body area [A B] and the process area [A P]) divided by its perimeter (P V); P F: process flexibility, calculated as the ratio between the shortest distance from process base to process tip (D bf) and process length (P l), measured on the most sinuous process; P bt: basal expansion rate, calculated as the ratio between basal process width (P b) and tubular process width (P t); P ft: apical expansion rate, calculated as the ratio between the width of the process tip (P f) and tubular process width (P t). T V and P S were not illustrated here (see main text for detailed explanations).
The remaining three parameters retained for quantitative study represent auxiliary features of unknown (or unrecognized) taxonomic potential (Fig. 3); namely, vesicle size (D A), process flexibility (P F) and the thickness of the vesicle wall (T V). These parameters are used to explore the full disparity of Skiagia and prospect for additional descriptors of between-species variation. The vesicle size was calculated as the diameter of a circle of the same area as the central body (A B). Process flexibility (P F) was measured on the most sinuous process and calculated as the distance from process base to process tip (D bf) divided by process length (P L). The thickness of the vesicle wall (T V) was estimated from the pixel intensity value measured in the lightest area of the central body, devoid of fractures or inner body, and was divided by the intensity value of a white pixel (255).
A few other characters featuring in previous descriptions of Skiagia species are not represented in the set of 10 parameters considered in this study, either because of their questionable systematic value and/or a lack of suitable measurement protocols. These include the basal plug of S. ciliosa, which is commonly recognized as a key diagnostic feature of the taxon (Moczydłowska Reference Moczydłowska1991; Palacios et al. Reference Palacios, Högström, Ebbestad, Agić, Høyberget, Jensen, Meinhold and Taylor2020) but has not been formally described in its original diagnosis (Volkova Reference Volkova, Rozanov, Missarzhevskij and Volkova1969). Repeated observations of plug-like structures in other Skiagia species (Downie Reference Downie1982; Hagenfeldt Reference Hagenfeldt1989; Zang Reference Zang, Alexander, Jago, Rozanov and Zhuravlev2001; Moczydłowska Reference Moczydłowska2011; Fig. 2E–G) cast doubt on the taxonomic reliability of this character, while its recognition beyond the thick-walled central body and/or within narrow processes is partly subjective. Similarly, the presence or absence of walls between processes and the central body cavity (Moczydłowska Reference Moczydłowska2011) was not considered in this analysis owing to the scarcity of observable data (and the impracticality of obtaining such data in most palynological studies). The morphology of process tips and bases is widely used to distinguish species of the genus Skiagia. In particular, processes in S. scottica have been described as being cylindrical and particularly flat at the tip (Moczydłowska Reference Moczydłowska1991, Reference Moczydłowska2010), while S. compressa has conical process bases imparting a wavy outline to the central body (Moczydłowska Reference Moczydłowska1991; Palacios and Moczydłowska Reference Palacios and Moczydłowska1998). Considering the large intraspecific disparity of both process tips (Downie Reference Downie1982; Vanguestaine et al. Reference Vanguestaine, Brück, Maziane-Serraj and Higgs2002) and bases (Knoll and Swett Reference Knoll and Swett1987; Vidal and Moczydłowska Reference Vidal and Moczydłowska1996; Moczydłowska Reference Moczydłowska2011), together with their high susceptibility to taphonomic alteration and specimen orientations, these parameters and their variation seem to be best captured by simple, standardized measurements of width (P bt and P ft; Fig. 3) rather than categorical variables or more advanced semilandmark- and landmark-based analyses (e.g., Lohmann Reference Lohmann1983; Sheets et al. Reference Sheets, Kim, Mitchell and Elewa2004). The outline of the central body is often described as being circular or oval (e.g., Volkova Reference Volkova, Volkova, Zhuravleva, Zabrodin and Klinger1968, Reference Volkova, Rozanov, Missarzhevskij and Volkova1969; Moczydłowska Reference Moczydłowska1991; Zang Reference Zang, Alexander, Jago, Rozanov and Zhuravlev2001), which can be quantified by a measure of eccentricity. However, this parameter was found to contribute very little to variation along the first three principal components (loadings < 0.15) and was therefore discarded from the analysis.
All measurements (P D, P L, P E, P t, P bt, P ft, P s, D A, P F, T V; Fig. 3) were performed using the free software ImageJ (Schneider et al. Reference Schneider, Rasband and Eliceiri2012; Rueden et al. Reference Rueden, Schindelin, Hiner, DeZonia, Walter, Arena and Eliceiri2017) and its Shape Smoothing plug-in (used to remove noise after thresholding). Incomplete or opened vesicles were analyzed on a single portion, which was pasted over missing parts. All values were standardized by subtracting the mean and dividing by the standard deviation to account for scale differences between parameters.
Multivariate Analyses of Morphological Parameters
Principal component analysis (PCA) was used to explore the overall disparity of the studied assemblage and determine whether consistent groupings can be recognized beyond any sources of intraspecific variation. The taxonomic subdivision of the genus Skiagia was then assessed using linear discriminant analysis (LDA), which maximizes between-group variance (e.g., Albrecht Reference Albrecht1980; Campbell and Atchley Reference Campbell and Atchley1981; Strauss Reference Strauss and Elewa2010; Huntley Reference Huntley, Laflamme, Schiffbauer and Dornbos2011). This ordination technique has been widely used in paleontology to help discriminate species based on morphological criteria in groups as varied as sharks (Marramà and Kriwet Reference Marramà and Kriwet2017), killifish (Reichenbacher et al. Reference Reichenbacher, Sienknecht, Küchenhoff and Fenske2007), plants (Álvarez et al. Reference Álvarez, Juaristi, Gutierrez and García-Amorena2009), bees (De Meulemeester et al. Reference De Meulemeester, Michez, Aytekin and Danforth2012), bryozoans (Cheetham Reference Cheetham1986), mollusks (Geary Reference Geary1992; Marko and Jackson Reference Marko and Jackson2001; Reyment Reference Reyment2003), trilobites (Labandeira and Hughes Reference Labandeira and Hughes1994), and brachiopods (Kowalewski et al. Reference Kowalewski, Dyreson, Marcot, Vargas, Flessa and Hallman1997; Carranza and Carlson Reference Carranza and Carlson2021). LDA has also been used as a quantitative tool for taxonomic revision of various upper Cambrian and Ordovician acritarch taxa (Wang et al. Reference Wang, Monnet and Servais2017; Yan et al. Reference Yan, Li, Molyneux, Raevskaya and Servais2017; Kroeck et al. Reference Kroeck, Blanchon, Zacaï, Navidi-Izad, Benachour, Monnet, Raevskaya, Szczepanik and Servais2020).
It is worth noting that an inherent degree of circularity is to be expected when using LDA for taxonomic purposes, as a priori groupings are defined based on criteria that are identical to those used for the calculation of discriminant functions (Huntley Reference Huntley, Laflamme, Schiffbauer and Dornbos2011). In the case of Skiagia, a priori group attribution is inevitably subjective to some degree, because established Skiagia species were not originally defined on quantitative grounds and transitional forms are evident in their populations. For these reasons, LDA was performed on a reduced dataset of 83 “unambiguous” specimens that could be assigned to a given species using the currently defined criteria with a reasonable degree of confidence. The remaining 108 specimens (categorized as “ambiguous”), which did not obviously fall into one or another of the established Skiagia species, were classified a posteriori using the discriminant functions regardless of their tentative species attribution. The boundary between unambiguous and ambiguous specimens was defined arbitrarily in order to achieve a reasonable trade-off between dataset quality and size. This approach was intended to calibrate the ordination plot with systematically defined characters, reducing any background noise created by poorly preserved and/or transitional forms.
LDA of the entire dataset (N = 191; “ambiguous” specimens being tentatively attributed to one species) was also performed to estimate the proportion of correct classifications in a more realistic situation in which ambiguous and/or transitional morphologies form a substantial portion of the microfossil assemblage. The statistical significance of observed between-species variations was tested using permutational multivariate analysis of variance, a nonparametric alternative to multivariate analysis of variance testing the difference between multivariate means (Anderson Reference Anderson2017). Significance calculations were based on the Mahalanobis distance between species, which accounts for correlations between variables (Campbell and Atchley Reference Campbell and Atchley1981; McLachlan Reference McLachlan1999).
All multivariate analyses were performed using the software package PAST (Hammer et al. Reference Hammer, Harper and Ryan2001; Hammer and Harper Reference Hammer and Harper2006). Separate LDAs and PCAs were run for each of the three studied samples to test for any potential paleoenvironmental and/or small-scale temporal effects on observed patterns. All PCAs were conducted on variance–covariance matrices.
Quantitative Analysis of Life Cycle Structures
Two hundred fifty well-preserved and identifiable Skiagia specimens were randomly selected in each of the three samples to investigate the distribution of life cycle stages among Skiagia species. Discrete features related to encystment (i.e., internal bodies; Moczydłowska Reference Moczydłowska2010, Reference Moczydłowska2016) and excystment (i.e., opened vesicles) were counted, and their relative frequency was calculated for each Skiagia species. The distribution of those features among distinct samples was also analyzed.
Results
Principal Component Analysis
PCA of the entire dataset exhibits a remarkable spread over the first four components (Figs. 4, 5). PC 1 accounts for just 26.2% of overall variation and is chiefly driven by T V, P S, and P E (Fig. 5B). The contribution of PC 2 to total variation is slightly lower (21.1%) and driven by a complex combination of parameters, including D A, P t, P L, and P ft (Fig. 5C). PC 3 and PC 4 explain 13.1% and 10.4% of overall variance, respectively, chiefly reflecting the contribution of P D and P t (Fig. 5D,E). The PC 3–PC 4 ordination plot is devoid of any obvious pattern (Supplementary Fig. 1) and does not warrant further analysis. Significant correlations were found between parameters (Supplementary Table 1), most notably P S, which is negatively correlated with T V (Spearman's rank correlation coefficient [rs] = −0.97; p < 0.001). Moderate correlations exist between P E and other parameters, including P L (rs = −0.41; p < 0.001), P ft (rs = 0.45; p < 0.001), and T V (rs = −0.46; p < 0.001); and between D A and P D (rs = −0.42; p < 0.001).

Figure 4. Results of the principal component analysis (PCA) showing variation across the first two PCs. The entire Skiagia dataset has been included (N = 191). The proportion of variation explained by each PC is shown along its respective axis. Filled and empty symbols represent unambiguous and ambiguous specimens, respectively, and are color coded according to their (tentative) species attribution. Inset on the upper left corner shows the PC 1–PC 2 biplot. Abbreviations for parameters are provided in the caption for Fig. 3.

Figure 5. Scree plot and loadings of the principal component analysis (PCA) performed on the entire Skiagia dataset (N = 191). A, Scree plot showing the percentage of variance explained by each PC. B–E, loadings associated with each PC showing positive and negative coefficients as black and white bars, respectively. Abbreviations for parameters are provided in the caption for Fig. 3.
Intraspecific variation is mostly captured by PC 1, which is chiefly driven by two negatively correlated variables, T V and P S (Fig. 5B). This echoes the broad and overlapping range of these parameters in all five Skiagia species (Fig. 6I,J). Between-species variance seems better expressed by PC 2, although no specific groupings are visible (Fig. 4). Instead, a continuous gradient of forms ranging from Skiagia scottica to Skiagia compressa is detectable from the lower to the upper part of the ordination plot. The exact morphological relationships between the species of this gradient are obscured by extended areas of overlaps and slight compositional differences between samples (Fig. 7, Supplementary Fig. 2). For instance, a more distinct sequence of clearly separated species is observed along the first component in the lowermost sample (GGU sample 184002; Figs. 1C, 7A), reflecting the contribution of P L, D A, P t, and P bt. The clear separation between groups in GGU sample 184002 is likely an artifact resulting from the scarcity of available measurements for Skiagia ciliosa and Skiagia orbiculare, which occupy a substantial portion of the morphospace between S. scottica and Skiagia ornata when all samples are included (Fig. 4). Similarly, the scarcity of measurements for S. compressa and S. ornata in sample 184003 likely explains their overlapping range with other species. The distribution of samples in the ordination plot shows extended areas of overlap (Supplementary Fig. 2) devoid of obvious pattern, suggesting that all levels capture the same morphological spectrum bounded by S. scottica and S. compressa.

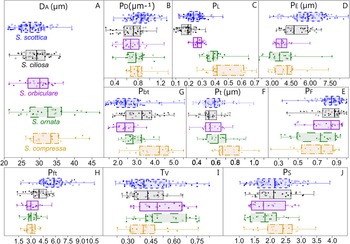
Figure 6. Box plots and scatter plots showing the distribution of measured parameters among Skiagia species. A, Vesicle diameter (D A, in μm); B, process density (P D, in number of processes per μm); C, process length (P L); D, process evenness (P E, in µm); E, process flexibility (P F); F, width of the tubular process (P t, in μm); G, basal expansion rate (P bt); H, apical expansion rate (P ft); I, vesicle thickness (T V); J, process solidity (P S). Filled and empty circles represent unambiguous and ambiguous specimens, respectively.
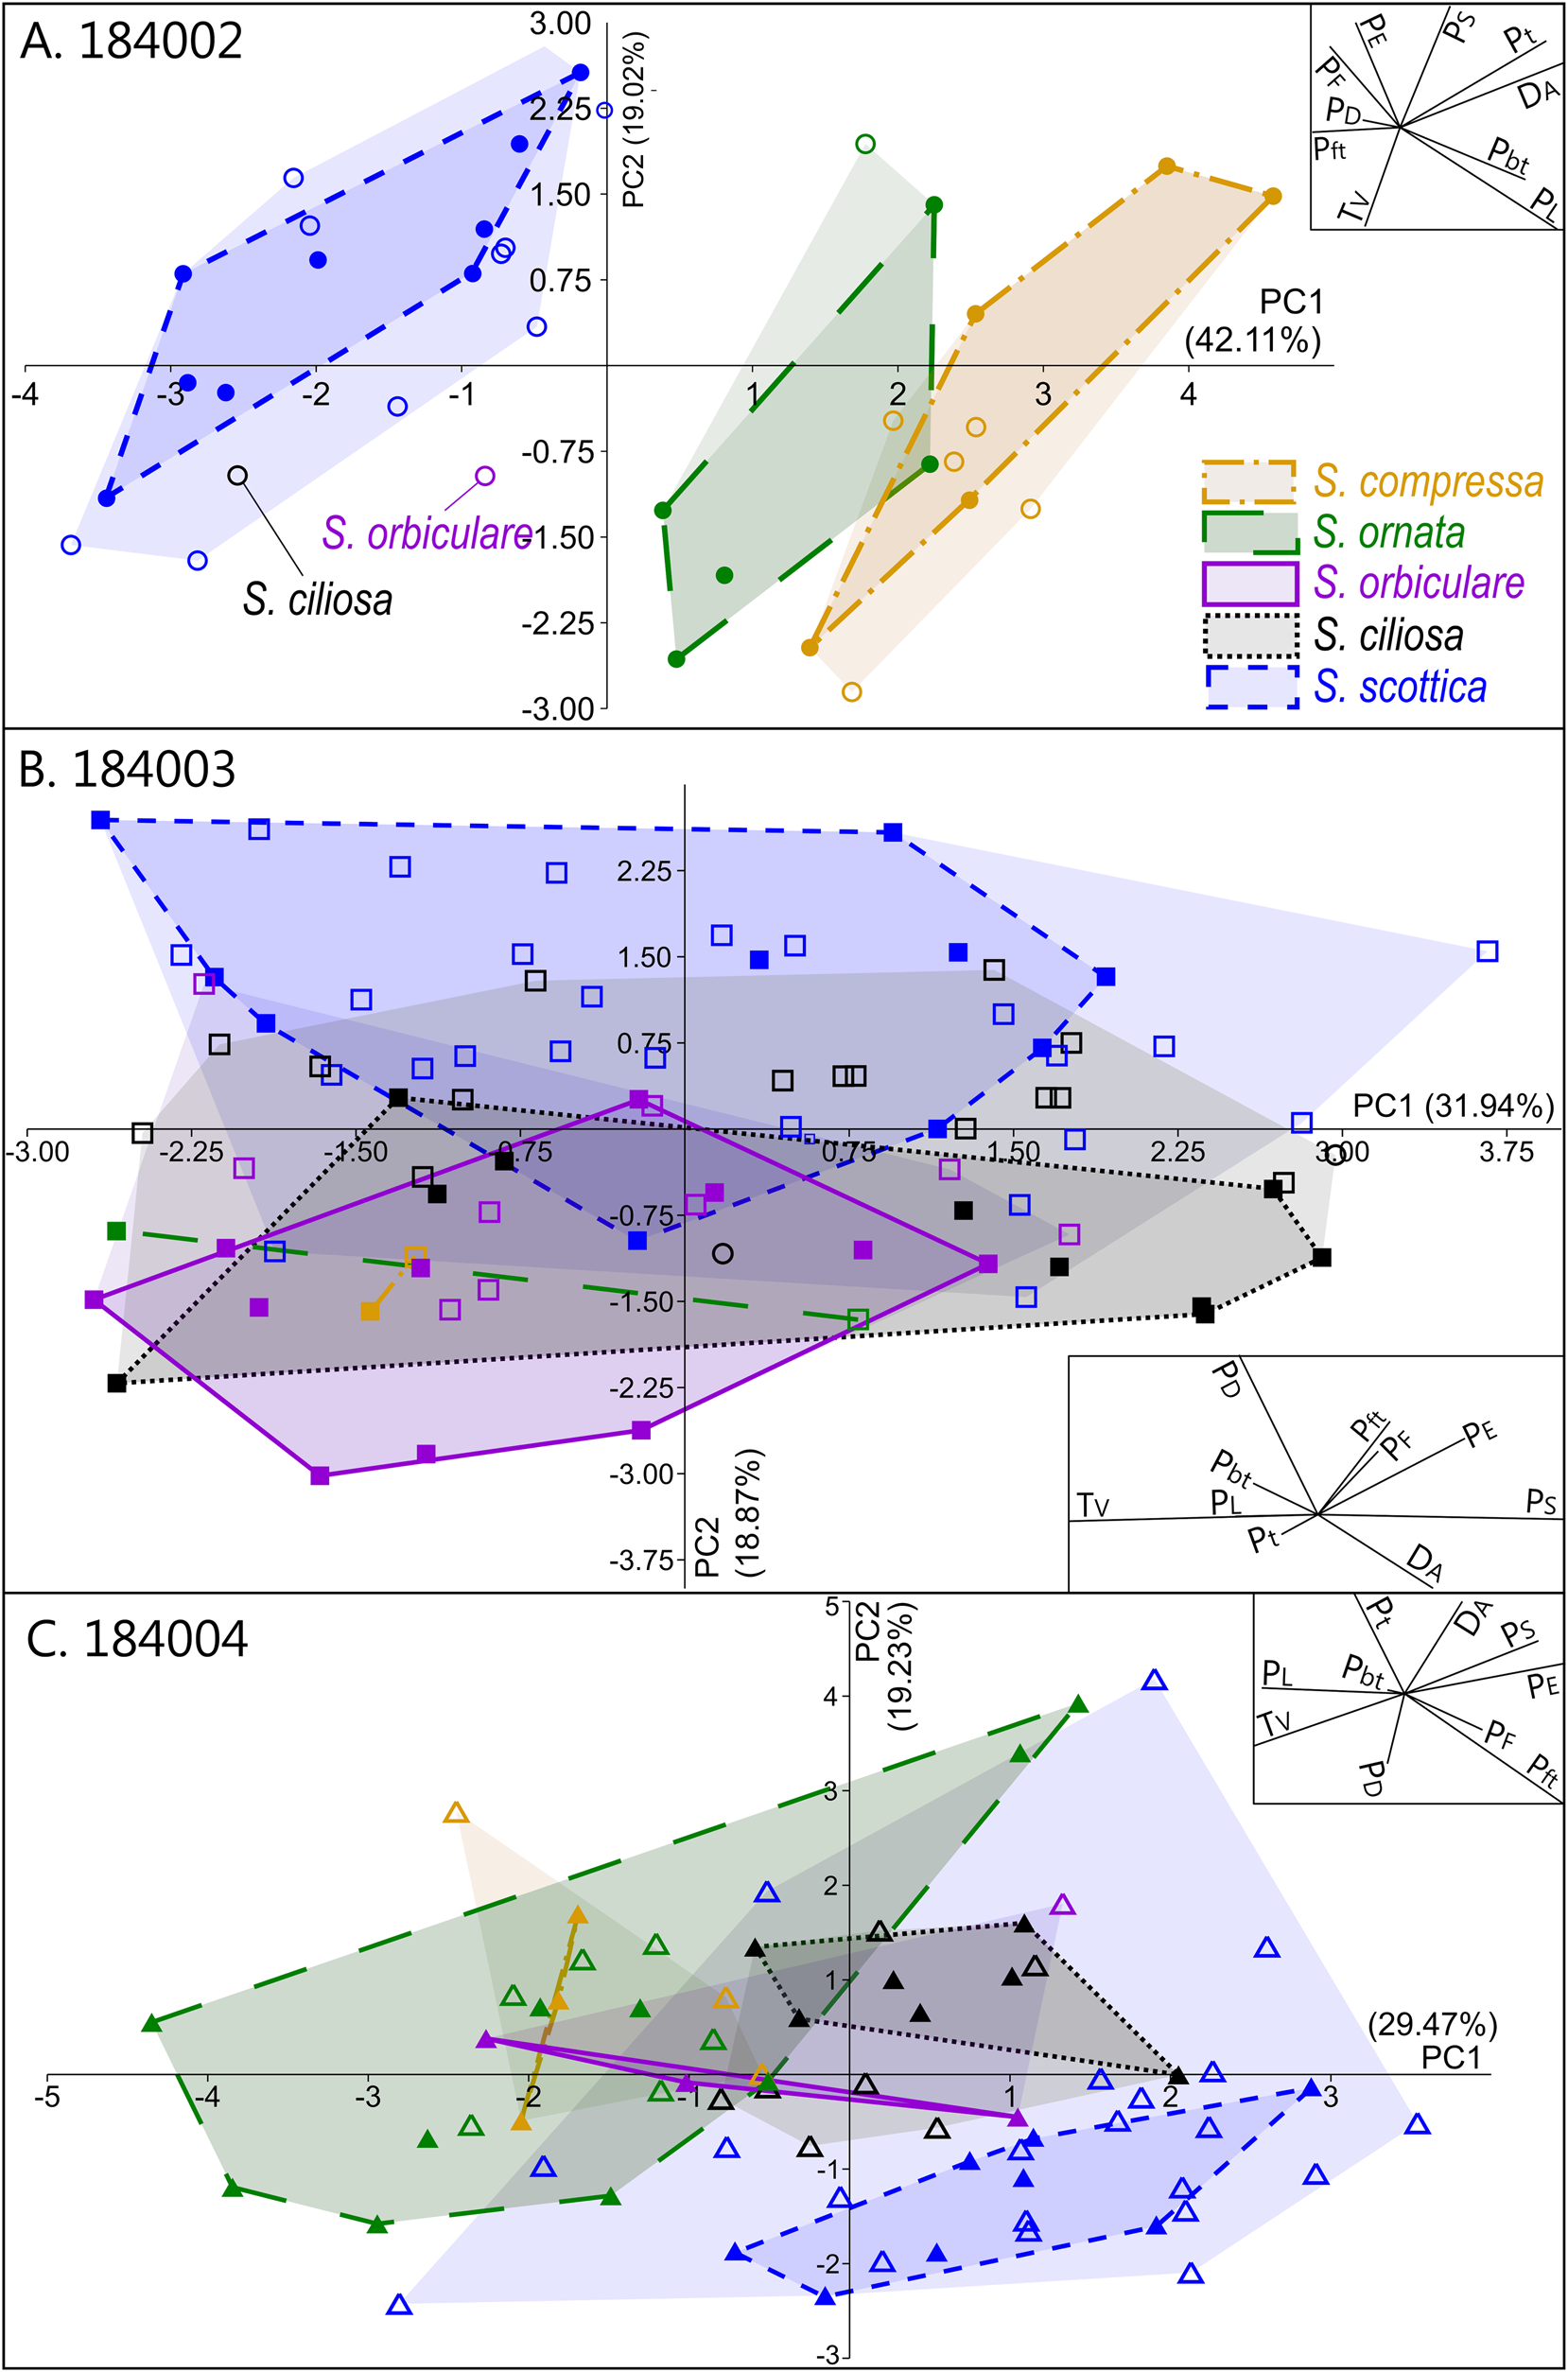
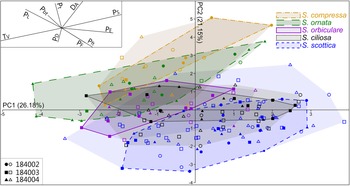
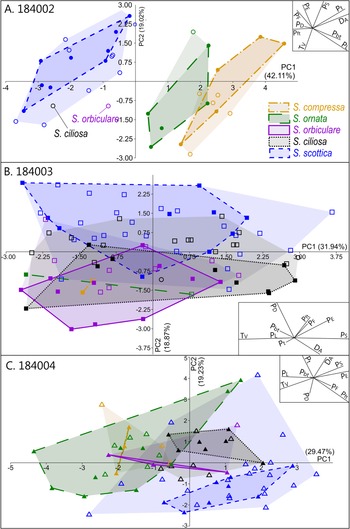
Figure 7. Results of the principal component analysis (PCA) in each sample, showing variation across PC 1 and PC 2. A, GGU sample 184002 (n = 36); B, GGU sample 184003 (n = 86); C, GGU sample 184004 (n = 69). The proportion of variation explained by each PC is shown along its respective axis. Filled and empty symbols represent unambiguous and ambiguous specimens, respectively, and are color coded according to their (tentative) species attribution. PC 1–PC 2 biplots are shown as insets on each ordination plot.
Linear Discriminant Analysis
LDA of unambiguous specimens (n = 83; Fig. 8) clarifies the morphological gradient identified using PCA by inflating between-group variance. The LDA plot of the first two discriminant functions (>95% of total variance between groups) shows a continuous sequence of Skiagia species from the left to the right end of the ordination plot; namely S. scottica, S. ciliosa, S. orbiculare, and S. compressa/S. ornata. The latter two species share most of their total morphological range, but unambiguous specimens show better separation, falling toward the top right region of the morphospace for S. ornata and the middle right region for S. compressa. Patterns of morphological variation between species are broadly conserved across all three samples (Supplementary Fig. 4), in spite of their slight differences in taxonomic composition (Supplementary Figs. 5, 7).

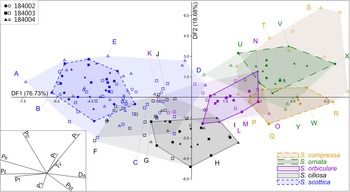
Figure 8. Linear discriminant analysis (LDA) of the reduced Skiagia dataset, consisting of 83 unambiguous specimens grouped per species. The remaining 108 ambiguous specimens are represented as empty symbols and light-colored convex hulls, color coded according to their tentative species attribution. Ambiguous specimens were plotted a posteriori using discriminant functions calculated from unambiguous specimens. Inset on the bottom left corner shows the DF 1–DF 2 biplot. The proportion of between-group variance explained by each discriminant function (DF) is shown along its respective axis. Specimens in A–Y are illustrated in Fig. 9. Abbreviations for parameters are provided in the caption for Fig. 3.
Although some degree of between-group separation is visible, there exist distinct areas of overlap between all five species. In total, 92.77% of unambiguous specimens were predicted to be assigned correctly to their given groups using jackknife resampling (Lance et al. Reference Lance, Kennedy and Leberg2000; Table 1). Skiagia scottica was the most robustly classified species (100% correct group attributions), followed by S. ciliosa (94.44%), S. orbiculare (92.31%), S. compressa (87.50%), and S. ornata (82.35%). The predicted rate of successful classifications dropped sharply after inclusion of ambiguous forms (N = 191), falling below 70% for S. ciliosa, S. ornata, and S. orbiculare. The addition of ambiguous specimens to the ordination plot did not substantially alter patterns of within- and between-group variation, but increased the size of overlapping areas, particularly between S. ciliosa and S. orbiculare and between S. ornata and S. compressa (Supplementary Fig. 6). Two regions of the ordination plot are occupied by the range of three different species, namely S. scottica–S. ciliosa–S. orbiculare and S. orbiculare–S. ornata–S. compressa. In spite of their broad, overlapping morphospace occupation, the multivariate means of each of the five Skiagia species were found to be significantly different from one another (p < 0.01).
Table 1. Percentage of correct classifications predicted by jackknife resampling, using all specimens (N = 191), unambiguous specimens only (n = 83), the full set of g = 5 species (Skiagia scottica, Skiagia ciliosa, Skiagia orbiculare, Skiagia ornata, and Skiagia compressa) or g = 4 species (S. scottica, S. ciliosa, S. orbiculare, S. ornata/S. compressa). JCS, jackknife classification success (%).

The distribution of Skiagia species in the ordination plot is chiefly governed by a complex combination of characters including P E, P ft, P L, P D, D A, and P F (Supplementary Fig. 3). Skiagia scottica is defined by its high P ft, P D, and P E values (Fig. 6B,D,H), as is expected from its numerous processes connected to each other by their wide, funnel-shaped termination (Fig. 3). The large number and apical morphology of processes in S. scottica may also explain its relatively high P F values (Figs. 6E, 8), as process attachment may have contributed to maintaining an evenly spread network of straight processes resistant to bending and deformation. Skiagia ciliosa partly diverges from this group, with morphotype A specimens having fewer and shorter processes gathering toward the left and lower portions of the ordination plot (Figs. 8, 9F–H). Morphotype B specimens fall closer to the morphological range of S. orbiculare (Fig. 8), which reflects their comparable process lengths but distinct process morphologies at the base (Figs. 6C,G, and 9I). Specimens attributed to S. orbiculare share numerous features with both S. scottica and S. ciliosa (Figs. 6, 8), but have lower P E values on average (Fig. 6D), and slightly longer processes with narrower tips (Figs. 6C,H, and 9M–O). Skiagia ornata and S. compressa are better distinguished from other Skiagia species, being characterized by longer processes (Figs. 6C, 9Q–Y) and generally larger vesicle size (Fig. 6A). Skiagia compressa differs from S. ornata only by having larger P t (Fig. 6F) and P bt values (Figs. 6G, 9P–T). Moreover, a few S. compressa specimens form distinct outliers gathering toward the upper right-hand portion of the ordination plot (Fig. 8), resulting in substantial overlaps with the S. ornata population. These specimens have unusually long processes (>50% of the vesicle diameter) with moderately expanded bases (Figs. 2G, 9S), which may conform to the diagnosis of either S. ornata or S. compressa. Considering these two species as synonymous in the present setting, 97.37% of specimens assigned to this group (both ambiguous and unambiguous) were predicted to be classified correctly after jackknife resampling.

Figure 9. Selection of Skiagia specimens from the LDA plot (Fig. 8). Magnified areas show detail of process morphologies. A–E, Skiagia scottica; F–J, Skiagia ciliosa; K–O, Skiagia orbiculare; P–T, Skiagia compressa; U–Y, Skiagia ornata. All specimens are deposited in the Natural History Museum of Denmark, Copenhagen, and have the following numbers: A, MGUH 33976; B, MGUH 33977; C, MGUH 33978; D, MGUH 33979; E, MGUH 33980; F, MGUH 33981; G, MGUH 33982; H, MGUH 33983; I, MGUH 33984; J, MGUH 33985; K, MGUH 33986; L, MGUH 33987; M, MGUH 33988; N, MGUH 33989; O, MGUH 33990; P, MGUH 33991; Q, MGUH 33992; R, MGUH 33993; S, MGUH 33994; T, MGUH 33995; U, MGUH 33996; V, MGUH 33997; W, MGUH 33998; X, MGUH 33999; Y, MGUH 34000. Scale bars, 10 μm; in magnified areas, 5 μm.
Overall, the morphological range of S. scottica is best defined by P ft and P E, while P L chiefly governs the trend from S. ciliosa to S. ornata/S. compressa. While a number of other parameters appear to be useful descriptors of between-species variation (e.g., D A, P F, P bt), the ability of T V and P S to capture differences between Skiagia species seems to be limited in the current setting (Figs. 4, 6, Supplementary Fig. 3).
Quantitative Analysis of Life Cycle Structures
Various developmental stages have been identified in the studied Skiagia population, being chiefly evidenced by the presence of excystment (opened vesicles) and encystment structures (vesicles enclosing an internal body; Moczydłowska Reference Moczydłowska2010, Reference Moczydłowska2016; Fig. 10). Potential outer membranes have been recognized as optically faint, light-colored, but clearly delineated agglomerations of structureless organic matter between the processes of a few S. scottica specimens (Fig. 10A) and transitional forms between S. scottica and S. ciliosa (Fig. 10B,C). These structures have not been retained for quantitative study owing to their scarcity and the likelihood of confusion between the widely flaring tips of S. scottica and any potential overlying, thin-walled membrane.

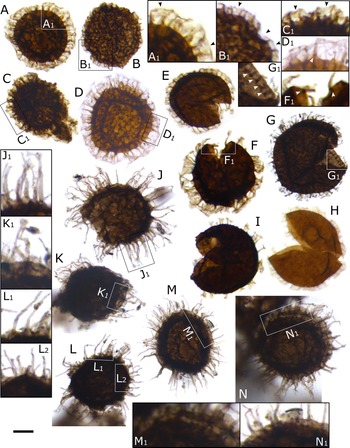
Figure 10. Life cycle structures among Skiagia species. A–C, possible outer membranes (black arrowheads) in Skiagia scottica (A) and transitional forms between S. scottica and Skiagia ciliosa (B, C). D, Closed S. scottica vesicle. E–J, Opened vesicles attributed to S. scottica (E, F), transitional forms between S. scottica and S. ciliosa (G, H), S. ciliosa (I), and Skiagia compressa (J). K, L, Dark to opaque inner bodies in vesicles attributed to Skiagia ornata (K) and S. compressa (L). M, N, Translucent inner bodies in transitional forms between S. compressa and S. ornata. White arrowheads point to plug-like structures. All specimens are deposited in the Natural History Museum of Denmark, Copenhagen, and have the following numbers: A, MGUH 34001; B, MGUH 34002; C, MGUH 34003; D, MGUH 34004; E, MGUH 34005; F, MGUH 34006; G, MGUH 34007; H, MGUH 34008; I, MGUH 34009; J, MGUH 34010; K, MGUH 34011; L, MGUH 34012; M, MGUH 34013; N, MGUH 34014. Scale bars, 10 μm; in magnified areas, 5 μm.
Internal bodies can be divided into two groups: dark to opaque, clearly defined subrounded structures (Fig. 10K,L) similar to previously described endocysts (e.g., Zang et al. Reference Zang, Moczydłowska and Jago2007: figs. 12A,D, and 14A,B,D; Moczydłowska Reference Moczydłowska2010); and more translucent, lighter-colored subspherical bodies (Fig. 10M,N). Translucent endocysts in Skiagia have previously been reported from the thermally unaltered Lükati Formation (Estonia; Moczydłowska Reference Moczydłowska2010), but are easily confused with circular series of compression folds or shriveled cytoplasm. The translucent endocysts included in this analysis differ from compression folds in showing higher optical density than the surrounding vesicle at any point within the outline of the inner body (Fig. 10M,N).
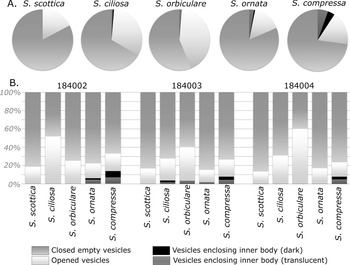
Dark to opaque endocysts were largely restricted to the S. compressa population (Fig. 11, Supplementary Table 2) and completely absent in vesicles attributed to S. scottica and S. orbiculare. Overall encystment rate (proportion of internal bodies, either dark or translucent) was found to be increasing throughout the S. scottica–S. ornata/S. compressa morphological gradient (Fig. 11A), being null in S. scottica, extremely low in S. ciliosa and S. orbiculare (1.29% and 1.25%, respectively), intermediate in S. ornata (3.21%), and highest in S. compressa (9.4%; Supplementary Table 2). The scarcity of inner bodies inevitably leads to differences in counts between individual samples (Fig. 11B); however, the encystment rate was found to be invariably highest in S. compressa.

Figure 11. Distribution of life cycle structures among Skiagia species. A, Pie charts of life cycle structures in Skiagia scottica (n = 93), Skiagia ciliosa (n = 155), Skiagia orbiculare (n = 80), Skiagia compressa (n = 266), and Skiagia ornata (n = 156); all samples combined (N = 750). B, Stacked charts of life cycle structures among species in GGU samples 184002, 184003, and 184004; 250 specimens were counted in each sample. Raw data are available in Supplementary Table 2.
Excystment structures have been observed in all five Skiagia species but were found to be invariably rarest in the S. ornata population (Fig. 11), occurring in just 15.38% of vesicles. Opened vesicles were also relatively rare in the studied S. compressa population (17.67% on average). The excystment rate was found to increase from S. scottica to S. orbiculare (Fig. 11A), thereby replicating observed patterns of between-species variation (Fig. 8, Supplementary Fig. 6). GGU sample 184002 exhibits a slightly different excystment pattern (Fig. 11B), with S. ciliosa showing the highest proportion of opened vesicles.
Despite slight differences in taxonomic composition between sampled levels (Fig. 1C; Supplementary Fig. 7), total encystment and excystment rates were found to be similar in all three samples, ranging from 3.2% to 5.6% for the former and 20.8% to 25.2% for the latter (Supplementary Table 2).
Discussion
Multivariate morphometric analysis of Skiagia-plexus acritarchs from North Greenland revealed an uninterrupted spectrum of forms between five morphospecies: Skiagia scottica, Skiagia ciliosa, Skiagia orbiculare, Skiagia compressa, and Skiagia ornata. Importantly, the main aspects of this pattern are captured by all studied samples using LDA, PCA, and an independent analysis of encystment and excystment structures, demonstrating its robustness to the uncertainties of group attribution and any potential small-scale paleoenvironmental and/or stratigraphic variations. The absence of obvious morphological clustering across the studied sequence of Skiagia species suggests that (1) the species-level subdivision of the genus Skiagia is arbitrary and questions its use in biostratigraphy; (2) a mixture of ontogenetic, taphonomic, paleoenvironmental, and paleoecological factors likely control the morphospace occupation of Skiagia acritarchs; and (3) Skiagia species counts do not offer an impartial measure of morphological or taxonomic diversity.
A Morphometric Approach to Clarifying Skiagia Form Taxonomy and Its Biostratigraphic Applications
Our analysis has revealed extended areas of overlap between Skiagia species, accounting for as much as ca. 35% misclassifications in S. ornata and S. orbiculare (Table 1). Intermediate morphotypes have been recognized previously within the genus Skiagia, including between S. ornata and S. orbiculare, S. ciliosa and S. compressa, and across the S. scottica‒S. ornata‒S. compressa plexus (Moczydłowska Reference Moczydłowska1991; Moczydłowska and Willman Reference Moczydłowska and Willman2009). This study builds upon these observations, shedding light on the extent and origins of within-species and between-species variance. The clear difference between LDA and PCA ordination patterns implies that form species have not been defined based on directions of maximum variance, which appears to be largely driven by parameters susceptible to thermal alteration (T V, P S; Figs. 4, 5). Instead, the species-level subdivision of Skiagia discretizes a continuous morphological sequence driven by a subtle combination of parameters more or less susceptible to fragmentation and deformation (Figs. 6, 8). Among those, widely used diagnostic features such as P L, P ft, or P bt were shown to be important descriptors of variation between individual species in the current setting, but are also usefully complemented by subordinate characters that do not feature prominently in Skiagia diagnoses; namely, D A, P D, P E, P F, and P t. Regardless of the exact origins of observed intra- and interspecific disparity, the absence of clear groupings within the morphological range of Skiagia points to the arbitrariness of species-level taxonomic boundaries, which have yet to be defined on a morphometric basis.
Although care has been taken to select the best-preserved specimens, the effect of taphonomy on these patterns is likely to be important, not least given the susceptibility of process morphology to breakage and deformation. Scanning electron microscopy studies have indeed revealed conical process bases in S. scottica and S. ornata, which have tentatively been interpreted as resulting from the secondary collapse of the vesicle wall (Moczydłowska Reference Moczydłowska2011). This likely explains the wide morphological range of specimens attributed to S. compressa and S. ciliosa, in which the diagnostically conical process bases may derive from the secondary alteration of a variety of Skiagia form species. In addition to basal process inflation, the large intraspecific variability of S. scottica may also derive from the taphonomic separation and erosion of its process tips, as is suggested by its wide range of P ft and P E values (Fig. 6D,H) and light microscopic observations (Fig. 9A,C,D).
A key finding of this analysis is that specimens of S. ciliosa share a substantial portion of their morphological range with specimens attributed to S. scottica (Fig. 8). Although partly attributable to the taphonomic processes highlighted above, the conspicuous overlaps between these two species echo a long-recognized similarity in gross morphology (Knoll and Swett Reference Knoll and Swett1987; Young et al. Reference Young, Martin, Dean and Rushton1994: fig. 10m). The interspecific morphological variance between S. ciliosa and S. scottica appears to be of a similar magnitude to the intraspecific variability seen within the S. ciliosa taxon itself (Downie Reference Downie1982; Fig. 8). Three different morphotypes of S. ciliosa have been previously defined based on process length and width, which show continuous variation (Hagenfeldt Reference Hagenfeldt1989; Moczydłowska Reference Moczydłowska1991). The basal process plug seems to be the only feature uniting these morphotypes to S. ciliosa, yet similar structures are known from S. compressa (Downie Reference Downie1982; Talyzina and Moczydłowska Reference Talyzina and Moczydłowska2000; Moczydłowska Reference Moczydłowska2011), S. ornata (Moczydłowska and Vidal Reference Moczydłowska and Vidal1986: fig. 11C,D; Hagenfeldt Reference Hagenfeldt1989), S. orbiculare (Zang Reference Zang, Alexander, Jago, Rozanov and Zhuravlev2001; Brück and Vanguestaine Reference Brück and Vanguestaine2004), and S. scottica (Downie Reference Downie1982; Zang Reference Zang, Alexander, Jago, Rozanov and Zhuravlev2001). At the conventional resolution of light microscopy, identification of a separation between processes and the central body is particularly challenging among acritarchs that possess thin, short, and/or numerous processes with a thick-walled central body (e.g., in S. ciliosa morphotype A; Fig. 9F–H). In the studied population, plug-like structures have been observed sporadically in a least four different species, namely S. scottica (Fig. 10D,F), S. ciliosa (Figs. 2C, 9I, 10G), S. compressa (Figs. 2E,G, and 9S) and S. ornata (Fig. 2F). The absence of reliable systematic criteria to define the S. ciliosa taxon and its morphotypes stands in sharp contrast with the ease of identification that is expected from an index fossil, a property that has frequently been attributed to S. ciliosa (Moczydłowska and Zang Reference Moczydłowska and Zang2006; Palacios et al. Reference Palacios, Högström, Ebbestad, Agić, Høyberget, Jensen, Meinhold and Taylor2020). The morphometric approach adopted here demonstrates that, in a population where the taxonomic significance of basal process plugs appears to be limited, specimens with short processes clearly expanded at the base tend to be more convincingly distinguished from the morphological range of S. scottica and S. orbiculare (Figs. 8, 9H). However, the taxonomic and biostratigraphic significance of this region of the morphospace remains to be formally assessed through a detailed account of disparity among Skiagia populations from successive biozones.
The morphological continuum identified in this study is bounded by our narrow sampling window but can be extended to other acritarch species and genera. For instance, the very slightly flaring process tips of Skiagia brevispinosa Downie, Reference Downie1982 may in fact constitute a transitional form uniting Skiagia with other acritarchs such as Baltisphaeridium cerinum, which features in the S. ciliosa synonymy list (Moczydłowska Reference Moczydłowska1991). Breakage of Skiagia processes at their tips results in conspicuous Baltisphaeridium morphologies (Zang et al. Reference Zang, Moczydłowska and Jago2007: fig. 14A–E), while truncation at the base may result in vesicles adorned with thick cones resembling the solid processes of Globosphaeridium cerinum (Moczydłowska and Vidal Reference Moczydłowska and Vidal1986: fig. 9C–F; Vidal and Moczydłowska Reference Vidal and Moczydłowska1996: fig. 11.4; Yin et al. Reference Yin, Zhao, Yang and Peng2010: fig. 4a,b,g,l; Palacios et al. Reference Palacios, Högström, Ebbestad, Agić, Høyberget, Jensen, Meinhold and Taylor2020: fig. 8e–f). At another end of the Skiagia morphological spectrum, the extremely regular outline of S. scottica occasionally exhibits conspicuous similarities with pteromorph-like acritarchs such as Fimbriaglomerella (compare Fig. 10A,F with Moczydłowska and Vidal Reference Moczydłowska and Vidal1988: figs. 1.5–6). Regardless of their potential origin(s), these striking connections between disparate collections of form taxa tend to suggest that a high level of taxonomic confusion (and potentially inflation) exists beyond that evidenced within the genus Skiagia and would warrant a critical evaluation of taxonomic boundaries and co-occurrence patterns using morphometric means (e.g., Stricanne and Servais Reference Stricanne and Servais2002; Wang et al. Reference Wang, Monnet and Servais2017; Yan et al. Reference Yan, Li, Molyneux, Raevskaya and Servais2017; Kroeck et al. Reference Kroeck, Blanchon, Zacaï, Navidi-Izad, Benachour, Monnet, Raevskaya, Szczepanik and Servais2020).
Reconstructing the Life Cycle of Skiagia-plexus Acritarchs
The consistency of the Skiagia morphotype sequence identified in this study using either morphological (Fig. 8, Supplementary Figs. 4, 6) or ontogenetic parameters (Fig. 11) demonstrates that the species-level classification of Skiagia does capture certain elements of phytoplankton paleobiology. Acritarchs have previously been compared to modern phytoplanktonic analogues, including dinoflagellates (e.g., Colbath and Grenfell Reference Colbath and Grenfell1995; Talyzina et al. Reference Talyzina, Moldowan, Johannisson and Fago2000; Servais et al. Reference Servais, Li, Molyneux and Raevskaya2003, Reference Servais, Stricanne, Montenari and Pross2004, Reference Servais, Lehnert, Li, Mullins, Munnecke, Nuetzel and Vecoli2008; Vecoli and Le Hérissé Reference Vecoli and Le Hérissé2004) and green algae (e.g., Colbath and Grenfell Reference Colbath and Grenfell1995; Kaźmierczak and Kremer Reference Kaźmierczak and Kremer2009; Moczydłowska Reference Moczydłowska2010, Reference Moczydłowska2016; Moczydłowska et al. Reference Moczydłowska, Landing, Zang and Palacios2011; Agić et al. Reference Agić, Moczydłowska and Yin2015; Shang et al. Reference Shang, Liu, Moczydłowska and Yang2020). In particular, Moczydłowska (Reference Moczydłowska2010) interpreted the continuous morphological range of the Skiagia acritarch plexus as representing various encysted stages of the life cycle of one or several species of chlorophycean microalgae. In this model, the first stage, fully planktonic, consists of a vegetative cell that may be represented in the fossil record by a simple sphearomorph (e.g., Leiosphaeridia). In a second stage, a cyst is formed within the mother cell or zygote by shrinkage of the cytoplasm, resulting in a morphology reminiscent of S. scottica. The vegetative cell and its internal cyst remain in the water column until maturation. At this stage, the outer cell membrane is lost to release the cyst, which sinks to bottom sediments, develops an endocyst, and enters a period of dormancy. This third stage is represented in the fossil record by occurrences of S. ornata enclosing a dark internal body (e.g., Moczydłowska Reference Moczydłowska2002: fig. 8.1; Zang et al. Reference Zang, Moczydłowska and Jago2007: fig. 12A,D). The endocyst is then released into the water column after rupture of the cyst in a fourth stage, to later produce multiple offspring (swarmers) or a single cell that later grows into a new vegetative adult.
Although outer membranes are so far unknown from the taxon S. scottica, it has previously been suggested that the wide and flat process tips of this taxon used to be attached to a fragile vegetative cell (Moczydłowska Reference Moczydłowska2010). Close inspection of the exquisitely preserved S. scottica population studied here has revealed areas of light-colored, structureless organic material surrounding the processes (Fig. 10A), a potential residual product of a degraded labile outer envelope. Interestingly, similar structures have been observed among transitional forms from S. scottica to S. ciliosa showing unequal processes (Fig. 10B,C). Although these observations tend to confirm the tight relationships between these species and their immature development, both form taxa exhibit unambiguous excystment structures (Fig. 10E–I), while S. ciliosa occasionally develops an endocyst (Volkova Reference Volkova, Rozanov, Missarzhevskij and Volkova1969; Downie Reference Downie1982; Palacios et al. Reference Palacios, Högström, Ebbestad, Agić, Høyberget, Jensen, Meinhold and Taylor2020; Fig. 11, Supplementary Table 2). The presence of multiple stages in the population of each Skiagia species and their relative frequency distribution evidences a complex relationship between them which can hardly be accommodated in a single, regular life cycle.
Most notably, the studied S. ornata/S. compressa population appears to stand out from other species in terms of excystment rates, endocyst development, and overall morphology (Figs. 4, 8, 11, Table 1), which suggests it captures a distinct type of life cycle, possibly from a distinct biological taxon. In particular, S. compressa was the only species yielding a robust population of endocysts, a feature only rarely observed among Skiagia (e.g., Moczydłowska et al. Reference Moczydłowska, Jensen, Ebbestad, Budd and Marti-Mus2001; Moczydłowska Reference Moczydłowska2002, Reference Moczydłowska2010; Zang et al. Reference Zang, Moczydłowska and Jago2007; Palacios et al. Reference Palacios, Jensen, Barr, White and Miller2017, Reference Palacios, Högström, Ebbestad, Agić, Høyberget, Jensen, Meinhold and Taylor2020; Supplementary Table 2). It seems, therefore, that endocyst formation is not an obligate stage in the life cycle of Skiagia-plexus acritarchs and may instead record occasional environmentally driven alterations of a more conventional life cycle, in which the addition of a second encystment stage ensures an enhanced protection of offspring cells until the return of more favorable conditions. It is also tempting to recognize the recorded variation in the opacity of the internal body as various degrees of endocyst maturation, being most advanced in cysts having undergone longer resting periods. Analogies with modern dinoflagellates indeed suggest that the degree of maturation attained at the end of the period of dormancy correlates with process length and morphology (Kokinos and Anderson Reference Kokinos and Anderson1995; Servais et al. Reference Servais, Stricanne, Montenari and Pross2004). This may provide a reliable explanation for the morphological and ontogenetic gradient studied here, culminating in large, encysted vesicles adorned with long processes showing moderately widened bases (Figs. 6, 8, 9). In spite of their apparently mature morphologies, S. ornata and S. compressa were found to be relatively rarely opened in the studied assemblages (Fig. 11). Failure to release offspring cells after reaching maturity is once again consistent with the interpretation of endocysts as forming a circumstantial ontogenetic stage induced by unusually long periods of environmental stress (e.g., episodes of anoxia, nutrient starvation, or light or temperature stress). As seen in modern dinoflagellate populations (e.g., Rengefors and Anderson Reference Rengefors and Anderson1998; Kremp and Anderson Reference Kremp and Anderson2000; Bravo and Figueroa Reference Bravo and Figueroa2014), such conditions would force cysts to undergo longer periods of growth in the benthic environment, eventually prohibiting their germination. In this respect, the appearance of endocysts in Skiagia assemblages from the Heliosphaeridium dissimilare–Skiagia ciliosa Zone (Palacios et al. Reference Palacios, Högström, Ebbestad, Agić, Høyberget, Jensen, Meinhold and Taylor2020) may be regarded as a biostratigraphically significant event toward the evolution of complex phytoplanktonic reproduction strategies, demonstrating an advanced mechanism of phenotypic and developmental adaptation to protracted adverse conditions.
It should be stressed that the recorded disparity of Skiagia form species and their respective encystment and excystment structures is compatible with the presence of one or several biological species in the studied assemblage. The complexity of phytoplankton lifestyles and their susceptibility to environmental and ecological factors (Sandgren Reference Sandgren1983; Anderson et al. Reference Anderson, Kulis and Binder1984; Kokinos and Anderson Reference Kokinos and Anderson1995; Rengefors et al. Reference Rengefors, Karlsson and Hansson1998; Luo et al. Reference Luo, Krienitz, Pflugmacher and Walz2005; Thornber Reference Thornber2006; Figueroa et al. Reference Figueroa, Bravo and Garcés2008) implies that morphology-based taxonomic classification systems do not provide a satisfactory delimitation of biological species (e.g., Bold Reference Bold1974; Kokinos and Anderson Reference Kokinos and Anderson1995). Although our narrow sampling window offers the prospect of clarifying multiple sources of morphological variation, the limitations of applying these quantitative approaches to uncover true taxonomic diversity should be acknowledged.
Refining Our Understanding of Acritarch Diversity
Despite the uncertain affinity of acritarchs and their informal classification scheme, acritarch taxonomic counts have previously been used as a measure of species richness to construct phytoplankton diversity curves at various spatial and temporal scales (Tappan and Loeblich Reference Tappan and Loeblich1973; Vidal and Knoll Reference Vidal and Knoll1982; Knoll Reference Knoll1994; Strother Reference Strother, Jansonius and McGregor1996, Reference Strother2008; Vidal and Moczydłowska-Vidal Reference Vidal and Moczydłowska-Vidal1997; Moczydłowska Reference Moczydłowska1998, Reference Moczydłowska2011; Vecoli and Le Hérissé Reference Vecoli and Le Hérissé2004; Knoll et al. Reference Knoll, Javaux, Hewitt and Cohen2006; Li et al. Reference Li, Servais, Yan and Su2007; Mullins and Servais Reference Mullins and Servais2008; Klug et al. Reference Klug, Kröger, Kiessling, Mullins, Servais, Frýda, Korn and Turner2010; Lei et al. Reference Lei, Servais and Feng2013; Cohen and Macdonald Reference Cohen and Macdonald2015; Nowak et al. Reference Nowak, Servais, Monnet, Molyneux and Vandenbroucke2015; Riedman and Sadler Reference Riedman and Sadler2018; Zheng et al. Reference Zheng, Clausen, Feng and Servais2020). As the limitations of acritarch form taxonomy have widely been acknowledged, these curves have traditionally been regarded as preservable portions of morphological diversity (i.e., disparity; e.g., Knoll Reference Knoll1994; Cohen and Macdonald Reference Cohen and Macdonald2015) or coarse estimates of true taxonomic diversity (e.g., Vidal and Moczydłowska-Vidal Reference Vidal and Moczydłowska-Vidal1997; Zheng et al. Reference Zheng, Clausen, Feng and Servais2020). The continuous sequence of Skiagia species studied here describes a substantial portion of the total variance (Fig. 4) which, at best, suggests that form-taxonomic counts offer an arbitrary measure of disparity worth five units in the current setting. However, the likelihood of taxonomic confusion resulting from the lack of clear boundaries between form species and genera (e.g., Baltisphaeridium) imposes a relatively high degree of uncertainty to this metric. It seems, therefore, that the form-taxonomic subdivision of Skiagia-plexus acritarchs currently fails to provide an accurate measure of intrageneric disparity, let alone diversity. Cases of taxonomic inconsistencies and transitional forms in other acritarch genera (e.g., Stricanne and Servais Reference Stricanne and Servais2002; Vanguestaine Reference Vanguestaine2002; Servais et al. Reference Servais, Stricanne, Montenari and Pross2004; Kroeck et al. Reference Kroeck, Eriksson, Lindskog, Munnecke, Dubois, Régnier and Servais2021) further question the reliability of form-taxonomic counts as proxies for standing diversity (either morphological or taxonomic).
Whether these form-taxonomic diversity metrics are able to capture significant paleobiological trends beyond additional taphonomic and sampling biases remains to be determined. Phytoplankton and metazoan diversity curves occasionally show some parallel trends in the Cambrian (Nowak et al. Reference Nowak, Servais, Monnet, Molyneux and Vandenbroucke2015; Zheng et al. Reference Zheng, Clausen, Feng and Servais2020), but the exact nature of these isolated correspondences is obscured by the fundamental difference between metazoan and phytoplankton diversity units. Indeed, because the definition of acritarch morphospecies lacks a phylogenetic or paleobiological basis, acritarch diversity does not approximate standing diversity in the manner that natural metazoan groupings do (Butterfield Reference Butterfield2004). Any correlation between the metazoan and phytoplankton diversity records should therefore be interpreted with caution. For instance, the sharp rise of acritarch diversity marking the early Cambrian (Vidal and Nystuen Reference Vidal and Nystuen1990; Moczydłowska Reference Moczydłowska2002, Reference Moczydłowska2011; Nowak et al. Reference Nowak, Servais, Monnet, Molyneux and Vandenbroucke2015; Zheng et al. Reference Zheng, Clausen, Feng and Servais2020) may be partly attributable to a net increase in the number of biological species, but also to the emergence of more complex heteromorphic life cycles (e.g., Thornber Reference Thornber2006) and an increased likelihood of taxonomic splitting across portions of developmental sequences. Although acritarch diversity curves indirectly capture true, evolutionarily significant events (Cambrian radiation of eukaryotic phytoplankton, alternation of generations in life cycles, developmental adaptability, etc.), form-taxonomic counts and their systematic biases do not offer straightforward pathways to uncover biological diversity, nor do they provide accurate measures of evolutionary tempo.
The problems surrounding these taxonomic counts have triggered a search for alternative measures of diversity, with an increased focus on key characters elucidating cell function and development (Huntley et al. Reference Huntley, Xiao and Kowalewski2006; Knoll et al. Reference Knoll, Javaux, Hewitt and Cohen2006; Moczydłowska Reference Moczydłowska2011; Cohen and Macdonald Reference Cohen and Macdonald2015). Even so, these elements of phytoplankton paleobiology have often been highlighted (Moczydłowska Reference Moczydłowska2011) or coarsely quantified (Knoll et al. Reference Knoll, Javaux, Hewitt and Cohen2006; Cohen and Mcdonald Reference Cohen and Macdonald2015) on top of conventional form-species richness and its inevitable reliance on arbitrary taxonomic practices. The morphometric approach developed by Huntley et al. (Reference Huntley, Xiao and Kowalewski2006) is unique in that it proposes disparity measures that are fully independent from taxonomic subdivisions or presumed phylogenetic affinities, being defined based on a universal presence–absence character matrix. An inevitable caveat of these methods is their dependence on the choice of characters used for dissimilarity and variance calculations, each trait being given equal weight regardless of its paleobiological significance. The results of this study show that, in addition to discrete features (e.g., endocysts and excystment structures), acritarch vesicles exhibit continuous morphological variations that may result from a complex life cycle and/or record adaptations to local environmental or paleoecological conditions. Application of similar morphometric techniques to specimens from elsewhere may help clarify the patterns of disparity exhibited by acritarch taxa within and beyond the genus Skiagia, revealing the key morphological traits that underpin them, and perhaps providing clues on their affinities and adaptive significance.
Conclusions
The uncertain and polyphyletic nature of Cambrian acritarchs constitutes a persistent obstacle to establishing consistent classification systems. Here we used a quantitative approach to clarify the morphological basis of the species-level taxonomy of acritarchs from the genus Skiagia and assessed its paleobiological significance. The following key findings have been brought to light:
• The species-level classification of Skiagia acritarchs discretizes a continuous suite of morphologies.
• The arbitrariness of species boundaries is a source of taxonomic and biostratigraphic confusion.
• The species-level classification of Skiagia acritarchs does reflect certain elements of phytoplankton paleobiology, including the relative contribution of ontogenetic, paleoenvironmental, and paleoecological factors on process morphology.
• Skiagia form-taxonomic counts do not provide unequivocal measures of true diversity or disparity.
Similar morphometric analyses of acritarch populations worldwide hold great promise to clarify the multivariate disparity of acritarch form taxa and refine their boundaries based on consistent patterns of stratigraphic and/or paleoenvironmental variation. Continued exploration of phenotypic plasticity among Cambrian acritarchs would greatly refine our understanding of these problematic fossils, and by extension our knowledge of the earliest Phanerozoic-style primary producers.
Acknowledgments
M. Moczydłowska-Vidal and J. S. Peel are thanked for guidance and help in interpreting the material and the geology. Samples were collected during fieldwork supported by the Geological Survey of Greenland. B.J.S. acknowledges the support of Swedish Research Council (VR) grant 2020-03314. H. Agić, J. W. Huntley, and an anonymous reviewer are thanked for their constructive feedback on a previous version of this paper.
Data Availability Statement
Data available from the Dryad Digital Repository: https://doi.org/10.5061/dryad.zs7h44jbv.


 Open access