


Introduction
The Sunda Islands of the Indonesian archipelago are amongst the world's most biologically diverse regions (Myers et al., Reference Myers, Mittermeier, Mittermeier, da Fonseca and Kent2000). Island biodiversity is particularly threatened by habitat loss and conversion, overexploitation and invasive species, and more recently by effects of anthropogenic climate change (Fordham & Brook, Reference Fordham and Brook2010). Conservation of island endemics is thus of paramount importance to the preservation of biodiversity in South-east Asia.
The island of Bawean is a small volcanic remnant in the Java Sea, separated from mainland Java for c. 10,000 years (Meijaard, Reference Meijaard2003). Its most prominent endemic mammals are the Critically Endangered Bawean deer Axis kuhlii and the Endangered Bawean warty pig Sus verrucosus blouchi. Populations of these species are believed to be small but stable (Bawean deer: 250–300, Semiadi et al., Reference Semiadi, Duckworth and Timmins2015; Bawean warty pig: 177–377, Rademaker et al., Reference Rademaker, Meijaard, Semiadi, Blokland, Neilson and Rode-Margono2016). The Bawean warty pig has no protected status but the Bawean deer is protected by Indonesian law (Lampiran Peraturan Pemerintah Nomor 7 Tahun 1999 & Undang-Undang No. 5 Tahun 1990), is listed on CITES Appendix I (CITES, 2017) and is one of 25 species that the Indonesian government considers to be in need of special conservation attention (decree SK.180/IV-KKH/2015; Ministry of Environment and Forestry, 2015). The primary threat to the deer is thought to be the small size of the population (Semiadi et al., Reference Semiadi, Duckworth and Timmins2015), with a potentially decreased genetic diversity (Rahman et al., Reference Rahman, Gonzalez and Aulagnier2017a), and hunting or stress caused by feral hunting dogs (Nursyamsi, pers. comm.; Drygala & Semiadi, pers. comm.; Rahman et al., Reference Rahman, Gonzalez and Aulagnier2017a). Bawean warty pigs are actively hunted to protect crops from damage (Nijman, Reference Nijman2003; Rademaker, Reference Rademaker2016).
Apart from a 9-month camera-trap survey for Bawean deer in 2014 (Rahman et al., Reference Rahman, Gonzalez and Aulagnier2017a) and a survey for Bawean warty pigs in 2015 (Rademaker et al., Reference Rademaker, Meijaard, Semiadi, Blokland, Neilson and Rode-Margono2016), there has been no long-term study of the mammal biodiversity of Bawean. As a result, no data are available about the ecology and behaviour of wild populations of the island's threatened endemic species (but see Rode-Margono et al., Reference Rode-Margono, Diana, Zahra, Istiqomah, Lutfi and Leo2016a), which hinders effective conservation planning.
The aims of our 13-month camera-trap study on Bawean Island were to (1) provide relative encounter rates for all recorded species, (2) produce absolute population estimates for the Bawean warty pig, (3) investigate which habitat and environmental factors influence relative encounter rates, (4) examine activity patterns, social structure and reproductive patterns, and (5) compare our results for the Bawean deer to those of Rahman et al. (Reference Rahman, Gonzalez and Aulagnier2017a).
Study area
The 196 km2 island of Bawean, in the Java Sea, is dominated by semi-evergreen forest, with a dry season during June–November and a wet season during December–May (Hamada et al., Reference Hamada, Yamanaka, Matsumoto, Fukao, Winarso and Sribimawati2002). Central to the island is an extinct volcano, which reaches 655 m altitude. All remaining forests on Bawean are encompassed within the 46.6 km2 Bawean Island Nature Reserve and Wildlife Sanctuary and are under varying levels of protection (Semiadi & Meijaard, Reference Semiadi and Meijaard2013; Fig. 1a).
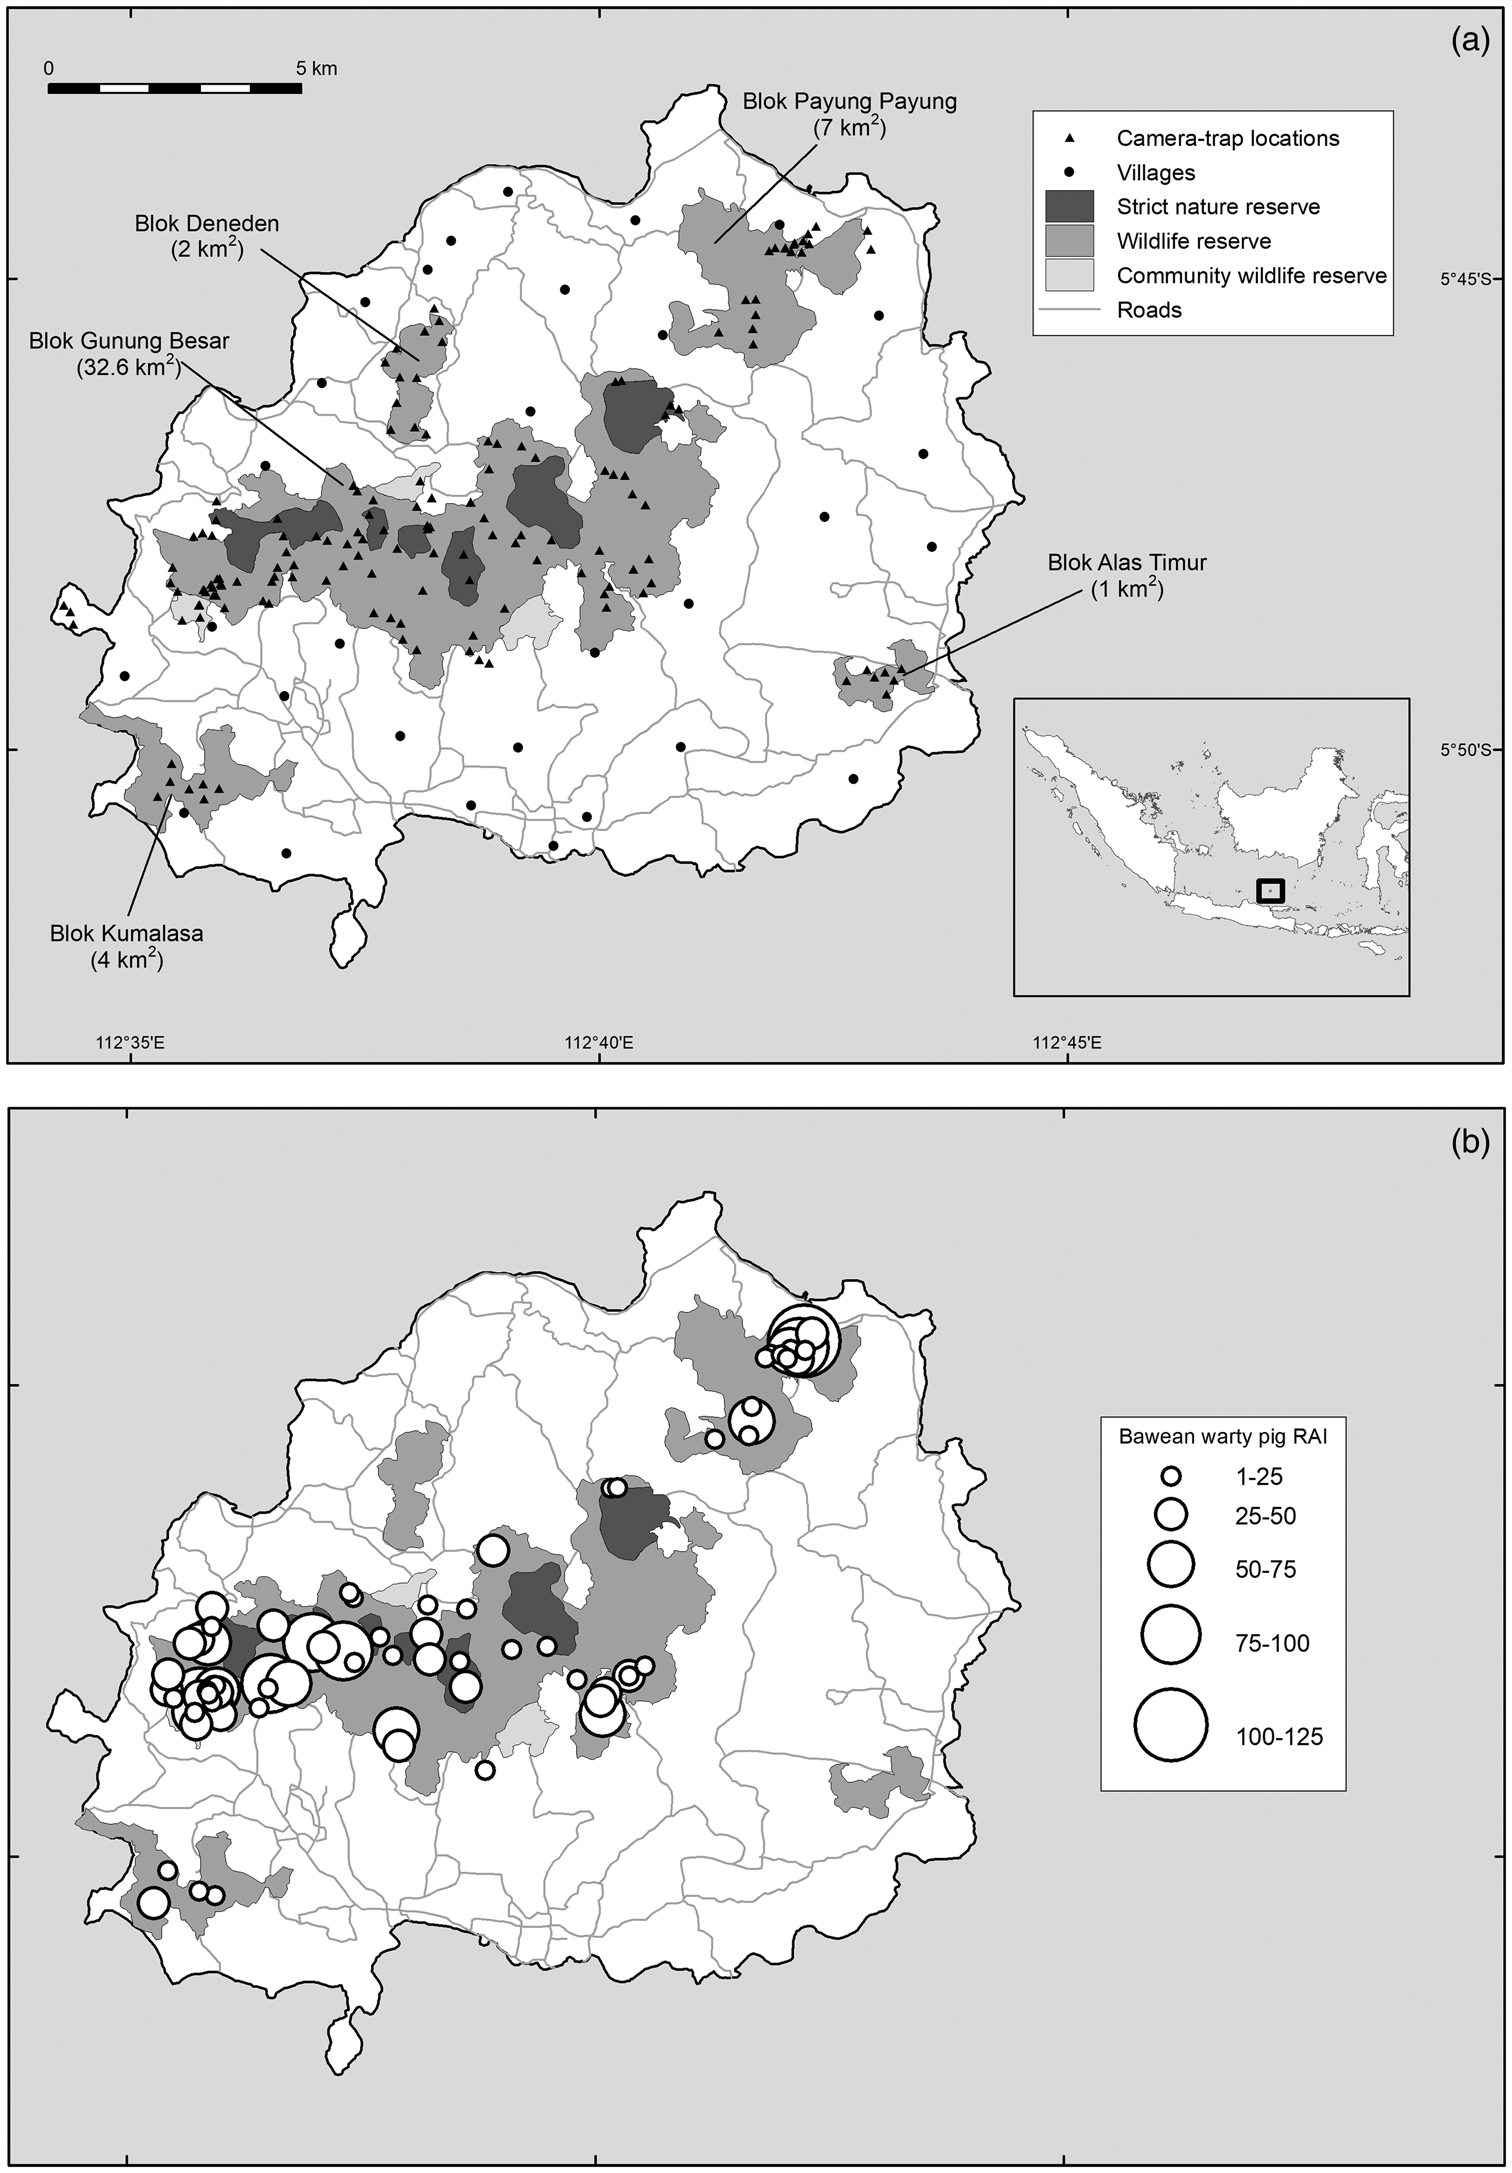
Fig. 1 (a) Protected area zonation on Bawean Island (largely coinciding with forest boundaries), fragments of protected area (known as Bloks), and camera-trap locations used in this study, and (b) records of the Bawean warty pig Sus verrucosus blouchi, where the size of the circles indicates the relative abundance index (RAI) at a camera trap (defined as number of detections at a camera trap over all days, multiplied by 100 and divided by the total number of camera-trap nights).
Methods
Data collection
Camera trapping took place during November 2014–December 2015. We divided the forested area into 3,636 grid cells of 100 × 100 m, and selected cells randomly as locations for 23 camera traps (Long Range IR/E2, Cuddeback, De Pere, USA), which were moved periodically between locations. During August–October, because of increasing concern about the low numbers of deer recorded up to then, we set five camera traps preferentially for deer, based on local advice. We assumed these locations were still random for warty pigs. To prevent spatial autocorrelation, camera traps were spaced at least 150 m apart. In small forest fragments, because of difficult terrain, we selected the first random point and then placed subsequent camera traps every 300 m in a randomly generated direction. We set camera traps to record 30-s videos, with a 1-minute interval until the next trigger.
At each camera trap location we recorded the latitude and longitude (with a global positioning system), altitude and habitat variables. These included the major habitat type (rice cultivation: n = 18; garden cultivation: n = 7; shrubland and degraded forest: n = 7; teak plantation: n = 10; tall forest: n = 76; community forest: n = 8; for definitions see Rademaker et al., Reference Rademaker, Meijaard, Semiadi, Blokland, Neilson and Rode-Margono2016), mean tree diameter at breast height, mean tree height in a 10 × 10 m plot around the camera-trap location, and tree density using the T-square method (Rode et al., Reference Rode, Stengel, Nekaris, Blair, Sterling and Bynum2013) with two sample points (for details see Rademaker et al., Reference Rademaker, Meijaard, Semiadi, Blokland, Neilson and Rode-Margono2016). We calculated the mean litter depth in four 1 × 1 m subplots in the corners of the plot. Distances to the nearest village and protected area border (approximately coinciding with the forest border) were calculated in ArcGIS v. 10.0 (ESRI, Redlands, USA). Minimum and maximum daily temperatures and precipitation data were obtained from Sangkapura meteorological station. Lunar illumination was retrieved from MOONDV v. 1 (Thomas, Reference Thomas1998). For the random encounter model, we also recorded the angle of detection, radial distance at detection and distance travelled for the first three video records of Bawean warty pigs on each camera (Rowcliffe et al., Reference Rowcliffe, Carbone, Jansen, Kays and Kranstauber2011). We assumed these parameter values to be valid throughout the trapping period.
Data analysis
We report relative abundance for all species encountered, with the relative abundance index (RAI) defined as all independent detections of a given species summed for all camera traps over all days, multiplied by 100, and divided by the total number of camera-trap nights (O'Brien et al., Reference O'Brien, Kinnaird and Wibisono2003). We employed a 1-hour interval to define independent events (Rovero et al., Reference Rovero, Collett, Ricci, Martin and Spitale2013; Rademaker et al., Reference Rademaker, Meijaard, Semiadi, Blokland, Neilson and Rode-Margono2016). As data were not normally distributed and could not be transformed, we used non-parametric Kruskal–Wallis tests and Mann–Whitney U post-hoc tests to check for differences in relative abundance index between seasons and locations. For the influence of habitat variables on encounter rates, we report single-season occupancy modelling outcomes using the R v. 3.4.3 (R Core Team, 2013) package unmarked (Fiske & Chandler, Reference Fiske and Chandler2011). We removed records that were incomplete because of missing covariate values. Models assessed the effects of all previously described site-level covariates on probability of occupancy, and the effects of the observation-level covariates moonlight, temperature and rainfall on probability of detection. Sample sizes for Bawean deer were too small to run these analyses.
To estimate population density using random encounter modelling we defined the camera-trap rate as the total number of independent captures divided by the total number of camera-trap days. We calculated absolute population numbers for four trapping periods of 44–83 days. The random encounter model assumes that the population is closed; i.e. there is a fixed number of individuals in the area throughout the estimation period (Rowcliffe et al., Reference Rowcliffe, Field, Turvey and Carbone2008). As there is no immigration or emigration on Bawean, potential bias comes only from births and deaths, the effects of which we assume to be negligible for the chosen trapping periods. We could not standardize period length because of logistical challenges. We also report the combination of all four periods because single periods violate the assumption of at least 50 camera-trap locations (Rovero et al., Reference Rovero, Collett, Ricci, Martin and Spitale2013). The random encounter model used here is described in detail in Rademaker et al. (Reference Rademaker, Meijaard, Semiadi, Blokland, Neilson and Rode-Margono2016) and follows Rowcliffe et al. (Reference Rowcliffe, Field, Turvey and Carbone2008, Reference Rowcliffe, Carbone, Jansen, Kays and Kranstauber2011, Reference Rowcliffe, Kays, Kranstauber, Carbone and Jansen2014). Day range was defined as the mean speed of movement of the animals in front of the camera in m/s, extrapolated to km/day and multiplied by the proportion of time spent active. The result of the random encounter modelling was multiplied by the mean group size of the relevant species, as a group is the entity of detection. However, the result must be considered to be a minimum estimate, as a video may miss some individuals in a social group. We extrapolated the estimated densities per km2 to the total protected area on Bawean to provide absolute population estimates. To account for the effects of uncertainty of parameter variables on uncertainty of the density function, we used a propagation of error approach, calculated in Rademaker et al. (Reference Rademaker, Meijaard, Semiadi, Blokland, Neilson and Rode-Margono2016). As only adult individuals contribute to reproduction, we report the number of mature individuals as the relevant population unit for conservation purposes. We estimated the number of mature individuals by multiplying the density estimate by the mean ratio of adult individuals on a video (fully grown, males with warts; Rode-Margono et al., Reference Rode-Margono, Rademaker, Semiadi, Bulk, Meletti and Meijaard2017) to the total number of individuals counted (the latter included juveniles and piglets). No random encounter model was produced for Bawean deer, as the highest number of encounters in a field period was 30 videos (August–October), and a reliable model would need at least 50 independent events (Rovero et al., Reference Rovero, Collett, Ricci, Martin and Spitale2013).
To analyse behaviour, group sizes and group patterns we use descriptive statistics unless indicated otherwise. Diel activity patterns and proportion of time spent active were estimated based on camera-trap detections, using the circular statistics software Oriana v. 4 (Kovach Computing Services, Anglesey, UK) and the R package activity (Rowcliffe et al., Reference Rowcliffe, Kays, Kranstauber, Carbone and Jansen2014). We ran Wald tests for the statistical difference between activity level estimates at sunrise (dawn), sunset (dusk), noon and midnight. We used a χ 2 test to compare the frequency of observations between sunset and sunrise and between sunrise and sunset, the timings of which were obtained from the Astronomical Applications Department of the U.S. Naval Observatory.
Results
Relative encounter rates, distribution and habitat preferences
In total we accumulated 4,516 camera-trap days, with 2,278 independent videos of nine wildlife species (Table 1). Domestic species recorded were water buffaloes (2 videos), feral dogs (44), cats (14) and chickens (3). In addition, there were 28 videos of unidentified species of rats. We could not detect any significant difference in the relative abundance index between wet and dry seasons for either of the focal species (deer: RAI wet = 0.57, RAI dry = 0.38; W = 3,619.5, P = 0.498; warty pig: RAI wet = 16.51, RAI dry = 15.21; W = 3,427, P = 0.367).
Table 1 Species that were detected during a 13-month camera–trap survey on Bawean Island (Fig. 1a), with their IUCN Red List status, regional status, total relative abundance index (RAI), mean RAI, number of video records, number of camera-trap days until first detection, and per cent of total records.

1 CR, Critically Endangered; EN, Endangered; LC, Least Concern.
2 All detections for a species summed for all camera traps over all days, multiplied by 100 and divided by the total number of camera-trap nights.
3 Mean of the RAI of each camera trap.
Bawean warty pigs were present in the three largest forest blocks but absent from the two smallest fragments and the western peninsula Gili Barat (Fig. 1b). Given the sensitivity of the data, we refrain from publishing distribution data for the Bawean deer. However, 90% of all videos were recorded in a single area of c. 17 ha, with 29 videos recorded from only two camera traps. In all of these locations, camera traps also recorded feral dogs.
Fifty-five camera-trap locations were excluded from occupancy analysis of the Bawean warty pig because of missing covariate information. Of the remaining 126 sites, Bawean warty pigs were detected at 59, giving a naïve occupancy of 0.47. The top-ranking model indicated only a negative influence of distance to nearest village on probability of occupancy (−0.56 ± SD 0.24; Fig. 2). Moonlight, temperature and rainfall did not significantly influence detection probability and all other site-level covariates for probability of occupancy were similarly unable to improve model fit, such that there were no competing models (ΔAIC < 2). The revised model-derived estimate of occupancy for the Bawean warty pig was 0.59 ± SD 0.06, with a detection probability of 0.17.

Fig. 2 Predicted occupancy (mean ± SD) of Bawean warty pigs in relation to distance to nearest village.
Population size
Random encounter modelling based on the four trapping periods yielded variable population estimates for the Bawean warty pig, ranging from a minimum of 75 individuals in October and November to a maximum of 2,219 in June and July (Table 2). Our overall mean estimate across the entire study period is 351 mature individuals.
Table 2 Details of the four camera-trap surveys and of the combined surveys, camera trapping parameter estimates, adjustment factors (used to estimate total population size and number of mature individuals), and model output and adjusted model output for the random encounter model for the Bawean warty pig over four periods in 2015, and combined for the whole period.
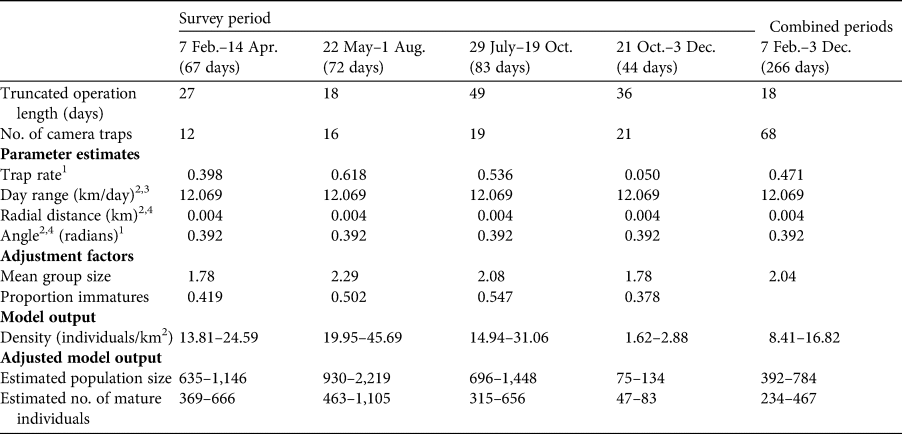
1 Total number of independent captures divided by total number of camera-trap days.
2 From Rademaker et al. (Reference Rademaker, Meijaard, Semiadi, Blokland, Neilson and Rode-Margono2016).
3 Defined as the mean speed of movement of animals in front of the camera in m/s, extrapolated to km/day and multiplied by the proportion of time spent active.
4 Radial distance and angle of detection to the camera were measured at the time of detection of the animal in front of the camera.
We obtained only two captures of deer over the first 3 months of our study (November 2014–January 2015), from 102 fully random trap positions. In the following 6 months (February–July) we sampled an additional 31 random locations (47 ± SD 19 days/location), resulting in six more captures of deer. The inclusion of five preferentially positioned traps during August–October (80 days/location) resulted in 30 additional captures, 27 (90%) of which were from a single location. These records were insufficient to calculate a population estimate for the Bawean deer using random encounter modelling.
Activity patterns
Captures of Bawean deer (n = 56) indicated an overall activity level of 0.56, but Rayleigh tests did not detect significant deviation from a uniform daily activity distribution (z = 1.22, P = 0.295), suggesting this species may be cathemeral (Fig. 3a). Nevertheless, deer tended to be more active at dusk than dawn (P = 0.012) or midday (P < 0.01), with a mean activity time of 20.36 ± circular SD 7 minutes. Records of Bawean warty pigs (n = 1,749) indicated an overall activity level of 0.52, with Rayleigh tests showing an uneven distribution of daily activity (z = 19.13, P < 0.01; Fig. 3b). Pigs were most active at dawn (P < 0.01 for all pairwise comparisons; mean activity time was 03.22 ± circular SD 7 minutes), with a second peak at dusk (P < 0.01), and were least active at midday (P < 0.01; Wald tests), indicating a tendency for crepuscular activity patterns. There was no significant difference in number of encounters between day and night for either species (warty pig: χ 2 = 2.438, df = 1, P = 0.119; deer: χ 2 = 1.6842, df = 1, P = 0.194). However, given the limited number of records of the Bawean deer, the observed activity patterns for this species need to be interpreted cautiously.

Fig. 3 Activity plots based on camera-trap records of (a) the Bawean deer Axis kuhlii (n = 38) and (b) the Bawean warty pig (n = 985).
Social behaviour and reproduction
Mean group and litter sizes, and numbers of adults, are in Table 3. Sample sizes for Bawean deer were too low to investigate reproductive patterns, with immature individuals recorded only in April and August (Fig. 4a). Bawean warty pigs were recorded in small family groups (with or without males), pairs, and as single males. Changes in group structure over the year indicate a reproductive peak in the dry season, particularly in August (Fig. 4b).
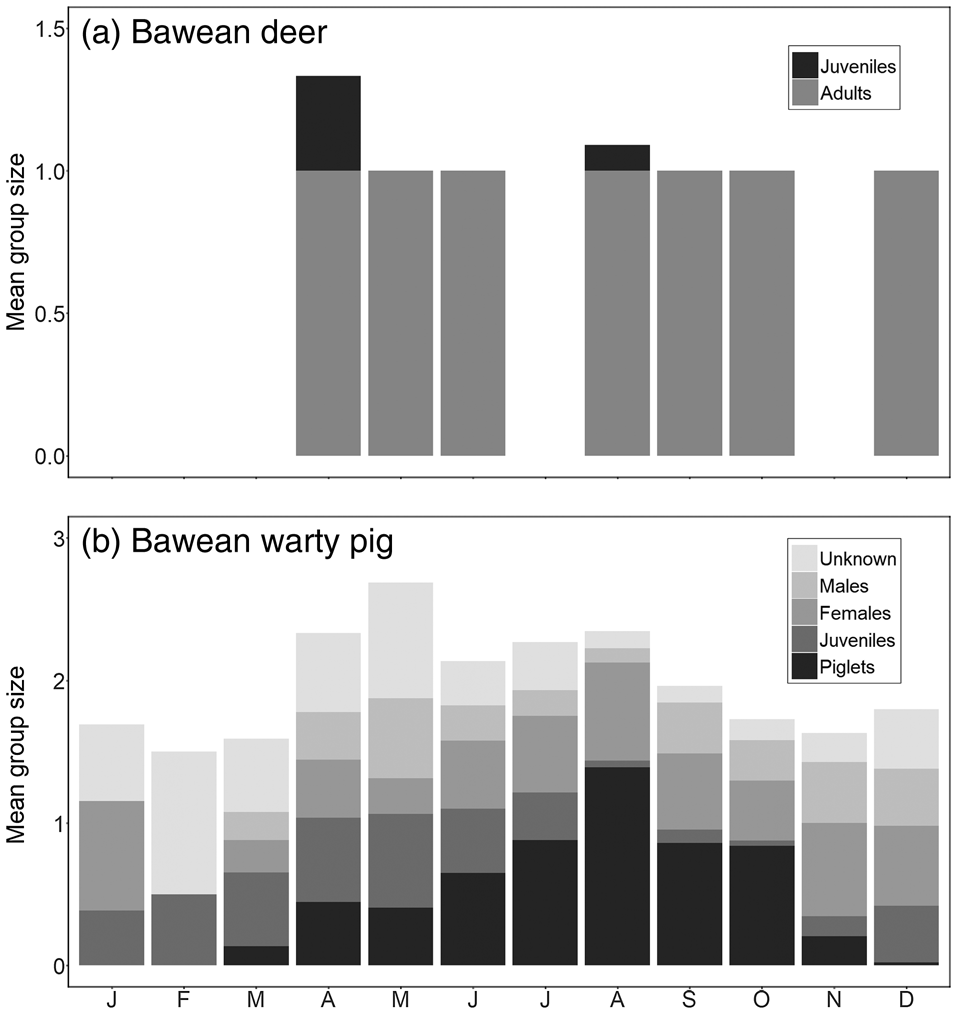
Fig. 4 Monthly patterns of mean group size and structure based on camera-trap records of (a) the Bawean deer (n = 38) and (b) the Bawean warty pig (n = 985).
Table 3 Mean group size, mean litter size, and numbers of adult females, adult males and adults of indeterminate sex, of Bawean deer and the Bawean warty pig recorded in 2015.

Discussion
Relative abundance, distribution and habitat preferences
Our results indicate that occupancy of Bawean warty pigs is negatively correlated with distance to villages but not with other measured covariates, such as tree height, density and diameter, habitat type, or distances to roads and protected area borders. In contrast, Rademaker et al. (Reference Rademaker, Meijaard, Semiadi, Blokland, Neilson and Rode-Margono2016) found a negative correlation between camera-trap rate and distance to protected area border, as well as a preference for community forest. Our occupancy model may have been unable to detect influences of habitat type because the majority of cameras were located in two habitat types: tall forest (60%) and rice cultivation (15%). However, Bawean warty pigs have previously been found to prefer semi-open cultivated habitat (Semiadi & Meijaard, Reference Semiadi and Meijaard2006; Meijaard, Reference Meijaard2014), and this may have been captured in our data by the higher probability of occupancy with closer proximity to villages. From a conservation perspective this preference poses a risk to the pigs, as crop damage on Bawean Island is mainly combatted by hunting (Rode-Margono et al., Reference Rode-Margono, Blokland, Zahra, Rademaker and Semiadi2016b; Rahman et al., Reference Rahman, Gonzalez and Aulagnier2017a); the use of non-specific hunting methods (e.g. snares) and associated stress may also affect Bawean deer (BBKSDA East Java, 2009).
Captures of Bawean deer were restricted to two areas, with the majority of videos originating from a single location. Rahman et al. (Reference Rahman, Gonzalez and Aulagnier2017a) detected high abundance in the same area and presence in a third location, using camera traps, and identified a low number of faecal samples in a fourth location. They did not detect deer in the area where the other 8% of our videos were recorded.
Rahman et al. (Reference Rahman, Gonzales, Haryono, Muhtarom, Firdaus and Aulagnier2017b) suggested that Bawean deer prefer secondary forest over primary forest, possibly because of higher productivity. Furthermore, they reported that Bawean deer use forests as refuges and edge habitat for foraging, which puts them at risk of conflict with people and predation by feral hunting dogs. Although we could not analyse habitat preference because of insufficient data, the distribution of our records confirms the deer's occurrence in community forests and tall forests near forest edges, but not in the interior of the island, which is presumably primary forest. The apparent absolute avoidance of some parts of the protected area, or whether this is a relic of population dynamics in a very small population, requires investigation.
Neither Rahman et al. (Reference Rahman, Gonzalez and Aulagnier2017a) nor our study detected deer in the interiors of protected areas. The lack of records may be attributable to (1) a genuine absence or extreme rarity in these areas, (2) secretive behaviour, with a strong preference for moving in dense habitat that is difficult to monitor with camera traps, (3) adverse habitat conditions that are not suitable for Bawean deer, or (4) good conditions outside these areas attracting the deer. Similarly, Bawean warty pigs appear to be less abundant in the interiors of protected areas. It is important to understand the reasons for the lower abundance or absence of species in the protected area interior, to plan effective conservation measures.
Population estimates of Bawean warty pigs
Population estimates per survey period for the Bawean warty pig fluctuated considerably across the duration of our study. Our lowest estimates were at the end of the dry season and beginning of the rainy season, whereas the highest estimates were recorded in the dry season when the reproductive season was at its peak. Other studies have shown that pig densities seem to fluctuate in response to resource availability (e.g. Hancock et al., Reference Hancock, Milner-Gulland and Keeling2005). Significant climatic seasonality on Bawean Island, particularly in terms of precipitation and associated occurrence of fires, could result in large fluctuations in population sizes. Hunting pressure, spatial restriction on dispersal and an absence of predators may exacerbate these changes.
Based on the findings of Rademaker et al. (Reference Rademaker, Meijaard, Semiadi, Blokland, Neilson and Rode-Margono2016), which indicated a small and geographically restricted population numbering < 250 mature individuals, the Bawean warty pig was categorized as Endangered on the IUCN Red List based on criterion D (IUCN, 2012). Our new estimated mean of 350 mature individuals exceeds this threshold. However, in line with IUCN guidelines we suggest that because seasonal population sizes are well below the threshold, the species may continue to fulfil criterion D. Additionally, criteria B1,2(a,b(i,iii)) may qualify the species as Endangered based on the small extent of occurrence and area of occupancy (IUCN, 2012).
Population estimates of Bawean deer
Rahman et al. (Reference Rahman, Gonzalez and Aulagnier2017a) calculated a population size of 227–416 Bawean deer, suggesting a population equal to that of warty pigs (based on this study and Rademaker et al., Reference Rademaker, Meijaard, Semiadi, Blokland, Neilson and Rode-Margono2016). The authors recorded 118 independent camera-trap images of deer from 75 camera positions during 9 months in 2014. A subset of the data was used to derive population estimates using random encounter modelling. The subset contained 82 independent captures from 17 preferentially and 23 randomly positioned traps. The authors stated that there was no significant difference in trap rates between their random and preferential traps, although they provided no statistical test. In contrast, in our study we observed (1) a large difference in trap rates between random and preferential traps, and (2) a highly localized population of deer. Based on the ratio of the number of independent captures of pigs and deer, we argue it is impossible for the population of deer to equal or exceed that of pigs. This discrepancy in findings for a Critically Endangered species merits attention, and could derive from differences in random encounter modelling, study design or deer ecology. Firstly, the random encounter modelling density equation is highly sensitive to parameter values, and thus measurement errors in the speed of movement, detection radius and/or detection angle could result in overestimation. For example, Rahman et al. (Reference Rahman, Gonzalez and Aulagnier2017a) stated that most of the deer recorded in their videos were foraging, which could have been because a number of traps were placed preferentially. Despite the encounter rate between randomly and preferentially placed camera traps not being significantly different, the high frequency of foraging will have had a negative effect on the species' estimated speed of movement, and thus a positive effect on the estimated density. Secondly, contrary to the results of Rahman et al. (Reference Rahman, Gonzalez and Aulagnier2017a), we found a large difference in the trap rate between our randomly and preferentially positioned traps. Vagueness in the methods of Rahman et al. (Reference Rahman, Gonzalez and Aulagnier2017a) regarding repositioning of unsuccessful traps to new positions makes it impossible to compare the results objectively. However, if these traps were repositioned from their unsuccessful location, yet still considered to be random, this could explain the high trap rates and hence the higher density estimation compared to our study. Additionally, even though trapping rates between random and preferential camera traps may be statistically different, absolute numbers of these rates may also vary, yielding different random encounter modelling results. Thirdly, the difference may be related to the ecology of Bawean deer. The closely related hog deer Axis porcinus, for example, shows strong interannual fluctuations in population size (J.W. Duckworth, pers. comm.). If fluctuations were large enough to cause the observed discrepancies in captures, this would suggest a serious decline in numbers.
Although we cannot identify the exact source of the discrepancy, we suggest that based on our data from 2015, numbers of Bawean deer are considerably lower than the estimates based on data from 2014 provided by Rahman et al. (Reference Rahman, Gonzalez and Aulagnier2017a). This heightens concern for the future of the species.
Behaviour and ecology
Bawean warty pigs showed significant activity peaks in the morning and evening, which supports previous research by Rademaker et al. (Reference Rademaker, Meijaard, Semiadi, Blokland, Neilson and Rode-Margono2016). Crepuscular behavioural patterns in the European wild boar Sus scrofa in South-east Asia have been attributed to poaching and human disturbance (Gray & Phan, Reference Gray and Phan2011); however, although poaching occurs on Bawean Island, it has not been quantified, and any effect on pigs’ activity patterns is unclear. Activity graphs for Bawean deer indicate some diurnal activity, with a tendency towards crepuscularity. A similar pattern is reported for the closely related hog deer, for which hunting may cause an increase in nocturnal activity (Dhungel & O'Gara, Reference Dhungel and O'Gara1991).
Group composition of Bawean warty pigs seems to be variable, with males sometimes staying in family groups when immature individuals are present. Our mean group size of 2 (range 1–9) is significantly lower than the previously reported mean group size of 4.6 (1–7), despite our mean litter size of 2.1 (1–6) being similar to the previously reported 2.5 (1–4) (Rode-Margono et al., Reference Rode-Margono, Diana, Zahra, Istiqomah, Lutfi and Leo2016a). Our data indicate that the reproductive peak in Bawean warty pigs occurs in the middle of the dry season, with no immature individuals observed during the peak of the wet season. Increased reproduction in the dry season has also been recorded for the Philippine warty pig Sus philippensis (Oliver, Reference Oliver1993).
For Bawean deer, only single adults, pairs, or mothers with infants were observed. This social organization is in contrast to the situation in captivity, in which animals are often held in large groups. Offspring were observed only twice, with a single fawn in each case, as is common for deer species.
Conclusions
The conservation of islands should be considered a top priority because of high species endemism and extinction risk (Kier et al., Reference Kier, Kreft, Lee, Jetz, Ibisch and Nowicki2009). Bawean Island is no exception, with population sizes of c. 350 Bawean warty pigs and, we argue, considerably fewer Bawean deer. The initiation of effective and standardized monitoring is required urgently to facilitate the conservation of these species. Considering the extremely low numbers and limited geographical distribution of wild Bawean deer populations, insurance populations should ideally be developed through managed conservation breeding programmes, and any releases should follow the IUCN Reintroduction Guidelines (IUCN/SSC, 2013) to prevent any negative impact on the wild, released and captive insurance populations.
Acknowledgements
We thank the Indonesian Ministry of Research and Technology, the Center for Conservation of Natural Resources (BBKSDA) in Surabaya and the Research Center for Biology—Indonesian Institute of Sciences (LIPI) for granting us permits for this research. We are grateful for the assistance and support of Nursyamsi, head of Bawean protected area management, and the rangers Abdul Rahim, Maskur, Halim, Taha and Abdullah. This study was funded by the Zoological Society for the Conservation of Species and Populations (Zoologische Gesellschaft für Arten und Populationsschutz), the People's Trust for Endangered Species, Los Angeles Zoo and Botanical Gardens, and the Species Conservation Foundation (Stiftung Artenschutz).
Author contributions
Study design and development, project coordination, supervision of field team, data analysis, writing: EJRM; data analysis, editing: HK; study design and development, project research, supervision of field team, data analysis, editing: MR; advice on project design and development, editing: GS.
Conflicts of interest
None.
Ethical standards
This research complies with the Oryx Code of Conduct for authors. Permits were issued by the Indonesian Ministry for Research and Technology (RISTEK) and the Ministry of Forestry's Center for Conservation of Natural Resources (BBKSDA) (permit numbers: 367/SIP/FRP/SM/X/2014, 89/SIP/FRP/SM/III/2015 and SIMAKSI no. SI.21/BBKSDA.JAT-2.1/2014).


