


Introduction
Despite considerable conservation efforts, wildlife poaching is an increasing problem in many protected areas (UNODC, 2016; Ripple et al., Reference Ripple, Wolf, Newsome, Betts, Ceballos and Courchamp2019). Deterring poaching activities through detection and apprehension is a core responsibility of law enforcement rangers (Hilborn et al., Reference Hilborn, Arcese, Borner, Hando, Hopcraft and Loibooki2006; Dobson et al., Reference Dobson, Milner-Gulland, Beale, Ibbett and Keane2019). Rigorous evaluations of patrol efforts are needed to examine whether they are effective in reducing poaching, and to inform decision-making. Such evaluations usually involve analysing data collected by ranger patrols (Stokes, Reference Stokes2010; Burton, Reference Burton2012; Johnson et al., Reference Johnson, Goodrich, Hansel, Rasphone, Saypanya and Vongkhamheng2016), but are often hindered by data scarcity, inaccuracy and bias (Gavin et al., Reference Gavin, Solomon and Blank2010; Keane et al., Reference Keane, Jones and Milner-Gulland2011).
Wildlife poaching is a complex problem. Most poaching activities can only be identified through proactive and reactive patrolling, and levels of poaching in unpatrolled areas remain unknown (Critchlow et al., Reference Critchlow, Plumptre, Driciru, Rwetsiba, Stokes and Tumwesigye2015). Even in areas that are subject to ranger patrols, some illegal activities may go undetected. Previous studies have shown that detectability of evidence for wildlife poaching can vary with levels of experience of patrol staff, the quality and quantity of available information, and between landscapes and seasons (Wato et al., Reference Wato, Wahungu and Okello2006; Becker et al., Reference Becker, McRobb, Watson, Droge, Kanyembo, Murdoch and Kakumbi2013; Linkie et al., Reference Linkie, Martyr, Harihar, Risdianto, Nugraha and Maryati2015; Rija, Reference Rija2017; O'Kelly et al., Reference O'Kelly, Rowcliffe, Durant and Milner-Gulland2018; Ibbett et al., Reference Ibbett, Milner-Gulland, Beale, Dobson, Griffin, O'Kelly and Keane2020). In addition, for patrol data to be valuable, rangers need to report their observations accurately. Potential reasons for not reporting include equipment failure, inability to use the recording equipment correctly, forgetting to record observations, lack of supervision in the field, or collusion with poachers. The observations recorded by rangers are thus influenced by the patrolling efforts themselves, rather than being solely a function of where actual poaching activities occur (Moreto et al., Reference Moreto, Lemieux, Rwetsiba, Guma, Driciru, Kulu Kirya and Lemieux2014).
If biased or inaccurate data are used to guide patrol strategies, patrol efforts may not be targeted in areas where they are most needed. For example, deterrence of poachers by rangers can confound inferred trends on the occurrence of illegal activity (Dobson et al., Reference Dobson, Milner-Gulland, Beale, Ibbett and Keane2019). In addition, recorded poaching events are often used to inform decisions on future deployment of rangers (Johnson et al., Reference Johnson, Goodrich, Hansel, Rasphone, Saypanya and Vongkhamheng2016; Critchlow et al., Reference Critchlow, Plumptre, Alidria, Nsubuga, Driciru and Rwetsiba2017). Rangers are trained and experienced in searching for illegal activities, but their perspectives and training could potentially exacerbate the biases in recorded data. For example, a previous study showed that rangers avoided certain areas during their patrols, which influenced the observed poaching patterns (Kuiper et al., Reference Kuiper, Kavhu, Ngwenya, Mandisodza-Chikerema and Milner-Gulland2020). Although rangers play a crucial role in the security of protected areas, patrol-based data should be used with caution to avoid relying on inaccurate poaching patterns, which can lead to inefficient deployment of law enforcement resources (Gavin et al., Reference Gavin, Solomon and Blank2010; Keane et al., Reference Keane, Jones and Milner-Gulland2011).
Most studies of poaching acknowledge the challenges of detecting poaching events (Wato et al., Reference Wato, Wahungu and Okello2006; Gavin et al., Reference Gavin, Solomon and Blank2010; Becker et al., Reference Becker, McRobb, Watson, Droge, Kanyembo, Murdoch and Kakumbi2013; Watson et al., Reference Watson, Becker, McRobb and Kanyembo2013), but few have estimated detection probabilities or explored strategies that could lead to increased performance. Recent patrol deployment research and mark–recapture models have focused on predicting the levels of poaching activities in unpatrolled or infrequently patrolled areas, through mathematical modelling (Critchlow et al., Reference Critchlow, Plumptre, Driciru, Rwetsiba, Stokes and Tumwesigye2015; Linkie et al., Reference Linkie, Martyr, Harihar, Risdianto, Nugraha and Maryati2015; Fang et al., Reference Fang, Nguyen, Pickles, Lam, Clements and An2017; Moore et al., Reference Moore, Mulindahabi, Masozera, Nichols, Hines, Turikunkiko and Oli2017). These models can overcome some of the potential biases, but only under the assumption that the recorded data are representative of all poaching activities. This assumption, however, cannot be tested using only recorded poaching data. This makes it difficult to estimate poaching trends and the impact of law enforcement strategies on poaching behaviour. Therefore, there is a need for exploration and comparison of different patrol strategies (Baylis et al., Reference Baylis, Honey-Rosés, Börner, Corbera, Ezzine-de-Blas and Ferraro2016).
An evaluation of new strategies or technologies is challenging if the extent of the problem is unknown, but field experiments can help evaluate the context, mechanisms and outcomes of an intervention (Johnson et al., Reference Johnson, Tilley and Bowers2015; Jones, Reference Jones2018). A few studies have designed such experiments to examine the probabilities of detecting poaching (Rija, Reference Rija2017; O'Kelly et al., Reference O'Kelly, Rowcliffe, Durant and Milner-Gulland2018; Ibbett et al., Reference Ibbett, Milner-Gulland, Beale, Dobson, Griffin, O'Kelly and Keane2020). They found that the detectability of snares is influenced by habitat type, level of experience of patrol staff, and search effort. It is still unknown, however, how different patrol strategies could potentially increase detection.
Here, we outline a method for estimating the probabilities of detecting wildlife poaching. We estimated the detection probability of the current patrol strategy used in a protected area, and compared it against alternative patrol strategies. We focused on snaring because the use of wire snares is a popular and widespread hunting technique (Lindsey et al., Reference Lindsey, Balme, Becker, Begg, Bento and Bocchino2013; Gray et al., Reference Gray, Hughes, Laurance, Long, Lynam and O'Kelly2018) and has been the focus of recent research (Rija, Reference Rija2017; O'Kelly et al., Reference O'Kelly, Rowcliffe, Durant and Milner-Gulland2018; Ibbett et al., Reference Ibbett, Milner-Gulland, Beale, Dobson, Griffin, O'Kelly and Keane2020). We tested different patrol strategies in a field experiment with a known number and spatial distribution of imitation snares.
In preparation for the field experiment we identified strategies that could potentially increase the probability of detecting snares, and determined appropriate outcome measures for the comparison and evaluation of those strategies. There are a number of potential patrol strategies that could be examined, but we focused on three strategies that required minimal or no changes to current law enforcement operations: spatially focused patrols, independent observers and systematic search patterns.
Spatially focused patrols search for signs of poaching at a specific location at the micro-level; e.g. around a water hole. This is different from most law enforcement operations; rangers are typically tasked with searching a particular grid cell ≥ 1 km2. A spatially focused patrol could be used in situations where law enforcement officials have received information about the precise location of a particular poaching activity, for example because a poacher was recently observed there, or through local informant networks (Linkie et al., Reference Linkie, Martyr, Harihar, Risdianto, Nugraha and Maryati2015). Such information can help law enforcement managers with directing resources towards high-risk areas, and potentially increase the detection rate of poaching. We therefore hypothesized that spatially focused patrols have a higher probability of detecting snares compared to the baseline detection probability.
Studies of industrial psychology have shown that observed individuals who perform a specific task may behave differently because they know that they are being watched. This is known as reactivity (Harvey et al., Reference Harvey, Olórtegui, Leontsini and Winch2009), and can enhance performance, industrial productivity and health-related behaviours (Usichenko et al., Reference Usichenko, Julich and Wendt2013; Chen et al., Reference Chen, Vander Weg, Hofmann and Reisinger2015). It has been suggested that the presence of an observer or supervisor caused urban police officers to behave more proactively (Spano, Reference Spano2007; Mastrofski et al., Reference Mastrofski, Parks, McCluskey, Piquero and Weisburd2010). We defined independent observers as non-rangers who joined the rangers on their patrol. We hypothesized that patrols accompanied by independent observers have a higher probability of detecting snares compared to the baseline detection probability.
Systematic search strategies are rooted in modern search theory, which was developed in the 1940s during wartime, primarily for naval use (Koopman, Reference Koopman1946). The theory states that searching is a probabilistic process, with no guarantee of either success or failure. However, regardless of the object of interest, a systematic search pattern is more likely to succeed than randomly moving around (Koopman, Reference Koopman1946; Chung & Burdick, Reference Chung and Burdick2007). This is especially true when the target is small, or blends with its background (Cacho et al., Reference Cacho, Hester and Spring2007; Delaney & Leung, Reference Delaney and Leung2010), which often applies to signs of poaching. Although rangers do not patrol randomly, a more systematic approach could yield better results; e.g. a systematic walk along parallel lines or in a quadrant pattern (Chung & Burdick, Reference Chung and Burdick2007; Delaney & Leung, Reference Delaney and Leung2010). Our third hypothesis was therefore that systematic search patterns have a higher probability of detecting snares compared to the baseline detection probability.
Study area
We conducted our study in the buffer zone of Olifants West Nature Reserve in Limpopo Province, South Africa. The climate is semi-arid savannah with a mean annual rainfall of 454 mm (Peel, Reference Peel2014). The 4.15 km2 buffer zone is completely fenced. Rangers patrol both the main Reserve and the buffer zone, but the majority of snares have been detected in the buffer zone. In addition, the buffer zone is relatively small and provides a controlled environment with few external factors that could potentially affect the study.
Because resources are limited and rangers have other responsibilities, searches for snares in the buffer zone were only possible when sufficient time and resources were available. In general, rangers patrolled the buffer zone twice per week. The Reserve's management used a grid system for planning their operations; each grid cell is 1.02 × 1.1 km (0.01 × 0.01 °) and teams were normally assigned to one particular grid cell for their search. A search team typically consisted of 2–3 rangers. Ranger teams were equipped with a GPS that automatically recorded their positions at c. 10-s intervals. The searches were done in the early morning to avoid the heat of the day and took c. 2 h, but may have lasted longer if signs of illegal activity were found. All observations, including detected imitation snares, were reported through the Reserve's patrol monitoring system. The rangers received a small financial reward for every snare they reported, in addition to their base salary. This financial incentive was already in place before this study was conducted.
Methods
Experimental design
A thorough study of snare detection probabilities for different patrol strategies requires a field experiment in which the true spatial distribution of snares is known. We achieved this by setting imitation snares at 166 random locations throughout the study area, with a minimum spacing of 25 m and a density of 40 snares/km2. The numbers were based on a small pilot carried out in September 2018, which involved 10 imitation snares per 0.25 km2. Imitation snares were set at the nearest suitable location from the randomly generated point, to realistically mimic the use of real snares. For example, imitation snares were set as wire circles along game trails, often tied to a nearby tree or set between bushes, and a member of the Reserve Manager's team was present when the snares were set to ensure that they appeared realistic. The spatial distribution of actual poacher snares is unlikely to be random, but patrol teams still need to detect one snare to find a cluster of snares. We used a random distribution rather than locations where snares were detected in the past, to avoid potential bias in recorded poaching data. Randomized controlled trials are often considered the gold standard for testing the efficacy of treatments (Baylis et al., Reference Baylis, Honey-Rosés, Börner, Corbera, Ezzine-de-Blas and Ferraro2016; Pynegar et al., Reference Pynegar, Gibbons, Asquith and Jones2019), and our experimental design aimed to approximate this, without disrupting ongoing law enforcement operations.
We used snares previously removed by the Reserve's patrol teams as imitation snares. They were set without the usual trigger mechanism, which ensured that the imitation snares looked realistic but would not catch or injure animals. We recorded the time and location of every imitation snare placement using a GPS. Each imitation snare was marked with a small piece of black tape so that it could be distinguished from actual poacher snares. This approach was tested in a pilot study and the results suggested that the black tape did not increase detection probability. Distinguishing imitation snares from actual poaching snares was also necessary to minimize the likelihood that reported locations of imitation snares influenced future patrol deployment decisions. The operations manager of the Reserve was informed about the study design, but did not know the exact locations of all imitation snares. All imitation snares were set within 1 week, with the last imitation snares set on 4 April 2019. The imitation snares were left in the field until detection or the end of the study, in the last week of October 2019. We were later able to retrieve all undetected snares from where we had set them, suggesting that rangers and poachers did not use the imitation snares for their own profit.
Baseline detection
The first phase focused on estimating the baseline detection probability of snares under normal law enforcement operations, in which rangers are assigned to search a 1 km2 grid cell. This system was already in place before the study, and we did not influence how the grid cells were chosen. Rangers rely on their training and experience to decide where within their assigned grid cell to search for snares. The rangers were not informed about this research, to minimize any impact on operations. Because of logistical and technical issues, no data on patrols were recorded in April 2019. Therefore, we used all snare searches and observations recorded during 1 May–12 August 2019 to estimate the baseline detection rate. The buffer zone was not always accessible during this period because of hunting activities by the local landowners. Snare searches were planned around the hunting schedule, but were infrequent, especially during May–July. The baseline detection rate served as a reference point for comparing the different patrol strategies.
Spatially focused patrols
We compared the detection probability of spatially focused patrols to the baseline detection probability. The remaining, undetected imitation snares still in the field were used to identify locations with a density of at least 10 imitation snares per 0.25 km2. This ensured that the remaining areas that were included in this study did not comprise only isolated snares that would have been difficult to locate. These locations were passed on to the operations manager, who then decided which of these locations should be patrolled. On the day of the search, the manager informed the ranger team, often by using a map, where they should start their patrol. The rangers were again not informed about the research. This phase took 6 weeks, during 13 August–24 September 2019.
Independent observers
During this part of the study, the rangers carried out searches as they normally would, but two volunteers from a local non-profit organization were asked to join them as independent observers. The observers had little or no experience with such searches, and their role was simply to join the rangers and look for evidence of poaching activities. Although using law enforcement supervisors would have been more realistic than using volunteers, this would have also distracted supervisors from their daily duties and responsibilities. The observers were told not to interfere with the team's decision-making, but were free to interact with the rangers and ask them questions. Various people including volunteers, researchers and journalists have joined the rangers on their patrols in the past and the daily patrol operations did not change. The ranger teams were again not informed about the research. This phase took place in October 2019 and lasted for 5 weeks.
Systematic search patterns
We examined two different search patterns: parallel lines (Fig. 1a) and a quadrant search pattern (Fig. 1b). The parallel lines were c. 10–20 m apart, depending on the environment, and were usually walked in a north–south direction. The quadrant pattern was inspired by a previous survey for snares (Watson et al., Reference Watson, Becker, McRobb and Kanyembo2013), in which the search was conducted along the edges and corners of two squares: an outer (350 × 350 m) and inner quadrant (175 × 175 m). The team searched from corner to corner of the outer quadrant first, followed by the inner quadrant. At every corner the team stopped and split up for 5 minutes, searching for snares in the vicinity.
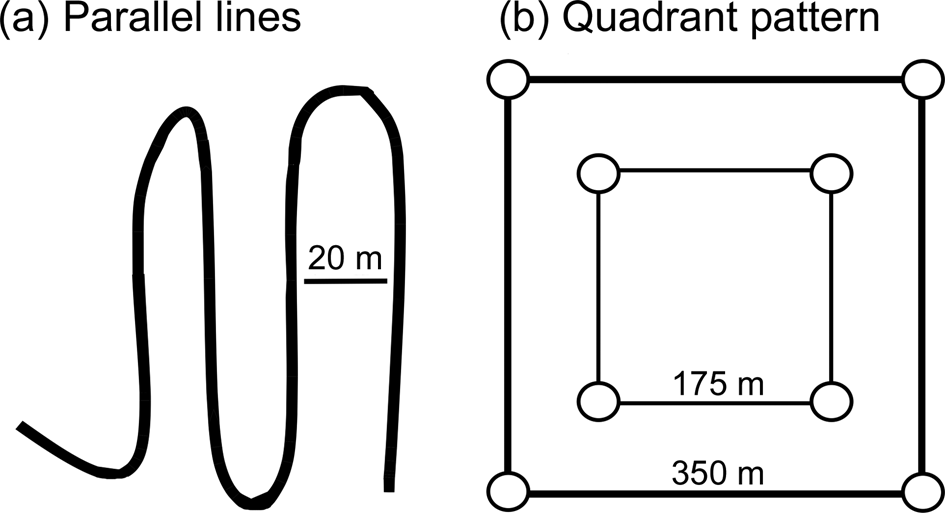
Fig. 1 Two systematic search patters: (a) parallel lines, and (b) quadrant pattern, in which a 5-minute search was conducted in every corner of the two quadrants.
The teams responsible for walking the systematic search patterns consisted of four people. Three people were tasked with searching for snares. They walked at a distance of c. 10 m from each other, which allowed them to remain in visual contact (a standard security protocol in areas with potentially dangerous wildlife) and reduced the likelihood that an imitation snare would be missed (Wato et al., Reference Wato, Wahungu and Okello2006). The fourth person made sure that, as far as reasonably possible, the others maintained their positions. Every imitation snare detected during the searches was removed and the location recorded using a GPS. These searches took c. 2.5 hours, similar to a regular search. The search teams comprised volunteers and researchers from a local NGO instead of rangers. Although involving rangers would have been more realistic, it would have disrupted their normal operations. The volunteers had little or no experience with snare searches, but were informed about the research design and how to look for imitation snares. The systematic searches were carried out during 5 July–18 August and 23 September–30 October 2019. Systematic searches took place during the same periods as the spatially focused patrols and patrols with independent observers, but never on the same day.
Survival analysis
We used the Kaplan–Meier estimator to describe the overall probability of imitation snares remaining undetected over the study period (Kaplan & Meier, Reference Kaplan and Meier1958; Klein & Moeschberger, Reference Klein and Moeschberger2003). We generated a Kaplan–Meier survival curve by pooling all data from the four search strategies, to visualize when imitation snares were reported. Because the number of detected snares was low, we could not estimate a survival curve for every search strategy. The start time was set as 5 April 2019, the day after the last imitation snares were deployed. The end time was the date of detection or when the imitation snare was removed at the end of the study. We used the packages survival and survminer (Therneau, Reference Therneau2015; Kassambara et al., Reference Kassambara, Kosinski and Biecek2019) in R 3.5.2 (R Core Team, Reference R Core Team2018) for the survival analyses.
Bootstrap sampling
To estimate the number of imitation snares that were likely to be detected by a patrolling team, we used a 10 m buffer around the GPS routes of the snare searches. The width of the buffer was based on the distance at which an imitation snare can be seen and the accuracy of GPS fixes. We considered all imitation snares within the buffer available for detection, and calculated the number of imitation snares available for detection for each search. We used the same approach for the systematic search patterns. We used the GPS data of the snare searches to calculate the duration of the search, the distance walked and the area covered, with the R package sf (Pebesma, Reference Pebesma2018).
We compared the number of reported imitation snares to the number of imitation snares available for detection. We used non-parametric bootstrapping to estimate the variance in detection probabilities, because the number of reported snares was low, which precludes maximum likelihood estimation techniques. Non-parametric bootstrapping repeatedly draws new samples of equal size with replacement from the collected data, and each original observation has an equal probability of being drawn into the new sample. Detection probabilities were then calculated using the newly drawn sample. By repeating these steps 10,000 times for the baseline sample and every patrol strategy, we calculated the average detection probability and a 95% confidence interval. We used the base functions in R for the bootstrap resampling and the ggplot2 package for visualization (Wickham, Reference Wickham2016). Fisher's exact test (Fay, Reference Fay2010) was used to compare the detection probabilities of every strategy to the baseline detection probability.
Results
In total, 69 snare searches were conducted, six of which had no recorded GPS tracks because rangers forgot to record them or because there were technical problems with the equipment. Because of logistical and technical issues, only two snare searches were conducted in April 2019, and these were not recorded. The final dataset included 63 recorded searches (39 searches by rangers and 24 systematic searches), covering c. 263 km over 132 patrol hours (Table 1).
Table 1 Patrol effort and detections for different search strategies for locating snares.

1Tested against the baseline detection rate of standard patrols.
We combined all 63 recorded snare searches and their observations to assess how many imitation snares remained undetected during the study period. A total of 39 (23%) of the 166 imitation snares were reported. In addition, a total of 11 real, but old snares (i.e. probably placed some time before the study) and one bundle of snares (several snares tied together with a piece of string; not set up to catch animals) were reported by the rangers and volunteers during the study period. The probability that an imitation snare remained undetected at the end of the study (after 200 days) was c. 0.77 (Fig. 2). The first imitation snares were reported after 77 days (c. 2.5 months) and seven recorded patrols were conducted during this period. The median time until detection could not be estimated because more than half of all imitation snares remained undetected during the study period.
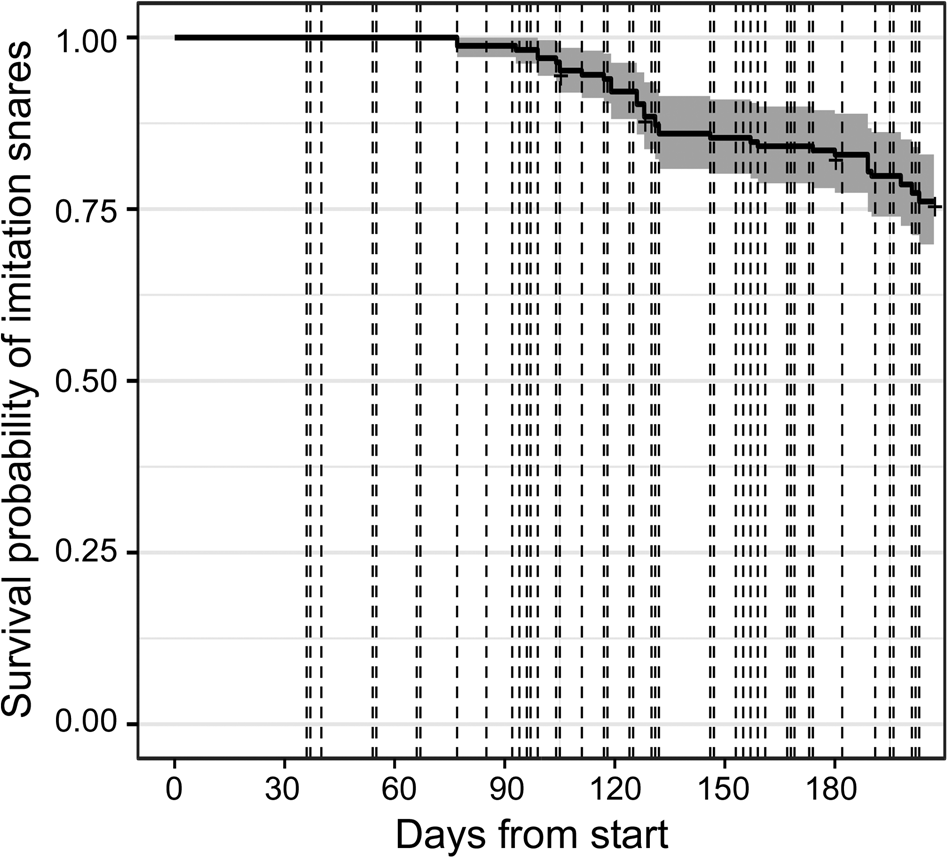
Fig. 2 Kaplan–Meier survival curve of all imitation snares over time. The dashed lines show when snare searches were conducted.
We estimated the baseline detection probability to be 19% (Table 1, Fig. 3). Circa 15% of imitation snares within the 10 m buffer of the spatially focused patrols were reported, and detection was 27% for patrols with independent observers (Table 1, Fig. 3). The largest number of imitation snares were located in the systematic searches: searches along parallel lines resulted in 45% detection, and 42% of imitation snares were reported for the quadrant search pattern (Table 1, Fig. 3). The detection probability of parallel lines was significantly higher than the baseline detection probability (Fisher's exact test, P = 0.04), as was the detection probability of the parallel lines and quadrant searches combined (Fisher's exact test, P = 0.03). The detection probabilities of spatially focused patrols and patrols with independent observers were not significantly different from the baseline detection probability. We thus reject our first two hypotheses (higher detection probabilities with spatially focused patrols and independent observers, respectively), but we did find evidence to support the third hypothesis (higher detection probability with systematic searches).
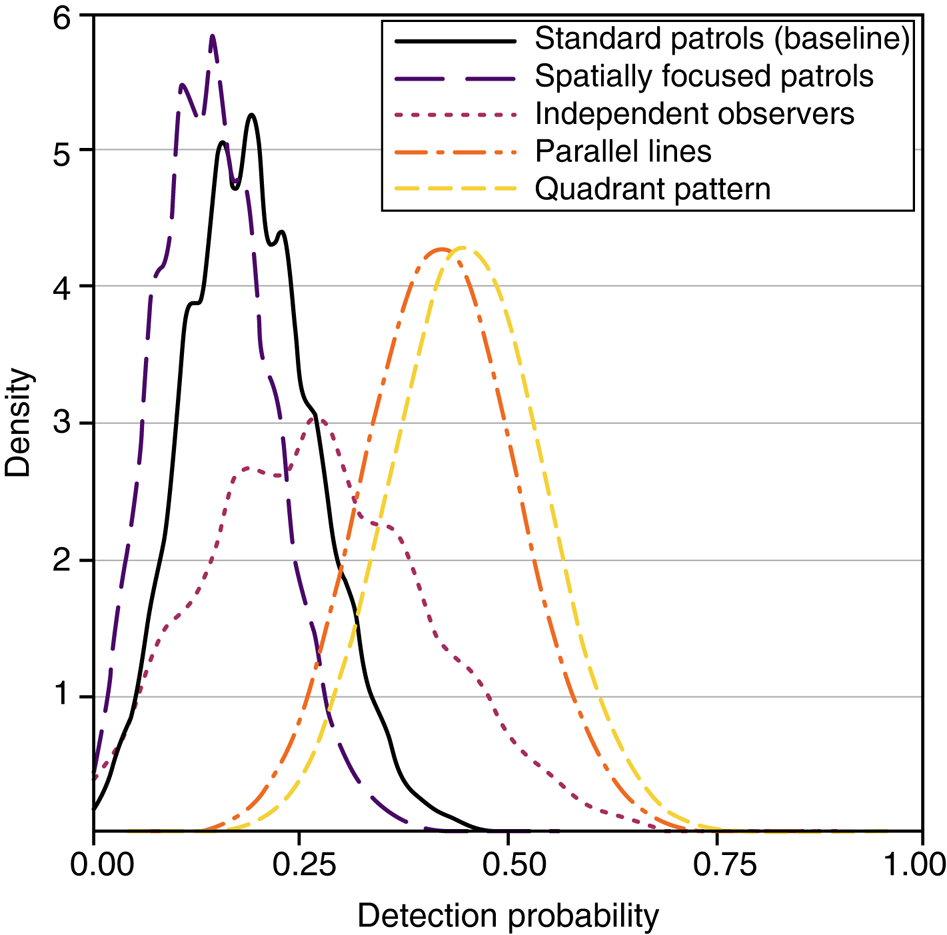
Fig. 3 Density plot of detection probabilities by patrol strategy from 10,000 bootstrap samples. The density is the number of simulation runs with that particular detection probability.
Discussion
Detecting evidence of poaching activities is challenging, and low detection rates can lead to misinterpretations of the spatial distribution of such activities. Here, using snares as a case study, we outlined a method for estimating the probabilities of detecting wildlife poaching, and evaluating alternative patrol strategies. The experimental design included a baseline measure of detection probabilities before alternative strategies were implemented. Our findings showed that c. 23% of the 166 imitation snares were found by the end of the study. Even if we assume that snares are clustered, patrol teams must still find one to identify the cluster. Furthermore, the real poachers’ snares that were detected by the teams were all considered to have been placed some time before the study. From a conservation perspective, this highlights the threat that snares pose; even snares that were set several months ago can still be harmful to wildlife (Hunter et al., Reference Hunter, Pretorius, Carlisle, Rickelton, Walker, Slotow and Skinner2007). Although detection probabilities were generally low, the highest proportion of imitation snares was detected with systematic search strategies.
Limitations
The study area was small, and we used a relatively high density of imitation snares (40 snares/km2). Based on previous studies and our experience, we expected detection probabilities to be low. Therefore, we used a high density of imitation snares to increase the total number of detections that could be used in our analysis. The estimated detection probabilities were based on the imitation snares considered available for detection (i.e. within a 10 m buffer around patrol routes) as opposed to all imitation snares in the study area. By only considering those imitation snares available for detection, the estimated detection rates were probably inflated. Because the rangers' responsibilities include other duties in addition to searching for snares, snare searches were conducted relatively infrequently, and only if resources were available.
The imitation snares were set at the end of the wet season, when the vegetation in some areas was still relatively dense. From then until the last imitation snares were retrieved in October, the study area received little rain. As a result, the landscape gradually dried and vegetation cover decreased. The estimated detection probabilities in this study therefore reflect conditions during the dry season in a semi-arid landscape. The probability of detecting snares during the wet season is expected to be lower because of increased vegetation cover. Future research could build upon the design of our field experiment and test how vegetation density influences detection probability.
The rangers were not informed about our study, to minimize any impact on their behaviour. However, it became apparent in October 2019 that the rangers were aware of the study and the imitation snares, possibly through information provided by a volunteer who joined one of the snare searches in early August. We examined the patrol effort around that time and found a small increase in hours and distance patrolled, potentially a result of rangers wanting to find snares to receive the financial reward. No imitation or real snares were detected for the next 2 weeks, after which patrol efforts decreased to similar levels as observed in June and July 2019.
Another limitation was that different people were involved in the different searches. We used volunteers to walk the systematic patterns because involving rangers would have disrupted their normal operations. Although it is unexpected that volunteers would be better at detecting snares than rangers (Lewandowski & Specht, Reference Lewandowski and Specht2015), a potential explanation could be that the searches were a novel experience for the volunteers. Many of the volunteers were highly motivated, enjoyed walking outside and specifically visited the Reserve to gain experience. The rangers, in contrast, are accustomed to patrol activities and searches for snares. Although they are more experienced than the volunteers, searching for snares is a routine activity for them. This may have contributed to the differences in the detection rate.
Interpretation of findings
The detection probability of the systematic searches was c. twice as high as the baseline estimate. This could not be attributed to differences in patrolling effort because the time spent patrolling and the area covered was generally the same among the different patrol strategies. A potential explanation for why the systematic searches outperformed the other strategies could lie in differences in how patrol effort was distributed across an area. By systematically searching an area, patrol effort is more concentrated, whereas it is more diffused with the other patrol strategies. The trade-off is that it takes more time to cover the same area. A hybrid model in which systematic searches are combined with regular snare searches could offer a practical compromise. For example, a ranger team could start patrolling as normal, until the first snare or sign of illegal activity is found. The team could then switch to a systematic strategy to search the area for more signs. This approach assumes that poachers tend to set their snares in clusters, rather than distributing them evenly (Kimanzi et al., Reference Kimanzi, Sanderson, Rushton and Mugo2014; Risdianto et al., Reference Risdianto, Martyr, Nugraha, Harihar, Wibisono and Haidir2016). Implementing a systematic approach may require additional resources initially to appropriately adjust existing law enforcement operations. For example, supervisors could provide additional training or join the rangers on their patrols to ensure that the strategy is implemented properly.
The context of our research was searching for snares in a semi-arid environment. Although systematic searches outperformed other strategies, this does not necessarily imply that our findings are applicable in other environments or for other forms of poaching. O'Kelly et al. (Reference O'Kelly, Rowcliffe, Durant and Milner-Gulland2018) related the higher detectability of snares in an evergreen forest to the difficult terrain and fewer existing trails. In such environments, a suitable approach could involve systematic searches along trails. The search pattern may vary depending on the context, but more systematic snare searches could be a practical alternative to standard searches. Hence, although the findings of our study are not necessarily generalizable, our method for testing and evaluating patrol strategies could be used in different environments or for other types of poaching.
Future research
The method outlined here could form the basis of larger-scale experiments in other areas and for other patrol strategies. Many law enforcement interventions are not designed in a way that facilitates evaluation (Baylis et al., Reference Baylis, Honey-Rosés, Börner, Corbera, Ezzine-de-Blas and Ferraro2016; Kurland et al., Reference Kurland, Pires, McFann and Moreto2017). Aside from testing the effectiveness of an intervention, evaluations should also consider the mechanisms, moderators, implementation and financial implications of such interventions (Johnson et al., Reference Johnson, Tilley and Bowers2015). This is challenging, but guidelines such as those of the Centre of Evidence-Based Conservation (CEE, 2013) can facilitate the examination of poaching problems and the development of prevention strategies. For example, in South Africa, patrol strategies for rhinoceros poaching could be tested. Many protected areas have rangers stationed at outposts to listen for gunshots. A relatively simple experiment could determine the optimal and least suitable conditions for detecting gunshots, and how these affect the accuracy of observations.
Further studies of the probabilities of detecting snares could incorporate landscape features such as terrain and vegetation, which can be derived from satellite imagery. Such studies have been conducted in tropical forests (O'Kelly et al., Reference O'Kelly, Rowcliffe, Durant and Milner-Gulland2018; Ibbett et al., Reference Ibbett, Milner-Gulland, Beale, Dobson, Griffin, O'Kelly and Keane2020), but not in semi-arid landscapes (Rija, Reference Rija2017). Analysing how landscape features influence detection probability could help identify the best patrol strategy in a particular environment. Landscape features may also be predictive of where rangers will patrol, or where poachers may be active.
Conclusion
Our study provides baseline data for the probability of detecting snares used for poaching in a semi-arid landscape, and presents a method that could be modified for use in other environments and for other types of poaching. By using an experimental design with a known spatial distribution of imitation snares, we estimated the baseline probability of ranger teams detecting snares, and evaluated alternative patrol strategies. Although detection probabilities were generally low, the highest proportion of imitation snares was detected with systematic search strategies. Future studies can build upon these findings by using a similar design to explore other factors such as seasonality and vegetation.
Acknowledgements
This research received no specific grant from any funding agency, commercial or not-for-profit sectors. We thank the Black Mambas Anti-Poaching Unit for their hard work patrolling the Reserve; the management of Olifants West Nature Reserve and its landowners for their permission; Chris Farren, Leonie Hofstra, Lisa Trueman, Barrie Venter, and Jacques Viljoen for their help with organizing and managing the snare searches; and the volunteers and researchers at Transfrontier Africa NPC for their help: Chris Banotai, Manuela Böhm, Linda Crawford, Jay Daniel, Amy Dennett, Emma Germano, Joni Hartman, Romana Kremlácková, Kyra Reumerman, Marc Saadi-Clark, Frouwke Smidt, Siboniso Thela, Isabelle Tiller, Beatriz d'Vaz, and Florence Wiggins. We thank Marie Lindegaard, Wouter Steenbeek and two anonymous reviewers for their comments.
Author contributions
Study design: all authors; fieldwork: NvD, PMRRA, CRS; data analysis: NvD, AML, SR; writing: NvD, AML, SR, PMRRA.
Conflicts of interest
None.
Ethical standards
This study abided by the Oryx guidelines on ethical standards, and was approved by the relevant authorities of Olifants West Nature Reserve and by the Ethics Committee for Legal and Criminological Research of the Vrije Universiteit Amsterdam.


 Open access