


Introduction and objective
The Western Scheldt (Fig. 1) is the only remaining open natural estuary of the Delta coast in the SW Netherlands, a series of (former) distributaries of the rivers Rhine, Meuse and Scheldt. The estuaries of the Eastern Scheldt, Grevelingen and Haringvliet were entirely or partially closed as part of the Delta Project, a flood protection scheme built between 1954 and 2010 following the storm surge disaster of 1953 (Watson & Finkl, Reference Watson and Finkl1990, Reference Watson and Finkl1992). The damming of the estuaries led to significant morphodynamic changes that are still noticeable today (Elias et al., Reference Elias, van der Spek and Lazar2016; Van der Spek & Elias, Reference Van der Spek and Elias2021).

Figure 1. Overview of (A) the (former) estuaries that form the Delta region of the SW Netherlands. The contiguous ebb-tidal deltas of the (former) distributaries of the rivers Rhine, Meuse and Scheldt are together named Voordelta (fore delta) and (B) the main channels and shoals in the Western Scheldt estuary. The underlying DEM of the estuary is based on 2021 survey data. Depths are in meters relative to the Dutch ordnance datum NAP (Normaal Amsterdams Peil), which is about present-day mean sea level. Note that in this figure the tidal channels and shoals are indicated by their Dutch names. The majority of these names end with words that are easily recognised and translated: ‘Vlakte’, ‘plaat’ or ‘platen’ = shoal(s); ‘geul’ or ’pas’ = channel; ‘gat’ or ‘put’ = deep channel / scour hole; ‘nauw’ = narrow often deep channel.
Like in many estuaries, in the Western Scheldt, man and nature compete for the same natural resources (De Vriend et al., Reference De Vriend, Wang, Ysebaert, Herman and Ding2011; Barbier et al., Reference Barbier, Hacker, Kennedy, Koch, Stier and Silliman2011; Biguino et al., Reference Biguino, Haigh, Dias and Brito2023). The governments of the Netherlands and the Belgian state of Flanders, by treaty, manage the Scheldt estuary jointly. The often conflicting economic and environmental interests make sustainable management of these systems a complex and non-trivial task, especially if it crosses country borders and multiple governments are involved (Graveland et al., Reference Graveland, Dauwe and Kornman2002; Debergh et al., Reference Debergh, Lescrauwaet, Deneudt, Mees and Hernandez2009).
The Western Scheldt remained an open estuary due to the presence of essential shipping lanes to the harbours of Vlissingen, Terneuzen and Antwerp (Fig. 1). In 2019 alone, almost 15,000 seagoing vessels sailed through the estuary to the port of Antwerp (Plancke et al., Reference Plancke, Maris, Verleye, Sandra and Dauwe2022). Shipping requires a nautically safe, morphologically stable navigation channel of sufficient depth and width. The ongoing maintenance of the shipping channel, however, may conflict with the need for sufficient estuarine habitat. Such habitat is essential to maintain the estuary’s biodiversity and associated high ecological value and to fulfill Natura 2000 criteria (Bastmeijer, Reference Bastmeijer and Bastmeijer2016). To compensate for habitat losses as a result of channel deepening, already in 2004, plans were presented to restore intertidal habitat by depoldering the Hedwigepolder (Soresma, 2013), and in 2022, the removal of the dykes finally started.
From a morphodynamic viewpoint, the net sediment import or sediment export rates are a vital indicator of the long-term “health” of estuarine and tidal-inlet systems. Excessive sediment export can lead to the loss of shoals and intertidal habitat, whereas sediment import can lead to channel deposition, hamper navigability and increase the need for maintenance dredging. Additionally, sand import into the estuary is considered a loss from the coastal zone and under the present Dutch coastal policy needs to be compensated through nourishments (Mulder et al., Reference Mulder, Hommes and Horstman2011; Lodder & Slinger, Reference Lodder and Slinger2022). Understanding the sediment import and export rates is therefore essential for an effective and sustainable management of the estuary and the adjoining coastal zone.
It is well known that anthropogenic sediment interventions, such as sand mining, dredging and dredge relocation (disposal), directly impacted the hydrodynamics and morphology of the Western Scheldt (Wang et al., Reference Wang, Jeuken, Gerritsen, de Vriend and Kornman2002; Taal et al., Reference Taal, Wang and Cleveringa2013; Vandenbruwaene et al., Reference Vandenbruwaene, Pauwaert, Meire, Plancke, Deschamps and Mostaert2019, Reference Vandenbruwaene, Stark, Plancke and Mostaert2020), causing subsequent changes in the sediment transport dynamics (Wang & Winterwerp, Reference Wang and Winterwerp2001; Jeuken, Reference Jeuken2000; Jeuken & Wang, Reference Jeuken and Wang2010; Schrijver, Reference Schrijver2021). However, the sediment exchange between the estuary and the mouth area and North-Sea coast is still insufficiently understood, with some studies reporting sediment import and others sediment export (Bakker & De Looff, Reference Bakker and De Looff1977; Nederbragt & Liek, Reference Nederbragt and Liek2004; Haecon, 2006; Cleveringa, Reference Cleveringa2013; Dam & Cleveringa, Reference Dam and Cleveringa2013; Schrijver, Reference Schrijver2021). The specific research goals of this study are, therefore:
-
1. to quantify the sediment exchange between the Western Scheldt estuary and the mouth area, and
-
2. to better understand the sediment budget changes of the Western Scheldt estuary and its response to changes in hydrodynamics, natural and anthropogenic sediment transport (due to sand mining and dredging and disposal strategies).
To achieve these goals, we summarise the morphodynamic evolution of the Western Scheldt estuary, analyse changes in basin hydrodynamics, and construct and analyse a comprehensive sediment budget of the estuary over the period 1955–2020. The sediment budget analysis uses detailed bathymetric surveys executed by Rijkswaterstaat, the water management authority of The Netherlands. Long-term datasets comprising frequent observations of anthropogenically influenced morphodynamic changes in estuaries are generally scarce. Therefore, an additional goal of this paper is to share this dataset with the international audience. Moreover, this study aims to highlight and summarise the body of reports on the Western Scheldt written in Dutch.
Study area
General characteristics
The Scheldt estuary and river are 350 km long and extend through the Netherlands, Belgium and France (Fig. 1). Tidal influence extends roughly 160 km upstream to the weir at Gentbrugge. Upstream of this weir, the system is strictly fluvial. The fluvial channel branches out into two main tributaries and extends into France. The total catchment area equals 21.000 km2. The funnel-shaped estuary seaward of the weir displays three morphologically distinct systems:
1. Single-channel system: The upstream reach between Gentbrugge and the Flemish-Dutch border north of Antwerp is called Sea Scheldt or ‘Zeeschelde’ in Dutch and consists of a large single main channel and mudbanks along its embankments. In 2010, the average bed level of the Sea Scheldt was around NAP −12 m (Verheyen & Van Holland, Reference Verheyen and van Holland2013; Van Dam, Reference Van Dam2014). The highest mean tidal range reaches a maximum of nearly 5.5 m near Schelle just south of Antwerp, but decreases significantly upstream, it is entirely blocked by the weir near Gentbrugge, see Van Braeckel et al. (Reference Van Braeckel, Piesschaert and van den Bergh2006) and Van Holland (Reference Van Holland2013) for detailed descriptions of this portion of the estuary.
2. Multi-channel system: The 95 km long estuary downstream of the Belgian-Dutch border is called the Western Scheldt (Fig. 1B). The width of the estuary varies between 2 and 8 km and channel depths generally range between 10 and 50 m, but locally scour holes up to 65 m in depth exist. The Western Scheldt exhibits multiple (2–3) parallel aligned channels, separated by shoal complexes and connected by smaller scale connecting channels (e.g., Van Veen et al., Reference Van Veen, van der Spek, Stive and Zitman2005; Van den Berg et al., Reference Van den Berg, Jeuken, van der Spek, Nordstorm and Roman1996; Jeuken, Reference Jeuken2000; Toffolon & Crosato, Reference Toffolon and Crosato2007; Van Dijk et al., Reference Van Dijk, Cox, Leuven, Cleveringa, Taal, Hiatt, Sonke, Verbeek, Speckmann and Kleinhans2021); see Fig. 1B for the present-day configuration of channels and shoals. The meandering ebb-channel is the main channel, whereas the parallel subordinate channels are flood channels. The ebb and flood channels tend to join in subtidal shoal areas. The general channel and shoal patterns have been described by Winterwerp et al. (Reference Winterwerp, Wang, Stive, Arends, Jeuken, Kuijper and Thoolen2001) as a series of macro- and mesocells (Fig. 2). These cells are based on morphological characteristics and associated tide-averaged sediment transport patterns (Jeuken, Reference Jeuken2000).
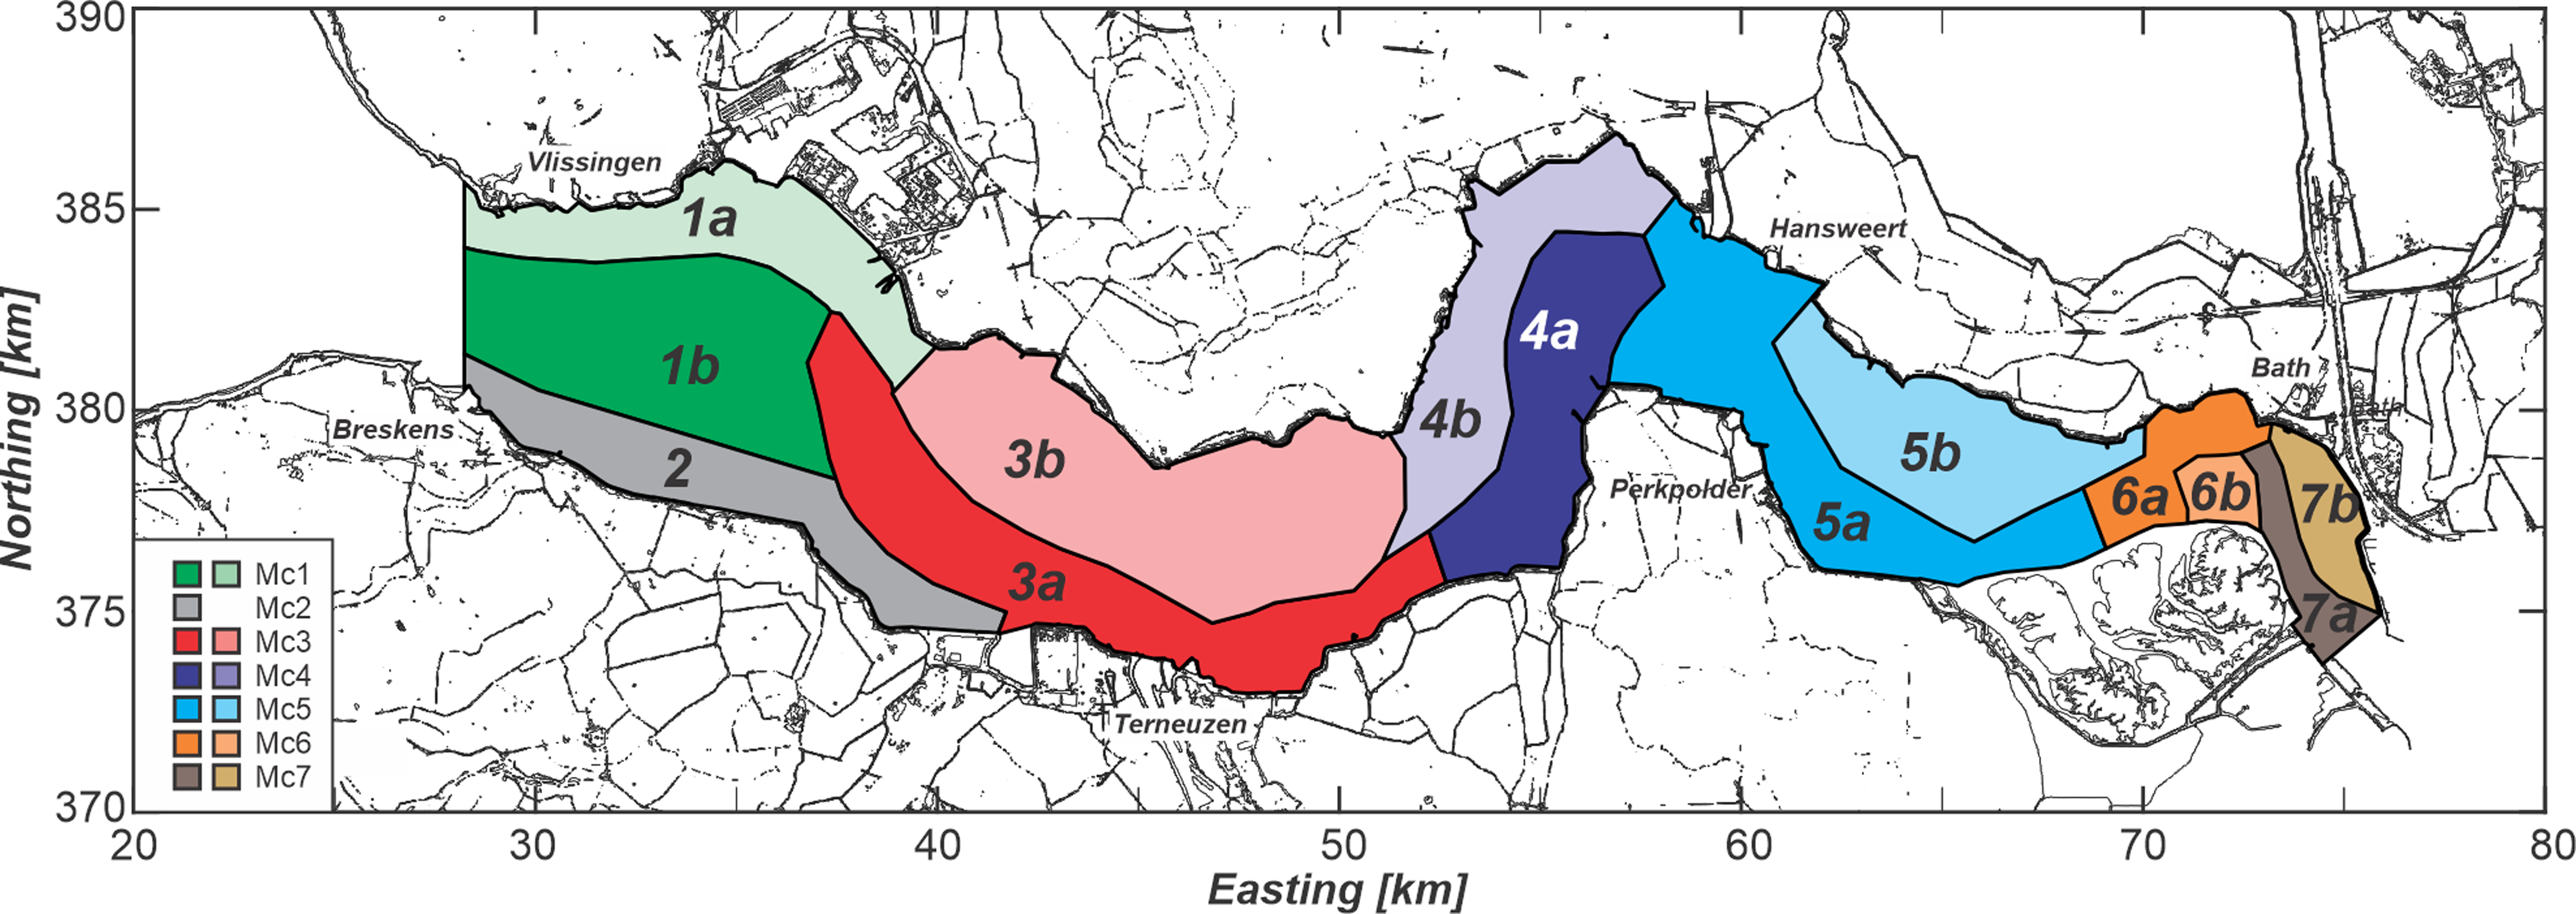
Figure 2. Overview of the macrocells in the Western Scheldt as used in this study. Macrocells (Mc) 1, 3, 4, 5, 6, and 7 are subdivided in part a, the main channel, and part b, the secondary channels and shoals. In the original definition by Winterwerp et al. (Reference Winterwerp, Wang, Stive, Arends, Jeuken, Kuijper and Thoolen2001), Macrocell 2 is referred to as Mesocell 2.
3. The mouth area of the Western Scheldt, seaward of Vlissingen, stretches from the island of Walcheren in the north into Belgian territorial waters in the south (Van Enckevoort, Reference Van Enckevoort1996). The mouth area is often referred to as an ebb-tidal delta. However, this is strictly speaking incorrect since most of the area lacks the typical morphodynamics of an ebb-tidal delta, namely, sand supply by ebb currents followed by redistribution by waves. Therefore, we use the non-specific description ‘mouth area’ consisting of the main channel Wielingen, the extensive subtidal shoal area Vlakte van de Raan to its north, and a dynamic channel-and-shoal area offshore southwest Walcheren (Fig. 1A). The southern morphological boundary is not clearly defined as the coastal zone merges into the Flemish Banks, consisting of shallow, shore-parallel sand ridges separated by well-developed troughs (Van Cauwenberghe, Reference Van Cauwenberghe1971). The transect from Vlissingen to Breskens is often used to distinguish between the mouth area and the estuary. However, Vandenbrunaewe et al., (Reference Vandenbruwaene, Plancke, Verwaest and Mostaert2013) indicate that this transition occurs 2 km seaward of this cross-section based on estuary width.
Processes shaping the estuary
Hydrodynamics
In the mouth area, waves and tides are the dominant forcing processes for flow and sediment transport. Waves drive sediment transports directly via currents due to radiation stress gradients generated by wave breaking of obliquely incident waves and due to wave asymmetry. Indirectly, waves enhance bed-shear stresses and stir-up sediment, allowing more sediment into suspension to be transported by the tidal and wind-driven flow. The wave climate is mild and mainly consists of locally, in the shallow North Sea basin, generated waves. Offshore, the annual mean significant wave height is around 1.3 m from the west-southwest, with a corresponding mean wave period of 5 s (Wijnberg, Reference Wijnberg2002). However, during storms, wind-generated wave heights occasionally exceed 6 m, and associated water-level surges of more than 2 m may occur. For example, the record surge height was NAP + 4.55 m in Vlissingen during the storm surge flooding of 1 February 1953. Wave-driven sediment transport is more important in the mouth area compared to the estuary, as the large and shallow Vlakte van de Raan shoal effectively shelters the estuary from the waves. At wave buoy Deurloo (see Fig. 1A for location), the year-averaged significant wave height varies between 0.7 and 0.9 m. In the estuary, at stations Hansweert and Bath, year-averaged significant wave heights range between 0.2 and 0.3 m (Barneveld et al., Reference Barneveld, Nicolai, van Veen, van Haaster, Boudewijn, de Jong, van Didderen, van de Haterd, Middenveld, Michielsen, van de Moortel, Velez and de Wild2018; Nederhoff, Reference Nederhoff2016).
Tides, forced by the semi-diurnal (progressive) tide in the North Sea, dominate the water motion and sediment transport in the estuary. The North Sea tide travels south to north along the Dutch coast and west to east into the estuary. The tidal wave amplifies and distorts as it travels up the estuary; the mean tidal range increases from 3.8 m at Vlissingen to 5.2 m at Antwerp, 78 km upstream (Jeuken, Reference Jeuken2000). The phase shift between the horizontal and vertical tide increases by roughly 2.5–3 hours from the mouth to Antwerp. The associated flood volumes reduce in a landward direction from an average of 1100 million m3 per tide at Vlissingen to 70 million m3 per tide at Antwerp (Gerritsen & De Jong, Reference Gerritsen and de Jong1983; Claessens, Reference Claessens1988; Baeyens et al., Reference Baeyens, van Eck, Lambert, Wollast and Goeyens1997). Peak tidal velocities range between 1–1.5 m/s, with maximum flood velocities consistently exceeding the maximum ebb velocities. Based on the large tidal range and low wave energy, the inlet classifies as tide-dominated (Davis & Hayes, Reference Davis and Hayes1984).
Fresh water inflows from the river Scheldt, tributaries and local drainage are small (<1% of the tidal prism) and average around 110 m3/s. Inflow is lowest in summer between 50–60 m3/s, and increases to 160–180 m3/s in winter (Ysebaert et al., Reference Ysebaert, Meire, Maes and Buijs1993; Van Maldegem et al., Reference Van Maldegem, Mulder and Langerak1993). Vandenbruwaene et al. (Reference Vandenbruwaene, Plancke, Verwaest and Mostaert2013) state that for a typical dry event during summer, the discharge can be as low as 34 m3/s, whereas, for typical flushing events, mostly during winter, it can reach 253 m3/s. As a result of the low freshwater inflow and large tidal range, the estuary is generally well-mixed, with the mean salinity decreasing from around 30 PSU at the mouth to 1 PSU just south of Antwerp (Baeyens et al., Reference Baeyens, van Eck, Lambert, Wollast and Goeyens1997; Vandenbruwaene et al., Reference Vandenbruwaene, Plancke, Verwaest and Mostaert2013). The small salinity gradients in the estuary are not likely to directly impact sand transports.
Bed characteristics
The multi-channel system and the mouth area of the estuary primarily consist of sand with a median grain size between 150 and 250 µm. Detailed measurements in the Wielingen channel (Santermans, Reference Santermans2013) show a mud content between 5–20% for the fraction <2 µm and 5–30% for the fraction 2–63 µm near Zeebrugge. However, mud accumulation can be significant in the harbour basins. An analysis of dredge deposits shows that in the coastal access channel to Zeebrugge, 60–70% of the dredged material consists of mud with median grain diameters below 63 µm. Towards the estuary, the mud content decreases, and sand fractions, defined as sediment with a d 50 > 63 µm, dominate (88–95%). An analysis of the McLaren dataset (McLaren, Reference McLaren1993, Reference McLaren1994) shows that in the top-layer sediment composition the sand fraction dominates the main channel and shoal areas (77–95%) with a median grain size ranging between 150 and 250 µm. Mud (<20% sand) covers less than 6% of the area of the Western Scheldt, sand (>80% sand) covers around 71% of the estuary bed, muddy sand (50–80% sand) about 12% and sandy mud (20–50% sand) 10%. More extensive mud deposits can be found along the shorelines and in shoal-sheltered areas (Fig. 3 and Table 1).
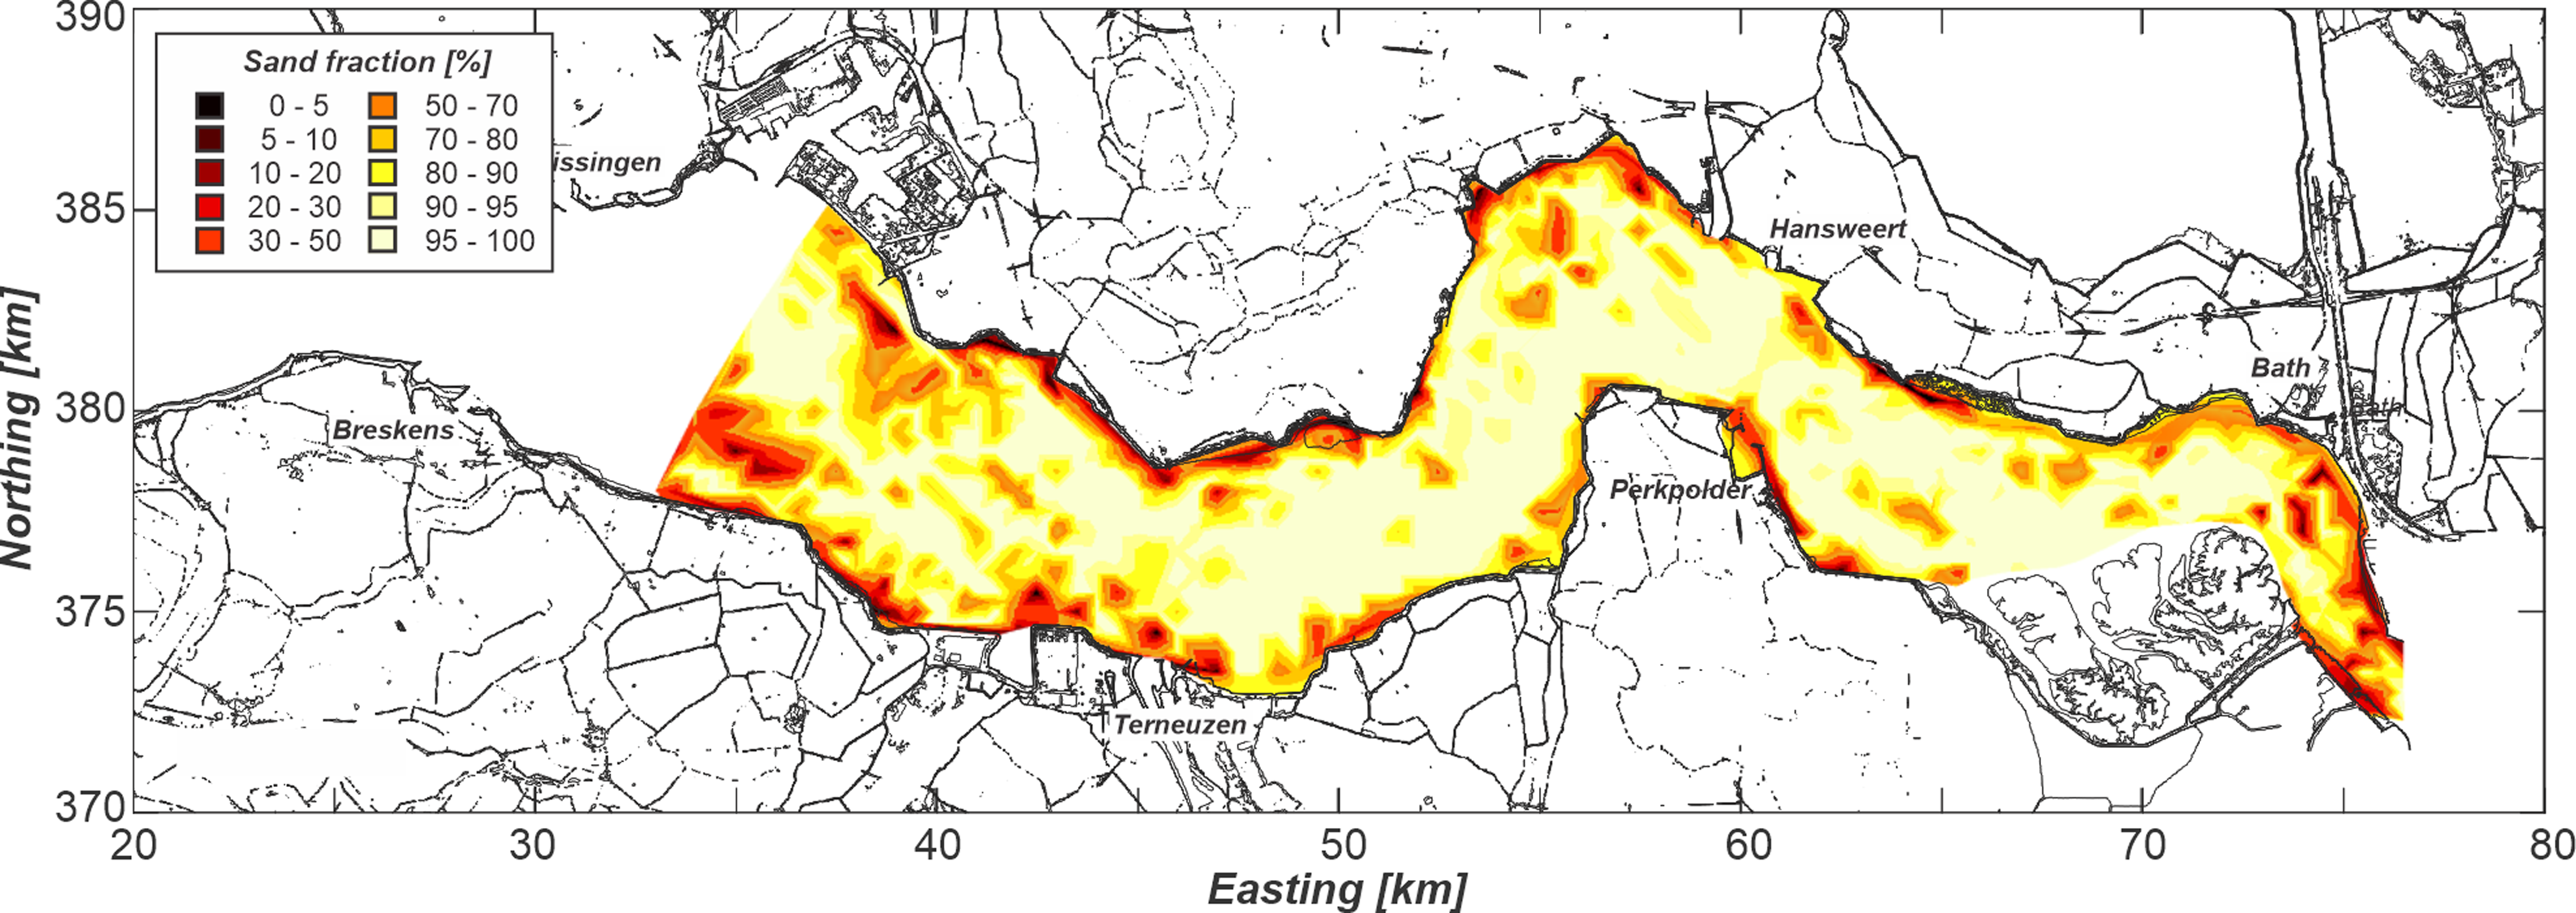
Figure 3. Bed composition map indicating the sand fraction percentage in the bed (top layer) based on the 1994 McLaren measurements. Data available from Rijkswaterstaat.
Table 1. Estimated sand content (%) in the bed based on McLaren (Reference McLaren1994) and subdivided into macrocells (Mc) and morphological elements as defined in Fig. 2.
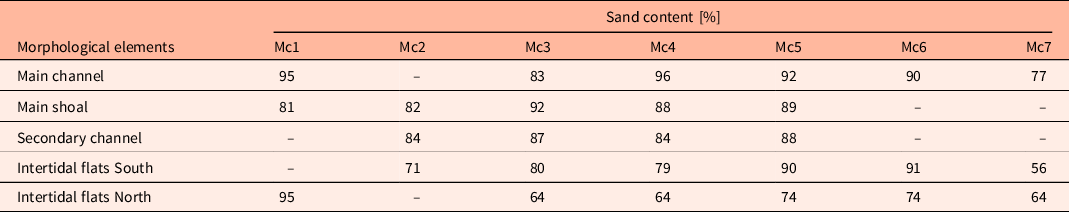
Main channel: area below NAP −2 m in Mc1a,b, Mc3a, Mc4a, Mc5a, Mc6 and Mc7.
Main shoal: shoal area between main and secondary channel and depths between NAP +3 and −2 m.
Secondary (side) channel: depth below NAP −2 m in Mc2, Mc3b, Mc4b, Mc5b.
Fringing intertidal flats south: area along southern embankment, depth between NAP +3m and −2 m.
Fringing intertidal flats north: area along northern embankment, depth between NAP +3m and −2 m.
Van der Spek (Reference Van der Spek1997) and Van der Vegt et al. (Reference Van der Vegt, van Onselen and van der Spek2021) point to the presence of erosion-resistant deposits in the subsurface of the Vlakte van de Raan and Wielingen that contribute to their stability. In the estuary, several geologic formations form erosion-resistant layers. The bed composition of these layers ranges from clay and peat layers to cemented sandstones (Gruijters et al., Reference Gruijters, Schokker and Veldkamp2004). The erosion-resistant layers are in many parts of the channels exposed on the channel flanks and floor and have noticeably influenced the morphodynamic evolution of the estuary (Dam & Cleveringa, Reference Dam and Cleveringa2013; Van der Vegt et al., Reference Van der Vegt, Mastbergen and van der Werf2020), but do not directly impact the sediment budget presented in this study.
Dredging, disposal and sand mining
Human activities play an important role in the morphological evolution of the estuary (Coen, Reference Coen1988; Jeuken, Reference Jeuken2000; Jeuken & Wang, Reference Jeuken and Wang2010; Vandenbruwaene et al., Reference Vandenbruwaene, Pauwaert, Meire, Plancke, Deschamps and Mostaert2019). Shore-protection works, including the building of dikes and reclamation of supra-tidal areas, started in the Middle Ages and evolved with time into large-scale reclamations and construction of dikes against flooding (see Section 4 and Supplementary material for more details). In addition to shore-protection works, dredging and disposal volumes increased over the last century (Belmans, Reference Belmans1988; Claessens et al., Reference Claessens, van Hoof and de Ruig1991; Kornman et al., Reference Kornman, Liek and Schippers2003; Santermans, Reference Santermans2013). In the Western Scheldt, dredging already started in 1923 with the removal of the sill near Bath, and dredging has continued ever since to maintain and improve access to the various ports along the estuary. The navigation channel was deepened in 1973–1976, 1997–1998 and 2010 by lowering the shallowest sills. In addition to channel deepening, the width of the main channel is maintained at 300 m east of Hansweert and mostly 500 m to the west (only at the sill of Borssele a width of 300 m is maintained).
The first and largest channel deepening was executed between 1973 and 1976, dredging approximately 57 million m3 of sediment resulting in the deepening of the shallowest sills by 2.5 to 3 m, which increased the depth of the navigation channel to NAP −14.5 m. Disposal occurred primarily in the secondary channels of the same macrocells and secondarily along eroding channel banks of the main navigation channel. During the second channel deepening (1997–1998), over 17 million m3 of sediment was dredged, primarily from shallow sills, to increase the navigation channel depth to NAP −16 m. The dredged sediments were relocated to the secondary channels in the western part of the estuary. During the most recent channel deepening in 2010, 7.7 million m3 of sediment dredging increased the main channel’s depth to NAP −17.2 m. Disposal locations included the secondary channels, the deepest parts of the main channel and the shallow subtidal, seaward-located tips of three intertidal shoal complexes.
In a natural channel, an equilibrium exists between the channel’s cross-sectional area and the local tidal prism (O’Brien, Reference O’Brien1931, Reference O’Brien1969). Pieters et al. (Reference Pieters, Storm, Walhout and Ysebaert1991) indicate that before dredging, from 1920 to 1930, the equilibrium depth of the sills in the navigation channel was 8–10 m. As the dredged channel is far past its equilibrium depth, it becomes an effective sediment trap and sediment deposition increases. As a result, maintenance dredging enlarged from less than 0.5 million m3/year before 1950 to 7–10 million m3/year at present (Fig. 4). Increasing maintenance dredging is a problem faced by most if not all industrialised inlets worldwide such as the Yangtze (Port of Shanghai), Elbe (Port of Hamburg), Weser (Port of Bremen) and Humber Estuaries (Van Maren et al., Reference van Maren, van Kessel, Cronin and Sittoni2015; Chen et al., Reference Chen, Dong, Xiao, Zhang, Tian and Zhou2016; Kerner, Reference Kerner2007; Antwerp Port Authority, 2012; also see www.tide-toolbox.eu). The dredging activities do not necessarily alter the magnitude of the annual sediment budget for the entire estuary as most of the sediments are relocated/disposed elsewhere within the estuary (Kornman et al., Reference Kornman, Liek and Schippers2003; Pieters, Reference Pieters1993). Disposal strategies have changed over time. Before 1997, most of the dredging took place in the eastern part of the estuary, and this material was deposited in the nearby secondary channels (strategy ‘East’). This strategy was economically most efficient, and it minimises the transfer of potentially contaminated sediment from the eastern part of the estuary to the western part. As dredging volumes increased, it was anticipated that this strategy would not be sustainable on the long term. To ensure the continued ‘natural’ dynamics of the channels and shoals in the estuary and to reduce dredging volumes, between 1997 and 2010, most sediment was therefore relocated to the secondary channels in the western part of the estuary, strategy ‘East - West’ (Liek, Reference Liek2001; Jeuken & Wang, Reference Jeuken and Wang2010). Kornman et al. (Reference Kornman, Liek and Schippers2003) concluded that this strategy did not result in reduced maintenance dredging. In 2010, a new disposal strategy called Flexibel Storten (which translates to Flexible Disposal) was implemented. The Flexible Disposal strategy aims to preserve the physical characteristics, such as the multichannel system and intertidal flat area, and thereby better retain the ecological value of the estuary (Roose et al., Reference Roose, Plancke and Ides2008; Plancke et al., Reference Plancke, Ides, Vos, Roose and Peters2010; Depreiter et al., Reference Depreiter, Sas, Beirinckx, Liek and Dorst2012). Disposal mainly occurs in the same or downstream macrocell, while the exact disposal location is adjusted based on extensive monitoring and adapting the disposal locations to minimise negative impacts. In addition to ecological benefits, disposal in the vicinity of the dredge locations also results in cost savings and less pollution due to shorter transit times of the dredge vessels.
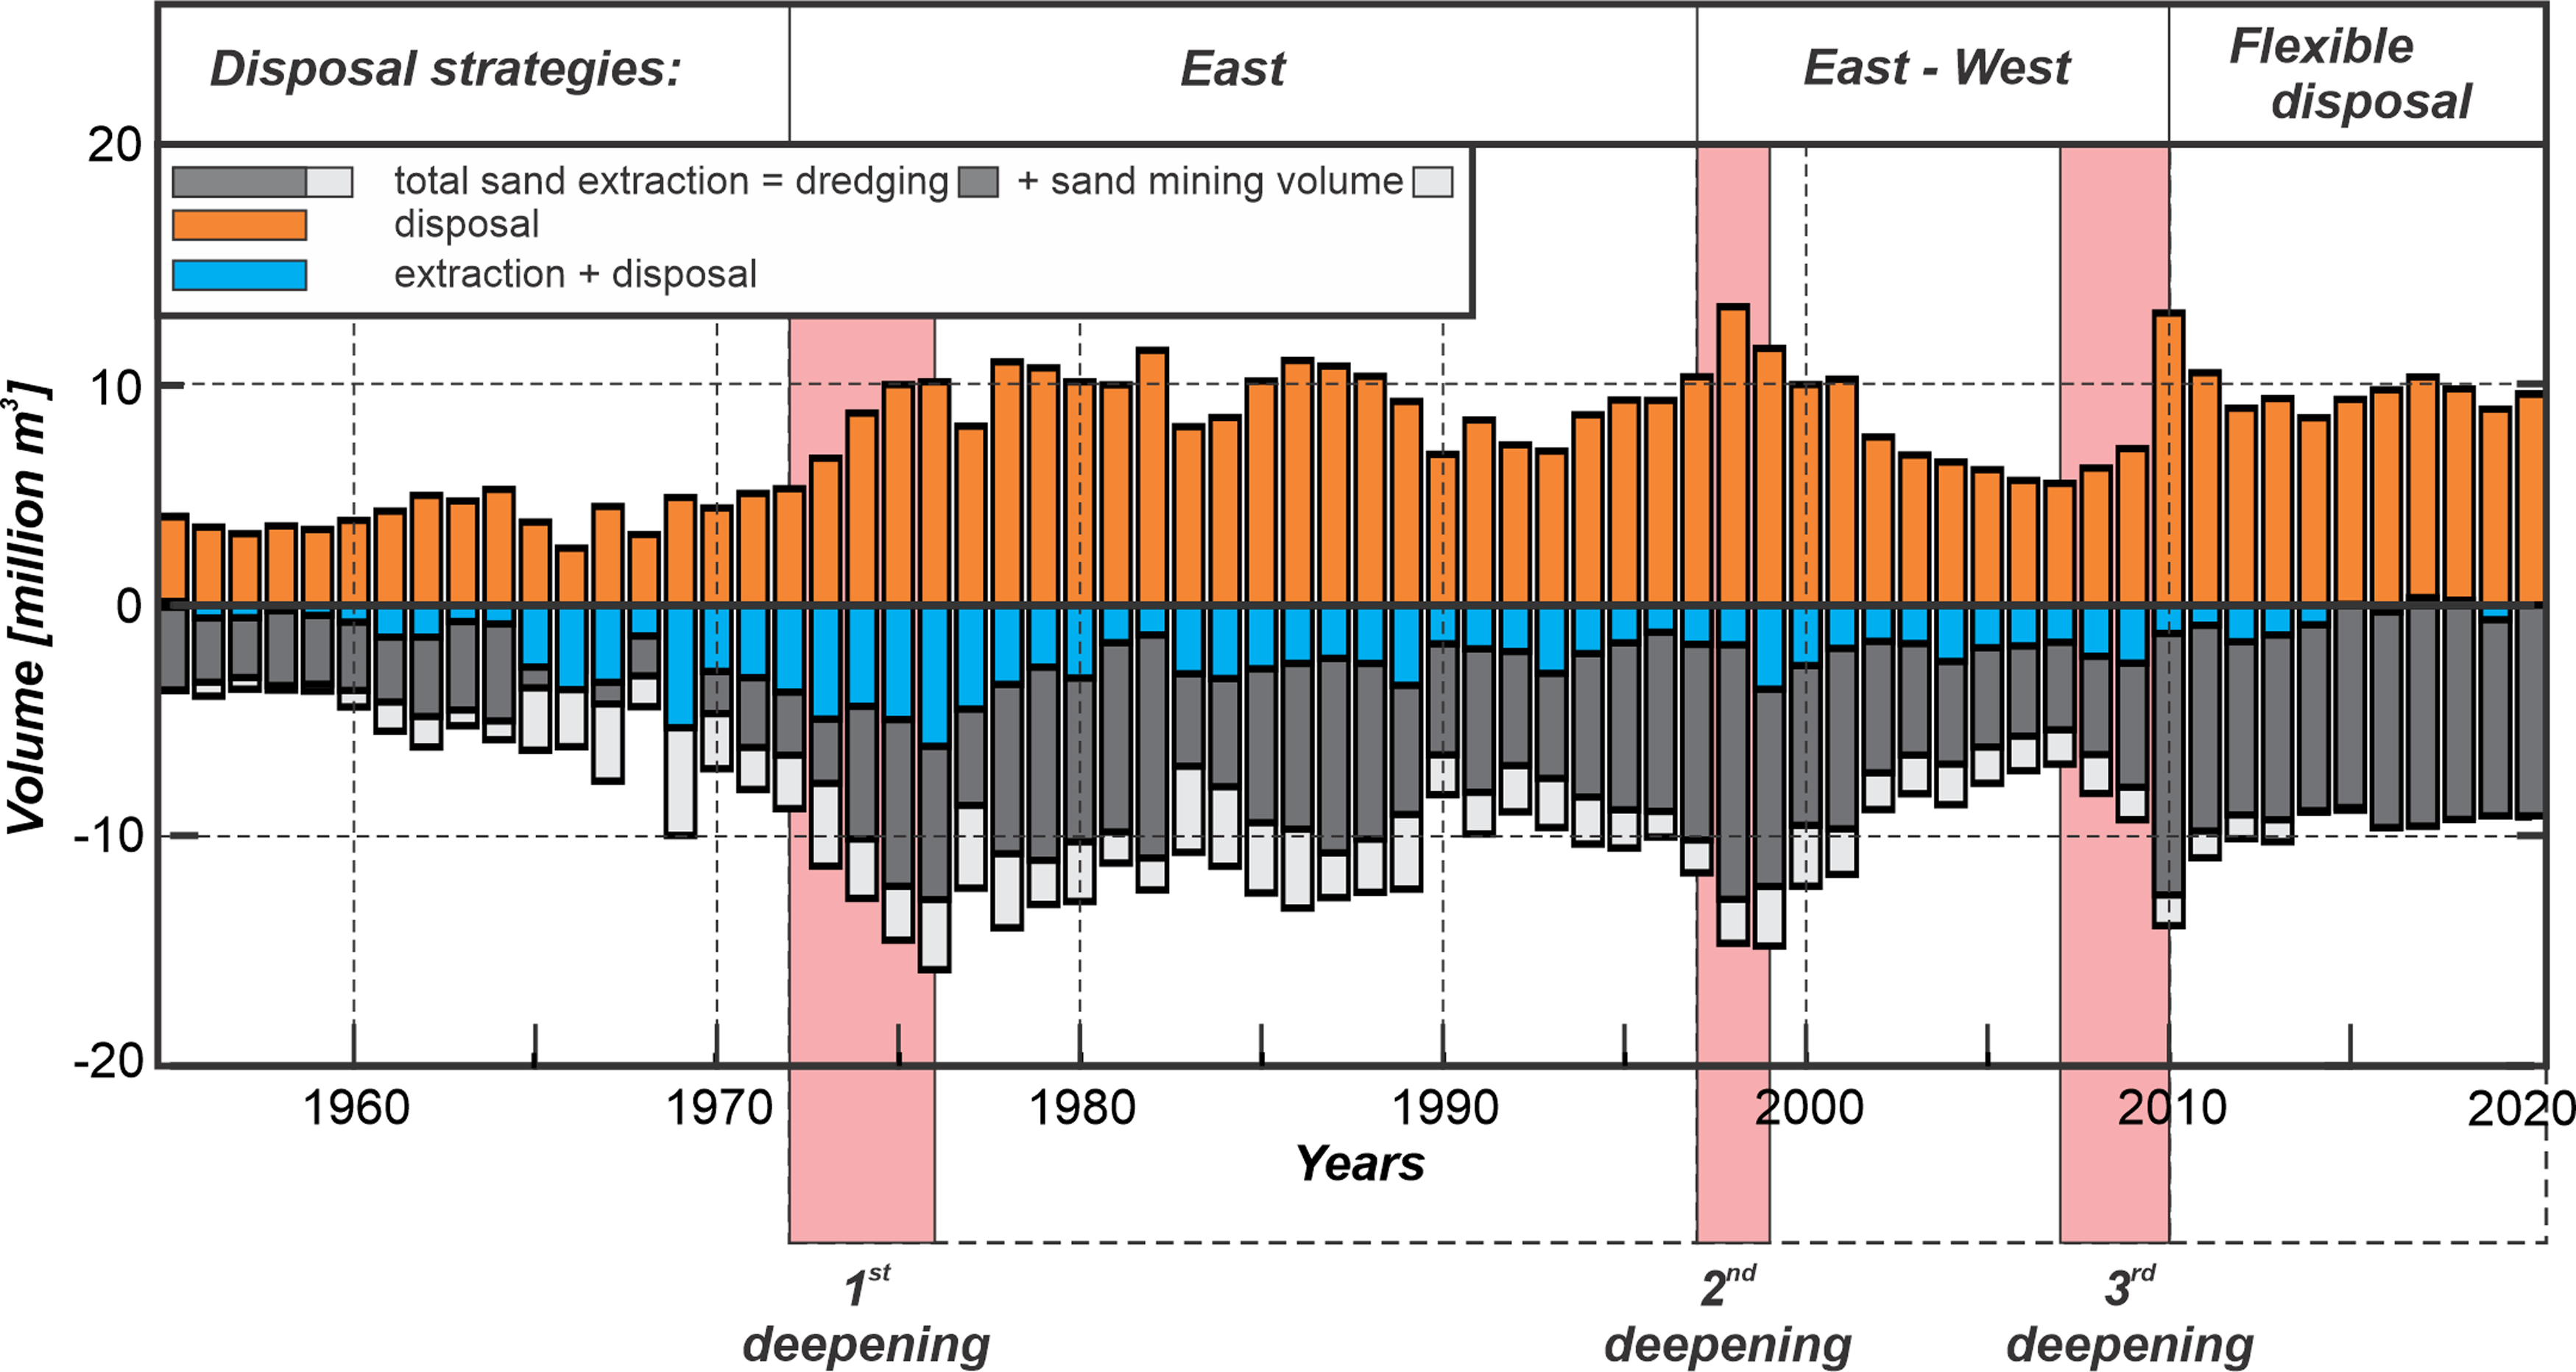
Figure 4. Overview of dredging, disposal and sand-extraction volumes in the Western-Scheldt estuary between 1955 and 2020.
In addition to dredging and disposal, 122 million m3 of sand was mined from the estuary between 1956 and 2014. In the Sea Scheldt, sand mining, 1 million m3/year on average, continues until today. As part of this mining occurs close to the Dutch-Belgian border, indirectly this mining may also result in sediment losses from the Dutch part of the estuary.
This study does not include the harbour basins along the Western Scheldt. These harbour basins act as (temporary) sinks for sediments, and extensive (70–90%) mud accumulations are found here (Van Maldegem et al., Reference Van Maldegem, Mulder and Langerak1993; Van Kessel et al., Reference Van Kessel, van der Werf and Giardino2012; Van Kessel et al., Reference Van Kessel, Vroom and Taal2023). Frequent dredging is therefore required. Between 1965 and 1987, on average, 1.9 million tons/year of mud was disposed back into the estuary, between 2002 and 2010 disposal ranges 1.4 and 1.8 million tons/year (Dam, Reference Dam2017). The proximity of the disposal areas close to the harbour basins predominantly introduces local effects on sediment transport patterns. Aggregated over the macrocells, the influence of the disposal is likely limited.
Available bathymetric data and data accuracy
Data
The morphodynamic evolution of the Western Scheldt between 1955 and 2020 is studied using a series of bathymetric maps compiled from the Rijkswaterstaat databases. These map sheets cover the estuary and its mouth up to the seaward NAP-20 m contour (Fig. 5A). The underlying bathymetric data are collected using ship measurements (single beam and multi-beam) for the domain’s wet, subtidal parts. Since 2001 the dry parts have been surveyed using LiDAR. Strict protocols are in place to combine data sets and transfer them to a pre-designed 20 × 20 m grid divided into map sheets (Van der Zijp, Reference Van der Zijp2001). Six map sheets cover the Western Scheldt and are available from 1955 onwards. Annual surveys have been available for this part of the estuary since 1996. Before it was surveyed bi-yearly, two subsequent surveys are needed to cover the estuary completely. The mouth area is surveyed less frequently, and more significant data gaps in the individual measurements occur. Elias et al. (Reference Elias, van der Spek and Lazar2016) composed complete maps of the mouth area from 1964 to 2014, and additional maps are created with recent measurements. These maps were generally composed of two subsequent surveys taken 1 year apart. The resulting total dataset contains bathymetric maps that allow an analysis of the complete system (Western Scheldt and its mouth area) over 1970–2021 for the area covered by the polygons shown in Fig. 5.
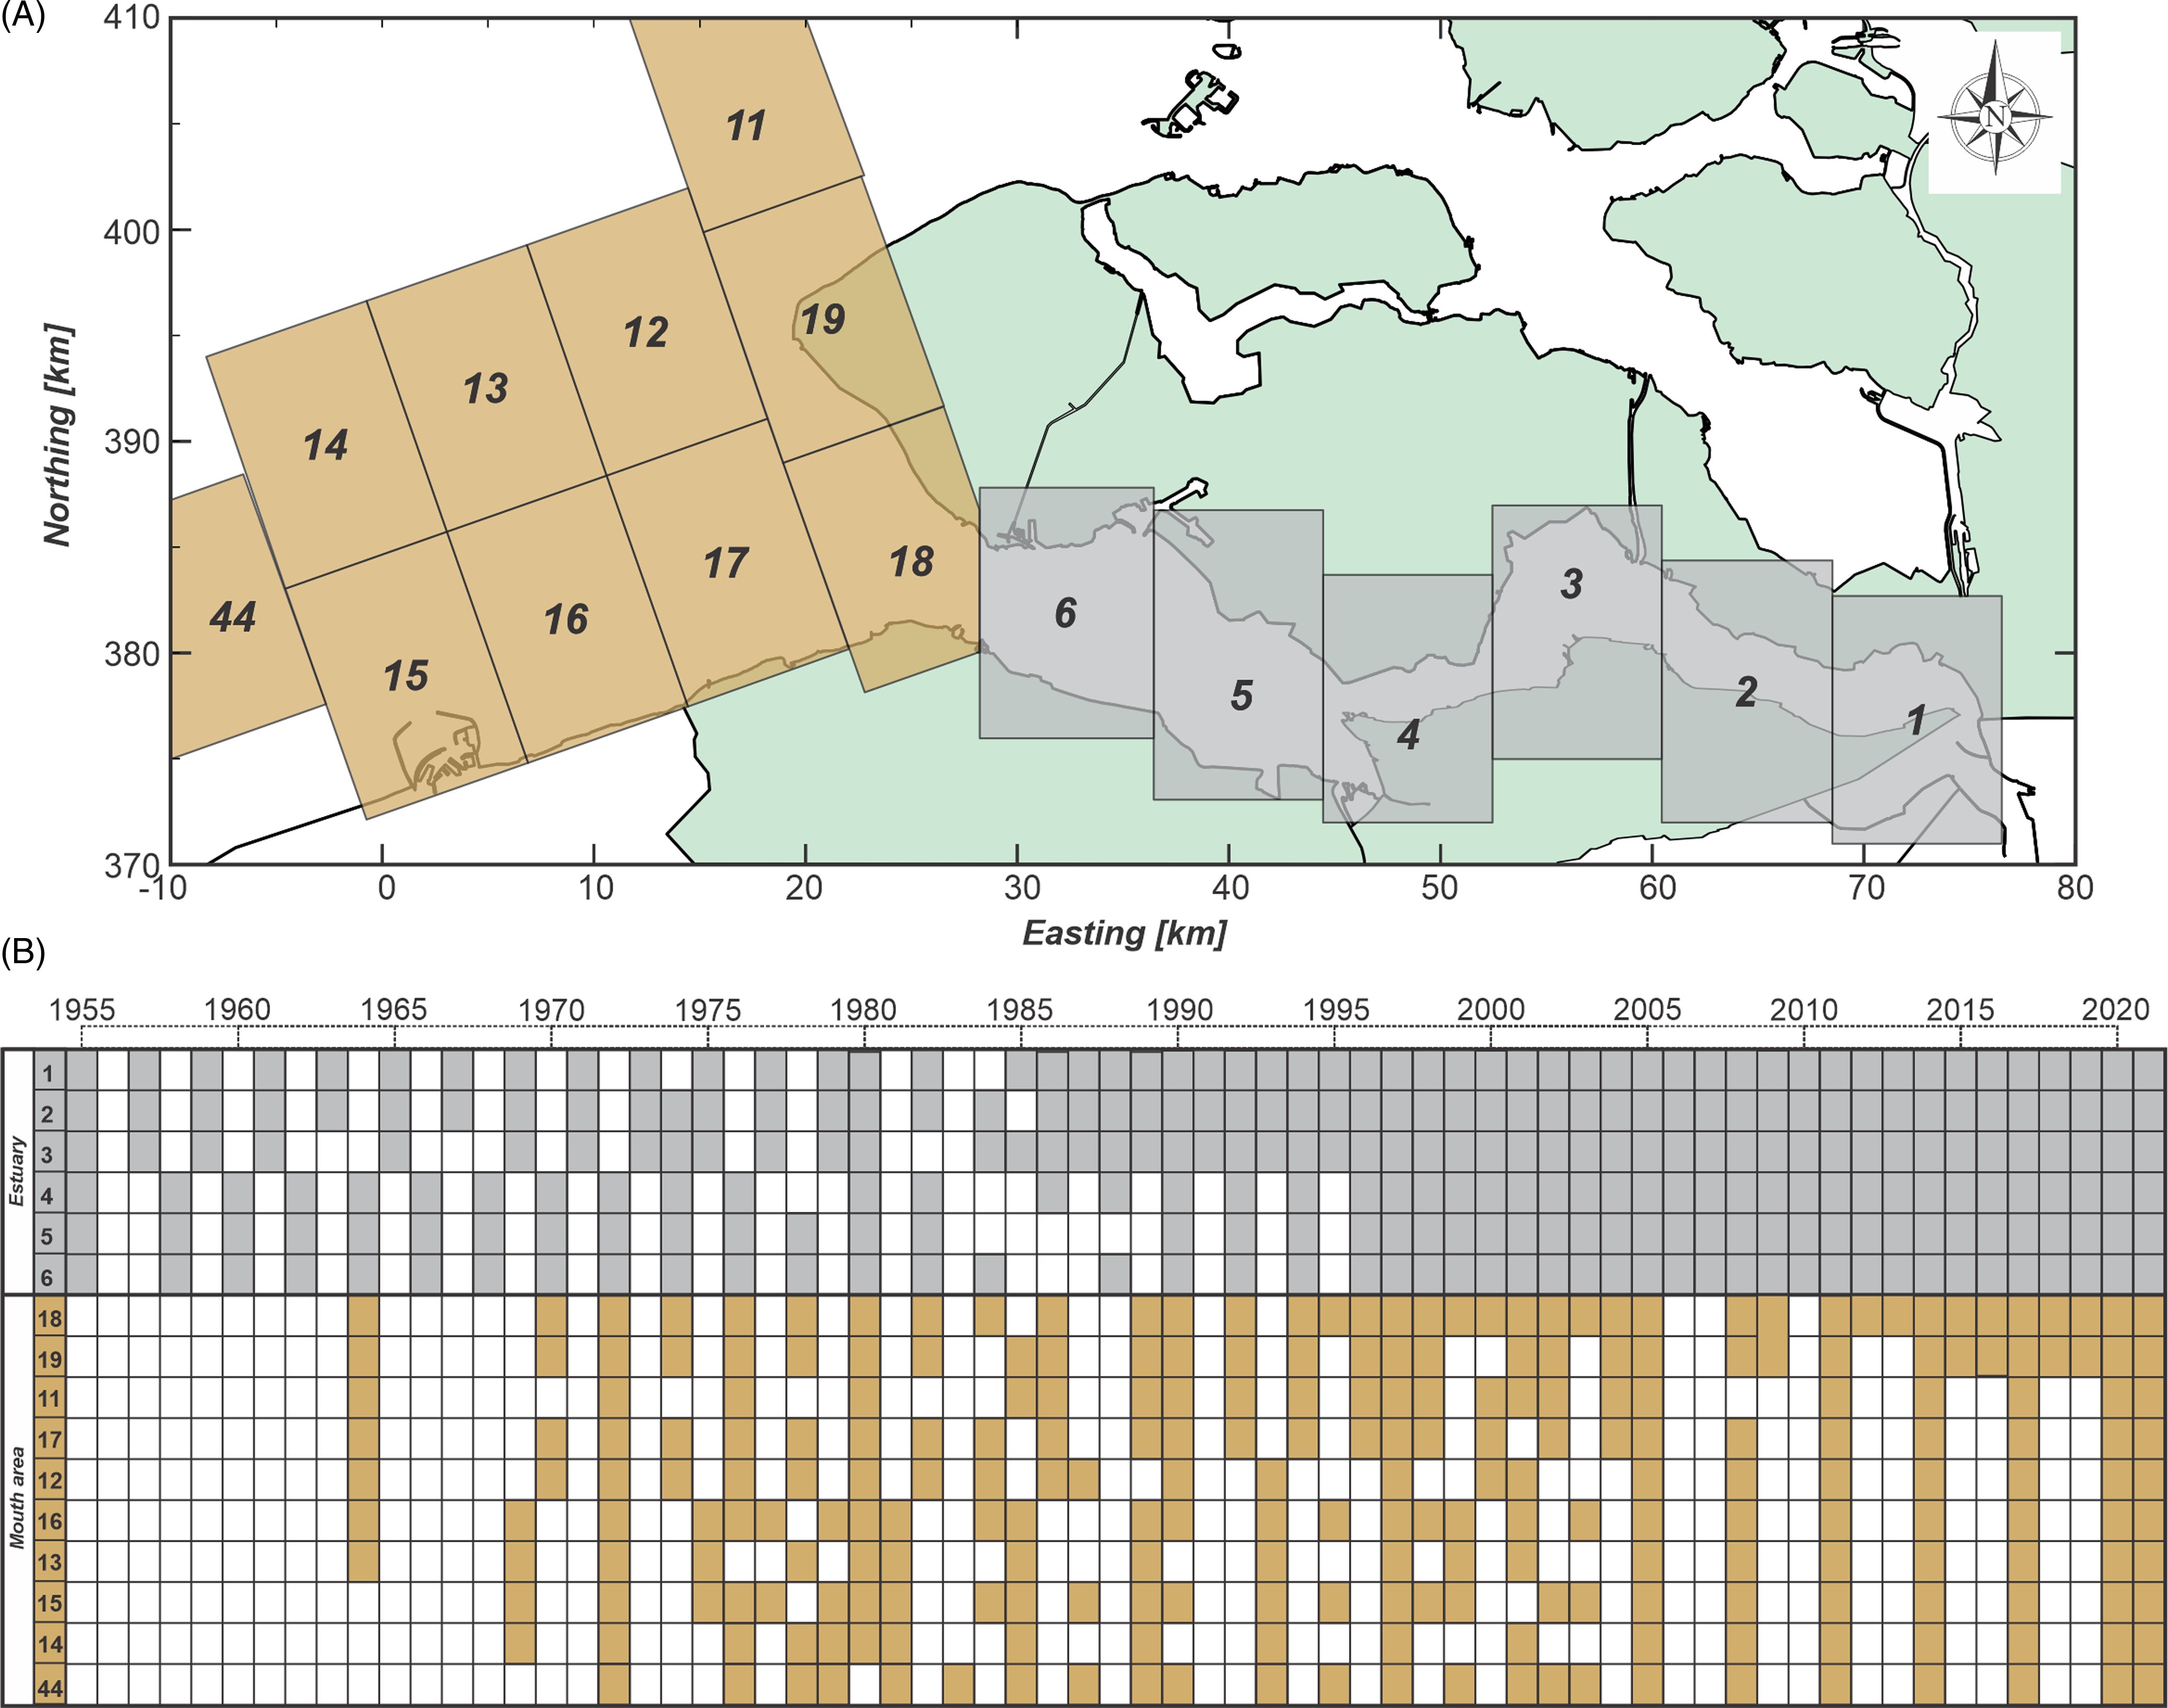
Figure 5. Overview of (A) map sheets on which bathymetric data is documented and (B) survey years of bathymetric maps used in this study.
Dealing with uncertainty and errors
The bathymetric data used in this study are not without flaws. A good understanding of the data accuracy is a prerequisite when assessing the sediment budget. Changes in survey techniques and instruments, positioning systems, variations in correction and registration methods and changes in interpolation techniques over time make it difficult to estimate the exact accuracy of the measurements and the resulting maps.
The vertical accuracy of the Vaklodingen data was estimated by Wiegmann et al. (Reference Wiegmann, Perluka, Oude Elberink and Vogelzang2005) and Perluka et al. (Reference Perluka, Wiegmann, Jordans and Swart2006) to range between 0.11 and 0.40 m. Storm et al. (Reference Storm, Bollebakker, de Jong and Mol1993) indicate that errors depend on the morphologic unit surveyed. For intertidal areas, channels and flats and channel slopes, stochastic (random) errors are 0.23, 0.19 and 0.39 m, respectively, and systematic errors (bias) are −0.20, −0.10, and −0.25 m. Marijs & Parée (Reference Marijs and Parée2004) provide a detailed overview of possible measurement errors focusing on the Western Scheldt datasets. See Supplementary material for a detailed elaboration of uncertainty and errors.
The importance of horizontal accuracy for the sediment budget depends on the method used to assess the volume changes and the nature of the changes and the slope of the bed (greater importance for steeper slopes because the same horizontal change causes a greater vertical change when the slope is steeper). The impact of the horizontal positioning accuracy on the sediment budgets depends on the choice of the sections and the characteristics of the changes in bathymetry. For example, when considering the Western Scheldt as a single section in the sediment budget, a slight shift in the position of its boundaries or shifts of the positions of the channels do not affect the water volume within the section. Determining the inverse of the water volume in the Western Scheldt over time is sufficient to determine its sediment budget.
When considering units with similar morphodynamic behaviour (areas of erosion and deposition) in the sediment budget, the spatial variations in depths and depth gradients determine whether a shift in a position significantly affects the sediment budget (Elias et al., Reference Elias, van der Spek and Lazar2016). For a large area with little spatial variations in depth, a shift in the horizontal position results in a small volume change. This is the overall situation in the Voordelta, including the mouth of the Western Scheldt. Conversely, a shift in the horizontal position results in a significant volume change for a small area with large spatial variations in water depth. In the Western Scheldt, this is the prevailing situation. Therefore, the sediment budget sections within the Western Scheldt are chosen sufficiently large (e.g., macrocell level) to reduce the impacts of horizontal positioning (in)accuracies.
Without having access to the actual ship data, correction for measurement error is not a trivial task and can only be performed based on expert judgement. The most obvious flaws in the bathymetric data can be corrected manually. Elias et al. (Reference Elias, van der Spek and Lazar2016) performed such correction for the mouth area based on visual inspection of the sequences of sedimentation-erosion maps. Careful inspection of these sequences allows identifying outliers and systematic inconsistencies in the data. Sounding sheets showing improbably large changes compared with preceding and following surveys in a few years were excluded from the analysis.
Morphological evolution of the Western Scheldt
A brief history
Comprehensive overviews of the natural processes and human interferences that have influenced the morphological evolution of the Western Scheldt estuary over the past two centuries are given by, e.g., Coen (Reference Coen1988), Van den Berg et al. (Reference Van den Berg, Jeuken, van der Spek, Nordstorm and Roman1996) and Van der Spek (Reference Van der Spek1997) and summarised in the Supplementary material.
The Western Scheldt came into being between the 14th and 16th centuries as the river Scheldt connected to the tidal basin of the Honte (see Vos, Reference Vos2015, p. 88−89 for a detailed account). By the 17th century, the Western Scheldt estuary had primarily formed. At this time, expansive channels, tidal flats and marshes along the northern side of the estuary were present that still connected the Western and Eastern Scheldt estuaries. These marsh areas and the connecting channels silted up naturally or were dammed in the following centuries (Van der Spek, Reference Van der Spek1997; Dam et al., Reference Dam, van der Wegen, Taal and van der Spek2022). Only the Verdronken Land van Saeftinghe (see Fig. 1 for location) has remained a central tidal marsh area. Land reclamations decreased the intertidal storage area from 295 km2 in 1650 to 196 km2 in 1800 and to 104 km2 in the recent Western Scheldt (Van der Spek, Reference Van der Spek1997).
In the estuary, meandering ebb channels dominate the morphological developments with annual migration rates of tens of meters between 1800 and 1930 (see maps in Supplementary material). This process was increasingly constrained around 1930 as the channels reached the protected embankments of the estuary (Van den Berg et al., Reference Van den Berg, Jeuken, van der Spek, Nordstorm and Roman1996). Migration now stopped, and channel banks steepened. As a result, bank failures and slides have been observed at various locations (De Bruin & Wilderom, Reference De Bruin and Wilderom1961; Mastbergen et al., Reference Mastbergen, Beinssen and Nédélec2019), prompting the further reinforcement of vulnerable channel walls with protective layers of gravel or slag.
Since the 1930s, the large-scale morphology of the Western Scheldt has been relatively stable, displaying a regular, repetitive pattern of mutually evasive meandering ebb channels and straight flood channels separated by sub- and intertidal shoals (e.g., Van Veen et al., Reference Van Veen, van der Spek, Stive and Zitman2005; Van den Berg et al., Reference Van den Berg, Jeuken, van der Spek, Nordstorm and Roman1996; Jeuken, Reference Jeuken2000; Toffolon & Crosato, Reference Toffolon and Crosato2007). Winterwerp et al. (Reference Winterwerp, Wang, Stive, Arends, Jeuken, Kuijper and Thoolen2001) refer to this repetitive pattern as a series of meso- and macrocells (Fig. 2). Despite stability on the macro level, large-scale dynamics of the smaller-scale channels and shoals can still occur (Fig. 6 and Supplementary material). A significant change is the shift of the main channel in the central part of the estuary. Untill 1982, the ebb channel along the northern embankment of the estuary (Middelgat) was the main navigation channel. However, a channel bend cut-off that originated in 1951 resulted in significant natural sediment deposition in the main ebb channel and erosion of the secondary flood-dominated channel (see, e.g., Jeuken, Reference Jeuken2000). The increased dimensions of the flood channel enabled a formal relocation of the navigation channel to this channel in 1982. Due to continued channel migration tendencies and channel deepening local maintenance dredging is required. At the same time, the entrance of the flood channel has been a sediment disposal location since the 1980s. Significant changes in the western part of the estuary resulted from the closure of the side channels Sloe and Braakman. Before the closure, these side channels were connected to the main channels in the estuary and mouth. As a result of the complete closures that occurred in the 1950s, these channels are gradually infilling (Dam, Reference Dam2017). Sedimentation in the now closed-off side channels Sloe and Braakman, which were sediment sinks up to 1955, is counted as export from (the present configuration of) the estuary. Bakker & De Loof (Reference Bakker and De Looff1977) show a sediment deposition of 20.6 million m3 in Sloe and 31.1 million m3 in Braakman between 1878 and 1952 and an additional 41.9 million m3 accreted on the marsh area of Saeftinghe.

Figure 6. Bathymetry of the Western Scheldt estuary for the representative years (A) 1970/71 and (B) 2020/21, based on Vaklodingen 2020 (mouth) and 2021 (estuary). The morphological changes over this interval are shown by the sedimentation-erosion patterns in panel (C).
The mouth area of the estuary
The mouth area of the Western Scheldt estuary stretches from the island of Walcheren in the north into Belgian territorial waters in the south (Figs. 1 and 6). The present-day lay-out of the mouth area (Fig. 6B), with the most prominent channel Wielingen in the south and a complex of tidal channels and shoals along the SW coast of Walcheren, came into existence about a century ago when the Deurlo, a third channel that dissected the large subtidal shoal Vlakte van de Raan, silted up. This morphological pattern persisted over the past 45 years. The formation of the two-channel system significantly impacted the morphodynamic processes in the northern part of the mouth area, where the main shoals and the channel Oostgat all rotated northward or moved landward (Van Enkevoort, Reference Van Enckevoort1996; Van der Slikke, Reference Van der Slikke1998). The increasing depth of the channel Wielingen contributed to the erosion of the Zeeuws-Vlaanderen coastline.
Based on the sediment budget, Elias et al. (Reference Elias, van der Spek and Lazar2016) computed a sediment loss in the Dutch part of the mouth area of 0.8 million m3/year over the time period 1965–2010 and a loss of 1.2 million m3/year between 1980 and 2010. Structural erosion occurs in the central part of the mouth area, the Vlakte van de Raan, and is estimated to be 0.7 million m3/year since 1984.
Elias & Van der Spek (Reference Elias and van der Spek2015) estimated the volume loss of the entire estuary mouth, including the Belgian part to range between 200 and 278 million m3 in the period 1980–2010. Large morphodynamic changes were observed around the harbour of Zeebrugge. The extension of the harbour jetties to 4 km length (1972–1986) resulted in large-scale scour around the jetties, and deepening of the entrance channel resulted in a nearly 50 million m3 sediment volume loss. Deepening of the Wielingen channel did not directly impact the sediment budget as the dredged deposits were disposed along the channel. Significant morphodynamic changes have occurred along the southwest Walcheren coastline (Fig. 6C), mainly caused by the migration of channels and shoals. The Oostgat channel is deepening slightly over its entire length; its seaward part offshore the western tip of Walcheren extends to the north. This channel, being close to the coastline, has resulted in coastal and channel bank erosion, necessitating frequent nourishments of the adjacent beaches. Extensive dune, beach and channel-bank nourishments (7.1 million m3) occurred in 2009 and 2010. Despite the large gross morphodynamic changes of nearly 170 million m3 between 1967 and 2011, the net 17 million m3 accretion is small and near-equal to the sand added along the coastline by nourishments. Nourishments have been frequently executed since 1952, although the majority (80%) of the 17 million m3 nourishment volume was supplied more recently (since 1991). Initially, the nourishments were executed as beach and dune nourishments, but since 2005 the erosion induced by Oostgat has been successfully balanced with channel-bank nourishments (9.1 million m3 in total). The channel-bank nourishments have stabilised the shoreface and shifted the channel offshore (Nederbragt & Koomans, Reference Nederbragt, Koomans and Sanchez-Arcilla2006; Dekker, Reference Dekker2012).
Substantial sediment losses, nearly 25 million m3, occurred along the Wielingen channel and the Zeeuws-Vlaanderen and Belgium coastlines between 1967 and 2011. These losses include the 15.3 million m3 of sand added to the Zeeuws-Vlaanderen coastline since 1971.
A noticeable feature in the volume time series of the mouth of the estuary (Fig. 7, raw data line) is the nearly 150 million m3 increase in sediment volume between 1964 and 1985 and the decreasing volumes since. Inaccuracies in the bathymetries play a role in this volume development as a close examination of the bathymetric maps revealed unrealistic bathymetric changes (Elias et al., Reference Elias, van der Spek and Lazar2016). However, correcting these maps for measurement errors is not a trivial task. An estimate of the uncertainty range is obtained by assuming that recent trends also represent long-term changes. Such estimates indicate significantly enlarged volumes before 1980 (Fig. 7, trend lines).

Figure 7. Overview of the computed volumes for raw and corrected data between 1964 and 2017 of the mouth area of the Western Scheldt relative to 2014.
Hydrodynamic changes
Tidal amplification, deformation and the morphological development of a natural estuary are closely linked (Dronkers, Reference Dronkers1986; Friedrichs & Aubrey, Reference Friedrichs and Aubrey1988). Tidal amplification is the change in tidal range over the estuary relative to the tidal range at its mouth and can be expressed by the amplitude-ratio of the semi-diurnal tide between two stations. Tidal deformation refers to the distortion of the tidal wave and changing the tidal asymmetry as the tide propagates through the estuary. Tidal asymmetry in shallow estuaries can be represented by the non-linear growth of the compound constituents and harmonics of the principal tidal components (Friedrichs & Aubrey, Reference Friedrichs and Aubrey1988; Speer et al., Reference Speer, Aubrey, Friedrichs and Parker1991). The ratio between the amplitude of the semi-diurnal tide (D2) and its overtide (D4) determines the strength, while the phase difference describes the nature of the asymmetry (ebb- or flood dominant) and can directly be determined by comparing the durations of flood and ebb flow (Dronkers, Reference Dronkers1986) or by comparing the durations of rising tide and the falling tide from water levels (Wang et al., Reference Wang, Vandenbruwaene, Taal and Winterwerp2019).
Asymmetry of the horizontal tide is an essential factor for residual sediment transport. Shorter and stronger flood flow leads to landward sediment transport, referred to as flood-dominant asymmetry of the horizontal tide. In an estuary with low river flow like the Western Scheldt, the asymmetry of the horizontal tide at a particular cross-section is directly related to the asymmetry of the vertical tide in the part of the estuary landwards of the cross-section.
The tidal amplification and deformation are analysed using the water level observations from Vlissingen, Terneuzen, Hansweert and Bath (see Fig. 1 for locations). Continuous hourly water level records between 1971 and 1987 are available for these stations, while the data since 1987 have 10-minute intervals. The daily tidal characteristics were determined by analysing individual 25-hour (until 1987) or 24-hour and 50-minute time series. The daily mean water level (a 0 ) and amplitude and phase of the diurnal (a 1 and ϕ 1 ), semi-diurnal (a 2 and ϕ 2 ) and overtide (a 4 and ϕ 4 ) were determined through Fourier analysis. The falling (T f ) and rising tides (T r ) durations are determined directly from the entire time series. Tidal asymmetry is described through the relative phase-difference between the quarter-diurnal and the semi-diurnal tides (Fig. 8C) and by the ratio between the rising and falling period, T r /T f , (Fig. 8D).

Figure 8. Development of the tidal amplification and deformation in the estuary based on year-averaged values for (A) Amplitude ratio and (B) phase lag of the semi-diurnal tide in the estuary relative to the station Vlissingen at the mouth; (C) the phase difference between the quarter-diurnal (D4) and the semi-diurnal (D2) tides and (D) the ratio between the periods of rising (Tr) and falling tides (Tf). Grey shading indicates the time periods of main channel deepening.
Tidal amplification and phase lag
The semi-diurnal tidal amplitude increased in the landward direction since 1971 as the amplification factor, i.e., the amplitude ratio relative to the station Vlissingen at the mouth, exceeds 1 at all three stations in the estuary (Fig. 8A). In the western part of the estuary, the mean amplification factor remained constant between 1970 and 2020. At station Bath, the amplification factor increased by 6% from nearly 1.15 in 1971 to 1.23 in 2020. The phase lag of the semi-diurnal tide remained constant between Vlissingen and Hansweert, but decreased over time between Hansweert and Bath (Fig. 8B). This decrease in phase lag represents a faster tidal wave propagation in the eastern part of the estuary. Both effects, increase in amplification and faster propagation, are an expected result of the increasing depth of the navigational channel.
Tidal asymmetry
Between 1970 and 2020, the relative phase difference between D4 and D2 at the mouth of the estuary (Vlissingen) showed fluctuations between 0° and −10°, which indicates flood dominance (Fig. 8C). Flood dominance also occurs at station Terneuzen. At this station, the increasing phase difference from 0° around 1970 to −10° at present indicates that the strength of the flood dominance increased. More considerable but opposite changes occurred at stations Hansweert and Bath. A large, positive (20°) phase difference at Hansweert indicates ebb dominance in 1970. This phase lag decreased to around 2° in 1985 and retained a mostly positive value until 2008. At present, a negative phase lag of −8° indicates a flood-dominant behaviour. The change in phase lag for station Bath is opposite to Hansweert between 1970 and 2010 as the phase lag reduced from −30° (strongly flood dominant) to around 0° (no dominance). Since 2010 trends are similar to Hansweert, with an increasing flood dominance. At present, all stations in the estuary show flood dominance with a phase lag between −8 and −14° in 2020.
Defining the tidal asymmetry as the ratio between the rising and falling tide produces values between 0.86 and 1 for all stations (Fig. 8D). These values imply that the entire estuary has been flood dominant since 1970, and except for station Bath, flood dominance has increased. The most significant increase occurred at Hansweert between 1970 and 1985 (after the first channel deepening).
Relatively, both indicators for tidal asymmetry show the same changes in the strength of the tidal asymmetry at the various stations. However, in an absolute sense, the two parameters do not indicate the same nature of tidal asymmetry. Based on the phase difference, the estuary is mostly flood dominant, while based on the duration ratio the estuary has been flood dominant over the whole period. This difference shows that just considering the relative phase lag between the quarter-diurnal and semi-diurnal tide is insufficient to characterise the tidal asymmetry in the Western Scheldt estuary; it requires the consideration of the entire water level signal to determine the duration ratio of the ebbing and flooding tide.
Large-scale sediment budget for the estuary; 1955–2020
Method
Sediment budget
Sediment budgets provide a powerful method to structure all contributions to the sediment volume change of the estuary (Reid & Dunne, Reference Reid and Dunne1996; Rosati, Reference Rosati2005; Frings et al., Reference Frings, Hillebrand, Gehres, Banhold, Schriever and Hoffmann2019). The sediment budget was resolved volumetrically and not strictly as a mass balance. This approach was justified given the dominance of the sand fraction, and all sources and sinks to the sediment budget can either be volumetrically derived from the data or literature. The sediment budget can be computed from the bed level measurements (dV), the changes caused by human interventions (V DREDGE , V DISPOSAL and V SANDMINING ) and the exchange fluxes between the mouth area (V WS ), Sea Scheldt (V SCHELDT ) and Land van Saeftinghe (V SAEF ):
dV = V WS – (V SCHELDT + V SAEF ) + (V DISPOSAL – V DREDGE – V SANDMINING )
This sediment budget is resolved on several scale levels: (1) the scale of the estuary, (2) the eastern (Mc1, Mc2, Mc3 and Mc4) and western parts (Mc5, Mc6 and Mc7) of the estuary and (3) on the level of the macrocells (Fig. 9). The upper height limit for the bathymetric measurements in the estuary was set at NAP +3.0 m. The considered area includes all intra- and supratidal shoals and marshes and minimises potential errors due to differences in coverage along the diked shorelines. For each macrocell, an addition subdivision in 5 morphological units was made. These units were defined as:
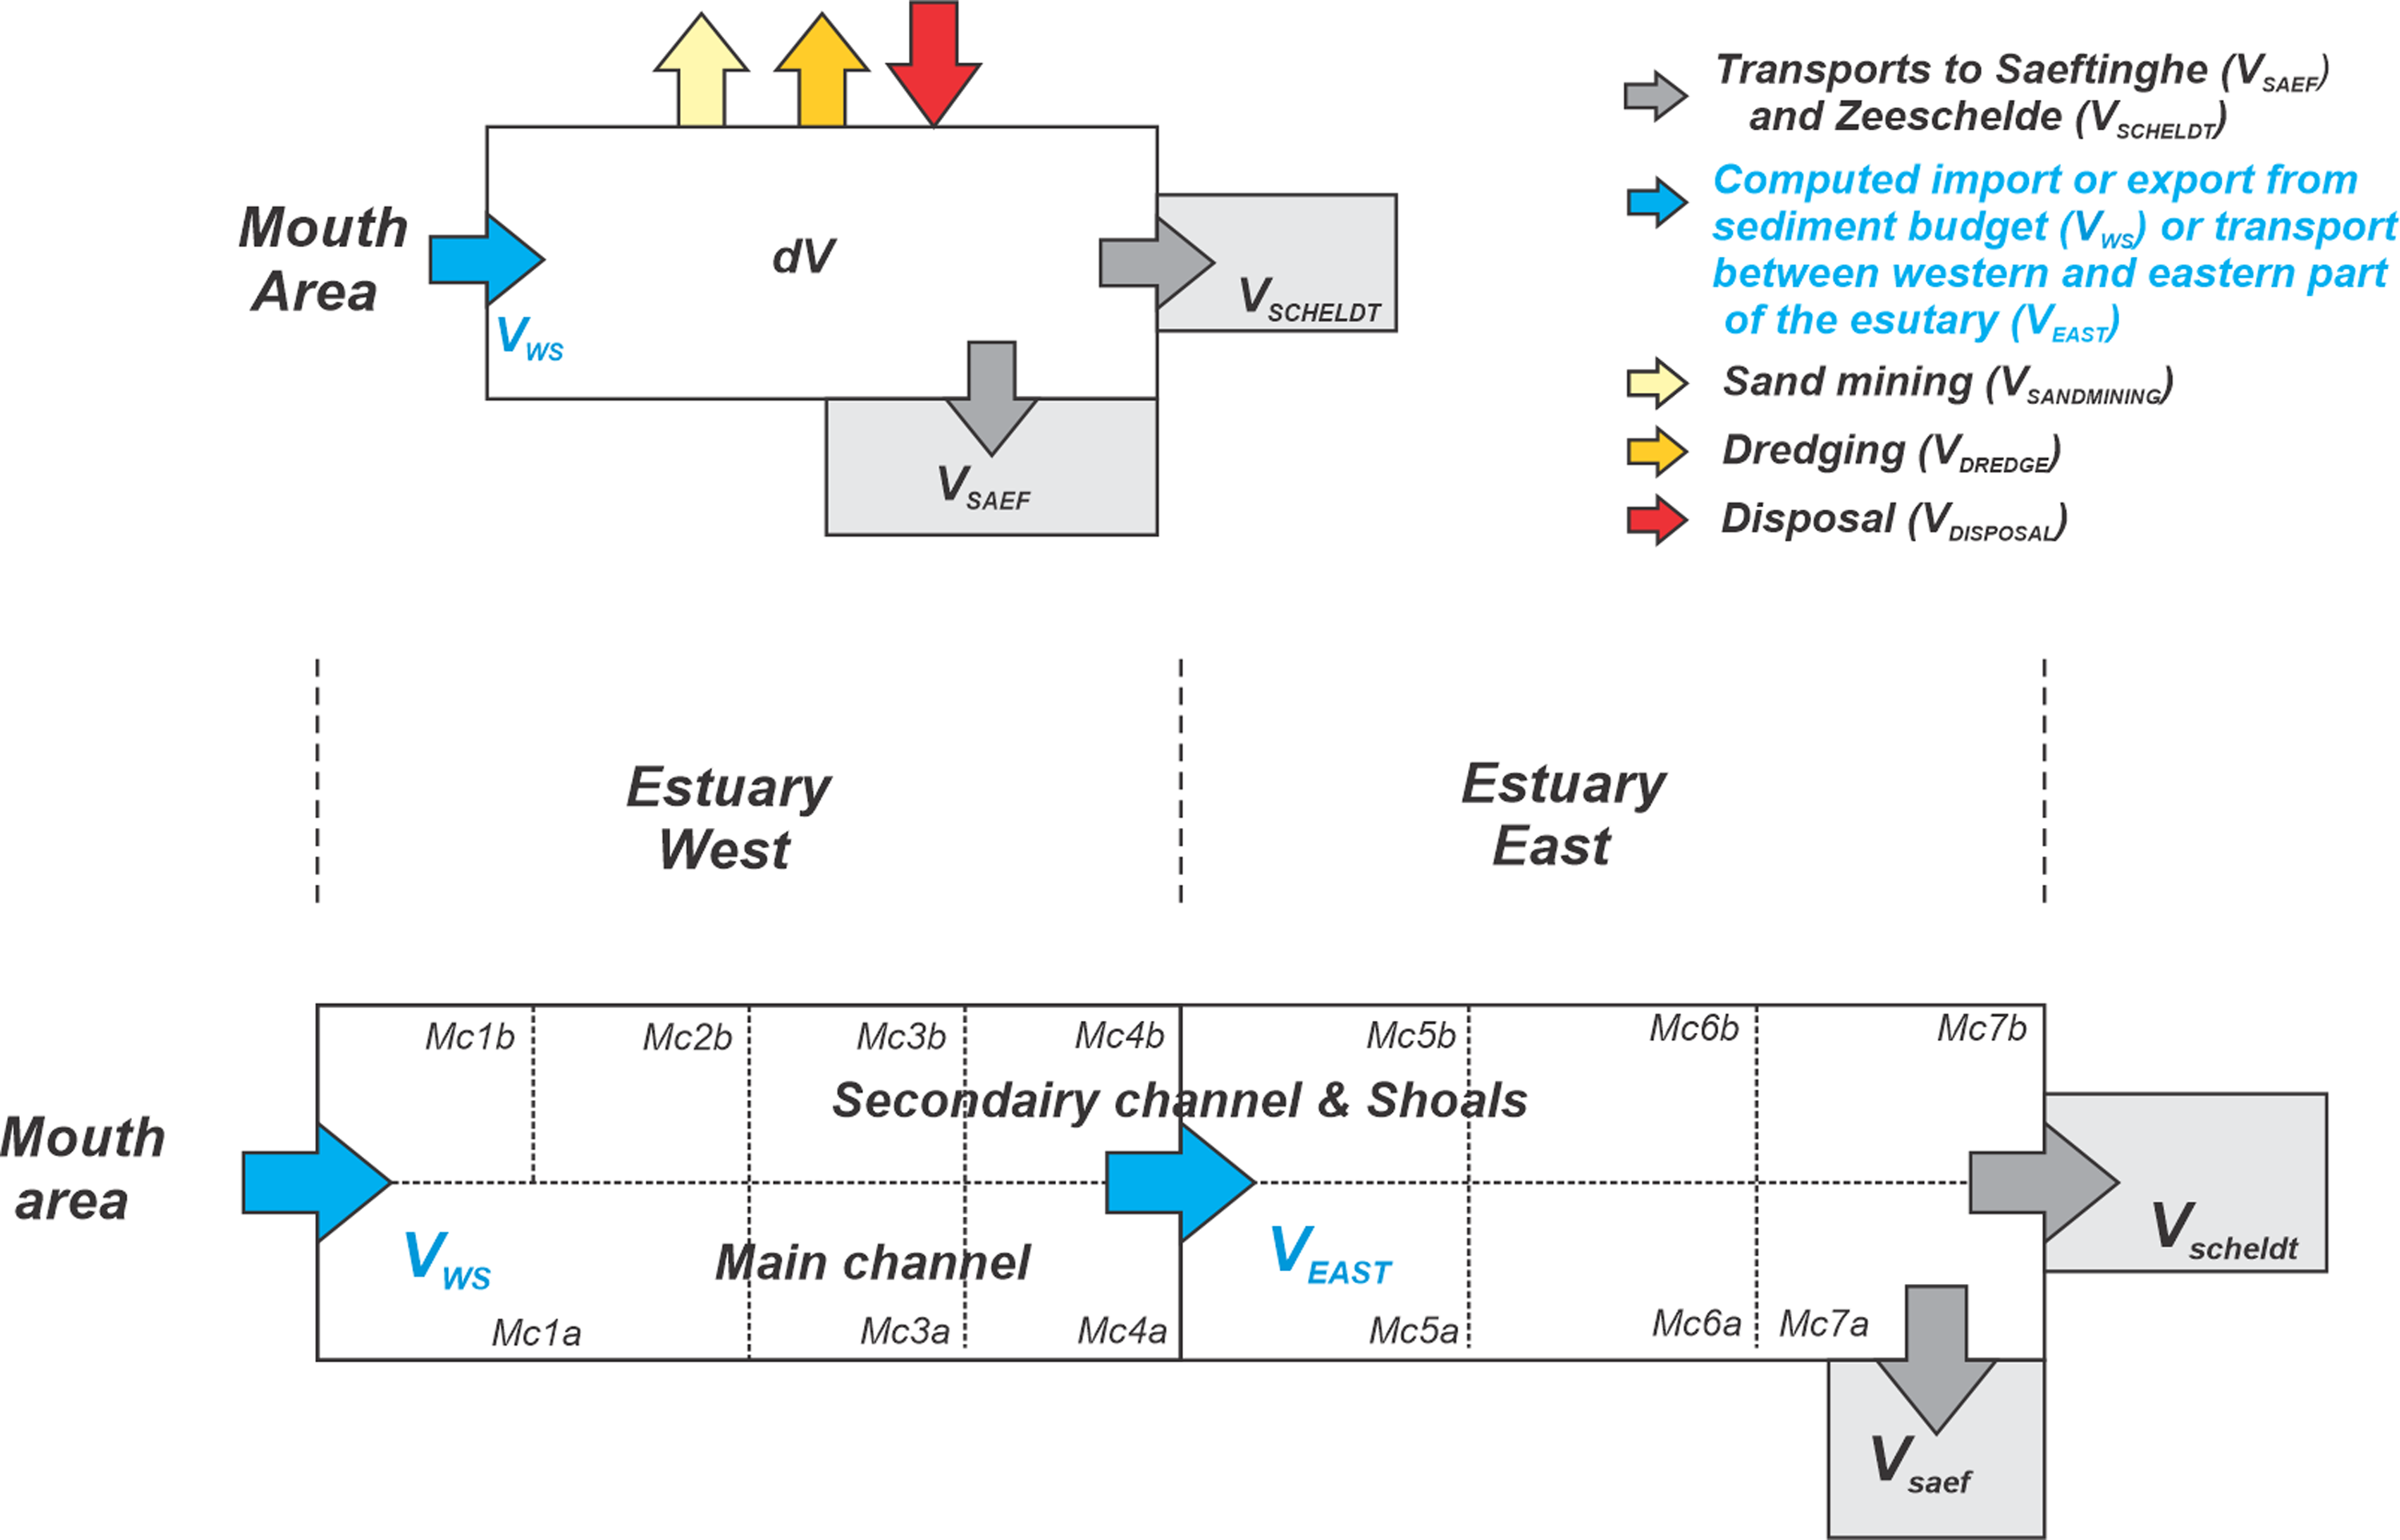
Figure 9. Principal description of the sediment budget used in this study.
-
1. main channel: area below NAP −2 m in Mc1a,b, Mc3a, Mc4a, Mc5a, Mc6 and Mc7,
-
2. main shoal: the shoal area between the main channel and the secondary channel and depths above NAP −2 m,
-
3. secondary (side) channel: area below NAP −2 m in Mc2, Mc3b, Mc4b, Mc5b,
-
4. fringing intertidal flats south: the area along the southern embankment, bed level between NAP +3 m and −2 m and
-
5. fringing intertidal flats north: the area along the northern embankment, bed level between NAP +3 m and −2 m.
Except for Macrocell 2, where no main channel is present, for each macrocell the morphological units were grouped in two elements that represent the (a) main navigation channel and (b) all other channels and shoals (the secondary channel & shoals).
Additional sediment sources, sinks and assumptions
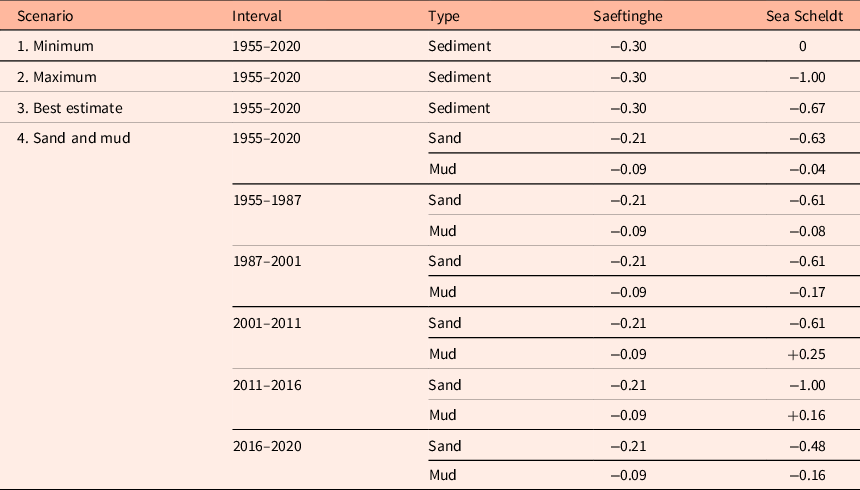
Saefthinge. The large marsh area Verdronken Land van Saeftinghe is not well represented in the data before 2001, while LiDAR data after 2001 may include erroneous heights (Cleveringa, Reference Cleveringa2013), and is therefore not directly computed from the bathymetric data. An estimate for the volume losses (V SAEF ) of 0.3 million m3/year based on the values used in previous studies (Houtekamer, Reference Houtekamer1995; Storm & Pieters, Reference Storm and Pieters1994; Uit den Bogaard, Reference Uit den Boogaard1995, Nederbragt & Liek, Reference Nederbragt and Liek2004; Haecon, 2006) was added to the sediment budget. A literature review of mud in the Sea Scheldt by Dams et al. (Reference Dams, Vanlede, Plancke, Verwaest and Mostaert2016) concludes that mud accumulation in Saeftinghe ranges between 0.06 and 0.12 million m3/year. This study used an average value of 0.09 million m3/year for the mud contribution, which leaves 0.21 million m3/year for the sand deposition.
Sea Scheldt. Bathymetric measurements of the Sea Scheldt are less frequent compared to the estuary and only available in 10-year intervals. The morphodynamic changes are dominated by large-scale dredging and disposal. Haecon (2006) estimated a 1.0 million m3/year sediment loss to the Sea Scheldt between 1955 and 2004. A literature review of mud in Sea Scheldt by Dams et al. (Reference Dams, Vanlede, Plancke, Verwaest and Mostaert2016) concluded that the annual mud transport to Saefthinge and Sea Scheldt combined averaged 0.17 million m3/year before 1987 and increased to 0.26 million m3/year since 1987. This increase is related to large-scale mud extraction in the Sea Scheldt that started around this time. Vandenbruwaene et al. (Reference Vandenbruwaene, Levy, Plancke, Vanlede, Verwaest and Mostaert2017) computed a net downstream mud transport of 0.25 million m3/year between 2001 and 2011, and a net upstream sand transport of 0.61 million m3/year. The recent studies of Planke et al. (Reference Plancke, Vos, Meire and Mostaert2021) and Vos et al. (Reference Vos, Plancke, Meire and Mostaert2021) compute an upstream sand transport of 1.0 million m3/year and a downstream mud transport of 0.16 million m3/year in the period 2011–2016. Between 2016 and 2019, both the mud and the sand transports are upstream directed with values of 0.16 million m3/year and 0.48 million m3/year, respectively.
Given the uncertainty in annual sediment exchange between the estuary and the Sea Scheldt, the sediment budget is resolved for four scenarios of sediment exchange (Table 2). In the ‘minimum’ scenario, no sediment exchange is assumed to occur (Scenario 1); in the ‘maximum’ scenario (Scenario 2), the values, as proposed by Haecon (2006), are applied. A ‘best estimate’ scenario (Scenario 3) uses the estimates of Dams et al. (Reference Dams, Vanlede, Plancke, Verwaest and Mostaert2016) before 2001 and the results of Vandenbruwane et al., (Reference Vandenbruwaene, Levy, Plancke, Vanlede, Verwaest and Mostaert2017), Planke et al. (Reference Plancke, Vos, Meire and Mostaert2021) and Vos et al. (Reference Vos, Plancke, Meire and Mostaert2021) for the more recent (2001–2020) period. Scenario 4 uses the same estimates as Scenario 3, but distinguishes between sand and mud transport.
Table 2. Sediment transport rates for exchange between the estuary and the Verdronken Land van Saeftinghe and Sea Scheldt in millions m3/year (negative values = upstream transport, sediment export from the estuary, positive values= downstream transport).
The macrocell sediment budget uses Scenario 3 as an assumption for V SCHELDT and V SAEF at Mc7. This assumption allows to compute the sediment transport rates between the macrocells (blue arrows). The sediment transport directions within the macrocells cannot be directly determined from the sediment budget and require expert-judgement-based interpretation of the bathymetric changes (Fig. 6). In the eastern part of the estuary, the main channel forms a separation between the major shoal areas, it therefore seems valid to assume that sediment exchange between the macrocells only occurs through the main channel. In the western part, the main channel forms a major sediment pathway. In addition, sediment transport from the secondary areas in Mc3 to the secondary areas in Mc4 is probable, as these areas are connected directly through a series of shallow channels and sills (Fig. 6). Under these assumptions, estimates of the intra-estuary transports can be determined from the sediment budget.
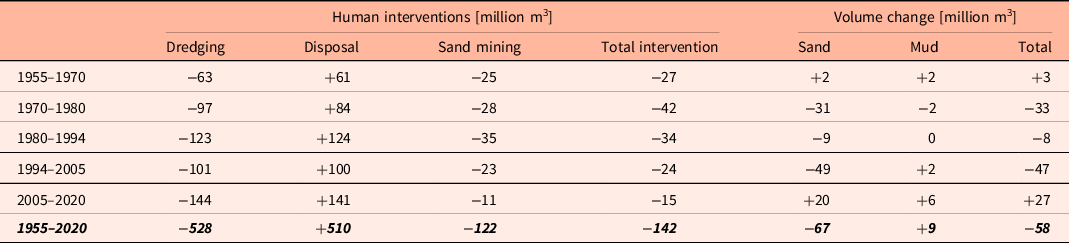
Dredging, disposal and sand mining. Sediment volumes for dredging (V dredging ), disposal (V disposal ) and sand mining (V sandmining ) are based on Cleveringa (Reference Cleveringa2013) and thereby similar to Haecon (2006) until 2001 (Fig. 4). However, these authors indicate that the accuracy and completeness of the data are unknown. Recent data are based on values reported in IMDC (2020, 2021) and Schrijvers (Reference Schrijver2021).
The combined dredge-disposal timeseries show that sand extraction prevails in the eastern part of the estuary; part of the sediment is disposed to the West, resulting in a sediment surplus there. Sand mining has resulted in 122 million m3 of sand volume loss since 1955.
Bed-level change
Large yearly variations in bed level occur between 1955 and 2020 (see Fig. 6 for a representative depiction of these changes). The gross yearly sedimentation and erosion volumes vary between 40 and 100 million m3 resulting in over 7000 million m3 of volumetric change (Fig. 10B). The total net change of –58 million m3, an average net erosion rate of 0.9 million m3/year, is small compared to the gross changes (Fig. 10A and Table 3). The observed net erosion of 58 million m3 is smaller than the sand extraction of 142 million m3 that occurred. Sand mining (122 million m3) is the dominant factor for the observed losses. The small difference between dredging and disposal volume accounts for 20 million m3. The extracted volumes are two times larger than the net sediment loss but only represent 2% of the observed total change. Based on the measured volumetric changes, the estuary loses sediment, but after accounting for dredging, disposal and sand mining, the estuary would have gained 84 million m3 of sediment (Fig. 10A, dashed line = estuary total corrected).

Figure 10. (A): Timeseries of changes in sediment volume between 1955 and 2020 for (A) the cumulative net volume change of the total estuary (grey shading indicates the time-periods of main channel deepening), (B) gross and net yearly volume changes, (C) net volume change for the various morphodynamic elements, and (D) net volume change for individual macrocells. Panels (E) and (F) respectively show the cumulative net volume changes for the western and eastern parts of the estuary.
Table 3. Measured volume change in million m3/year for the total estuary (negative values = sediment loss, positive values = sediment gain).
Erosion dominates the main channel (Fig. 10C) as the channel (water) volume increased by 270 million m3. Maintenance dredging of sills and structural channel deepening, 529 million m3 in total, plays an important role in the increasing channel volume. Part of the dredged material was disposed in the secondary channels, contributing to their 187 million m3 net accretion. The shoal areas, the central shoals between the main and secondary channel and the shoals along the embankments of the estuary (shoals south and north), show a small 9 million m3 sediment gain.
An estimate of the sand versus mud contribution to the sediment budget was obtained using the average sand and mud contents derived from the McLaren (Reference McLaren1994) dataset (Table 1). The measurements by McLaren (Reference McLaren1994) show that a significant mud fraction can be present in parts of the estuary (see Fig. 3 and Table 1); however, the sand fraction dominates the total volumetric change of the estuary (Fig. 10A). The cumulative mud volumes show minor variations between 1955 and 2005 and a clear trend of accumulation since 2005.
The western part of the Western Scheldt estuary (Macrocells 1–4)
The total 19 million m3 net sediment volume gain of the western part of the estuary is small, considering the net 65 million m3 of disposal in this part of the estuary (Fig. 10E). Corrected for dredging, disposal and sand mining, the total sediment erosion/export in the western part is approximately 46 million m3. This number results mainly from Mc3 as a net, continuous sediment export (0.82 million m3/year) from this macrocell occurs (Fig. 10D). Significant sediment accumulation occurs in Mc2 where a continuous increase in the volume of 0.72 million m3/year over the entire period can be observed (Fig. 10D). The volumetric change of Mc1 is small (−0.28 million m3/year) and results mainly from the increase in depth before 1970. Mc4 shows an increase in sediment volume until 1990 and alternating periods of erosion and sedimentation and a limited total net change since.
The eastern part of the Western Scheldt estuary (Macrocells 5–7)
The dominant effect of sediment management is especially apparent in the eastern part of the estuary. The net sediment volume loss of 77 million m3 (Fig. 10F) is smaller than the sum of sand extraction (−401 million m3) and disposal volumes (+209 million m3). Erosion is related to the increasing depth of the main channel (−131 million m3). The shoal areas and secondary channels show a small net gain of 54 million m3.
The volume timeseries shows continuous erosion since 1970, although the erosion rates vary over time (Fig. 10F). The most considerable erosion rates occurred between 1970 and 1980 (−3.4 million m3/year) and between 1994 and 2005 (−3.7 million m3/year). They are related to the channel deepening that took place during these time frames (Taal et al., Reference Taal, Wang and Cleveringa2013). The volume loss is limited between 1980 and 1994 and from 2005 until 2020. The volume timeseries corrected for human interventions shows no net transport in or out of the eastern part of the estuary until 1980. Since 1980, however, the corrected time series reveals a net gain in the eastern part of the estuary of 3.0 million m3/year. The gain increases to nearly 4.0 million m3/year if sediment exports to the Sea Scheldt and the Verdronken Land van Saefthinge are included.
Sediment exchange between the estuary and the North Sea
An estimate of the sediment exchange between the Western Scheldt estuary and the North-Sea is obtained by resolving the sediment budget over the 1955–2020 period (Fig. 11). The sediment budget reveals an average net import of 1.6–2.6 million m3/year. In the best-estimate scenario (Table 2, Scenario 3), a net import of 2.2 million m3/year is computed. However, the import rate varies over the period when the intervals of Table 3 are applied. The largest import rates occurred between 1980–1994 and 2005–2020, respectively, 2.9 and 3.7 million m3/year. A net export of 1.3 million m3/year is computed between 1994 and 2005. Distinguishing between sand and mud in the computation shows that the sand and sediment show near identical sediment import curves (Fig. 11A). This similarity is due to the relatively minor contribution of mud in the volumetric changes. Mud has a significant presence in certain parts of the estuary, especially along the banks, but the volumetric changes in these areas are limited. As a result, the computed mud import is small (0.3 million m3/year).

Figure 11. (A): Timeseries for cumulative sediment transports through the transect Vlissingen-Breskens based on four exchange scenarios with the Sea Scheldt. Red shading indicates the variation in import rates based on the four scenarios. Representation of the single-box sediment budget (1955–2020) for (B) Scenario 1, (C) Scenario 2, (D) Scenario 3 in (1) the single-box model, (2) distinguishing between the main channel and secondary channels and shoals, (3) and subdivided in the western and eastern part of the estuary. (E) single-box sediment budget for Scenario 4, subdivided into sand and mud.
Subdividing the sediment budget into (i) main channel and (ii) secondary channels and shoals (Fig. 11, D2, and D3) reveals the large difference in response between these two elements. The main channel has deepened at −4.2 million m3/year, with near-equal contributions of the channel in the western and eastern parts of the estuary. However, note that the net volume dredged in the main channel of the eastern part is 4 million m3/year, which implies a significant sediment supply from west to east to compensate for this loss. An average 0.97 million m3/year loss of sediment to Saefthinge and the Sea Scheldt adds up to an average transport of sediment from west to east of 3.0 million m3/year. The volume gain in the secondary channels (of Mc2 and 4 in particular) and shoals is 3.3 million m3/year, most of it (2.5 million m3/year) in the western part of the estuary.
Understanding intra-estuary sediment exchanges
Further understanding of the intra-estuary sediment exchange is obtained by filling in the detailed sediment budget (Figs. 12 and 13).

Figure 12. Summary of the average annual sediment volume changes per macrocell, based on bed-level changes and dredging, disposal and sand-mining volumes, using the detailed sediment box model for the time periods (A) 1955–2020, (B) 1955–1970, (C) 1970–1980, (D) 1980–1994, (E) 1994–2005 and (F) 2005–2020. Macrocell subdivision: (a) main channel, (b) main shoal + secondary channel + side shoals north & south. Export rates to Verdronken Land van Saefthinge and Sea Scheldt are based on Scenario 4.

Figure 13. Detailed, macrocell-based, sediment budget for the Western-Scheldt estuary. Blue arrows indicate the computed transports between macrocells over the time periods (A) 1955–2020, (B) 1955–1970, (C) 1970–1980, (D) 1980–1994, (E) 1994–2005 and (F) 20052020.
Deepening of the navigation channel (1973–1976, 1997–1998 and 2010) by dredging the shallowest sills, in combination with maintenance dredging, resulted in a deepening of the entire main channel (Mc1a–Mc7a). Bed lowering rates of the individual macrocells vary between −0.4 and −1.3 million m3/year. In the eastern part of the estuary, all main channel macrocells (Mc5a, 6a and 7a) show bed lowering but still act as significant sediment sinks. The rates of channel maintenance dredging exceed the observed lowering of the bed level significantly. Therefore, averaged over the entire period 1955–2020, a net eastward transport and sediment import at the mouth prevails. Using scenario 4 as an assumption for exchange with the Sea Scheldt and the Verdronken Land van Saefthinge yields an average sediment import rate of 2.2 million m3/year. With a value of 3 million m3/year, transports between the western and eastern parts of the estuary are 35% larger (Fig. 13A) than the sediment import rates.
The most considerable volume losses (caused by bed lowering) occur in the central parts of the main channel (Mc4a and Mc5a). Despite this bed lowering, the sediment budget reveals that only Mc4a is a primary sediment source. This macrocell likely forms a crucial link connecting the eastern and western parts of the estuary as almost 2/3 of the sediment needed to compensate for the sediment demand of the main channels in the eastern part of the estuary is delivered by Mc4a (Fig. 13A). Macrocell 4a forms a continuous sediment source, but its magnitude significantly increased around 1985. This increase is related to significant bed lowering associated with the bend cut-off initiated in 1951 and increasing annual disposal.
Most of the secondary parts of the macrocells (Mc1b, Mc2, Mc4b, Mc5b, Mc6b and Mc7b) show an increase in bed level between 1955 and 2020 (Fig. 12A). Only in Mc3b, a relatively small bed lowering at a rate of −0.3 million m3/year can be observed. This bed lowering is remarkable given the 1.2 million m3/year of net disposal that took place here. The extensive sediment dispersion capacity of Mc3b is reflected by its 1.3 million m3/year source capacity (Fig. 13A). Maximum source values exceeding 2.7 million m3/year occurred between 1994 and 2005 when disposal peaked. Decreased disposal after 2005 reduced the source magnitude to 1.5 million m3/year. Mc4b shows an opposite behaviour compared to Mc3b. In this macrocell, the net disposal is limited (0.36 million m3/year), but a significant increase in the bed level occurred (+2 million m3/year). As a result, this macrocell forms the most significant sediment sink in the estuary. The infilling of the Middelgat channel governs the increasing bed level (Fig. 6A). The most significant increase in bed level occurred between 1994 and 2005 (Fig. 12E), which coincides with the peak in disposal in Mc3b. Additionally, it is likely that Mc3b supplied sediment to Mc4b.
A breakdown of the sediment budget in the periods, 1955–1970, 1970–1980, 1980–1994, 1994–2005, 2005–2020, reveals distinct sediment transport patterns, changes and rates (Fig. 13B-F). The most noticeable changes are the temporary switch from sediment import to sediment export at the mouth of the estuary between 1994 and 2005 and the increased sediment exchange between the eastern and western parts of the estuary since 1980.
Between 1955 and 1970, the sediment transport from the western part to the eastern part of the estuary approximated 1.3 million m3/year. This transport is significantly smaller than the 3.4–5.1 million m3/year exchange observed since 1980. Before 1970, most of the maintenance dredging and disposal took place in the eastern part of the estuary. The secondary parts (Mc5b, Mc6b and Mc7b) acted as sediment sources, with source values near equal to the disposal values. As a result, these parts provided the majority of the sediment demand (∼50%) of the main channel, resulting in limited transport between the western and eastern part of the estuary.
Since 1970, the secondary elements Mc5b, Mc6b and Mc7b all show small source and sink values, indicating that little sediment exchange occurred between these elements and the main channel. Disposal of sediment in the secondary areas now leads to long-term storage of sediment but also to a sediment deficit in the remainder of the system and increased sediment import. Since exchange between the secondary areas and the main channels did occur before 1970, this behaviour change is likely caused by dredging and disposal associated with the deepening and maintenance of the navigation channel. This limited sediment exchange between the secondary area and the main channel has remained since. With increased dredging rates in the main channel, sediment transport from the western to the eastern part of the estuary has increased considerably since 1980.
It is probable that the temporary reversal of the net transport direction from import to export at the mouth of the estuary between 1994 and 2005 is linked to the sediment dispersal strategy. Between 1997 and 2010, most of the dredged material was deposited in the western part of the estuary. In Mc3b and Mc4a alone, a combined 6.5 million m3/year source value arises that significantly exceeds the sediment sink value in the eastern part of the estuary. As a result, a surplus of sediment exists in the estuary’s western part, which can only be balanced through sediment export at the mouth. Such temporary reversal in sediment transport direction does not occur between the estuary’s western and eastern parts. Since 1980 transport has increased significantly to 3 to 4 million m3/year and has been exceeding 5 million m3/year since 2005 (Fig. 13D, E, F). Based on the observed transports, one can conclude that the western part of the estuary can act as a sediment source for the eastern part if sufficient sediment is available. The main channel of Mc4 plays a key role as a sediment source area. Since 1980 this macrocell has acted as a 2.2–3.8 million m3/year sediment source due to approximately equal source contributions of channel deepening and disposal.
The largest sediment import rates are observed between 2005 and 2020. These high rates are surprising as sand mining considerably decreased during this period and was stopped after 2014. The sediment budget reveals that an over 2 million m3/year decrease in the erosion rate of Mc4a plays an essential role in the augmented sediment import rates as less sediment is available to fulfill the sediment demand of the sink areas. In addition, the change in dredge-disposal strategy is also expected to contribute to the augmented sediment import rates. Implementing the Flexible Disposal strategy in 2010 resulted in large-scale disposal in Mc5b. The over 1 million m3/year disposal resulted in similar sedimentation, effectively reducing sediment availability by a similar amount. This sediment storage capacity of Mc5b could also be observed in the 1970–1980 period. During this period, extensive channel deepening occurred, which temporarily disrupted the sediment transports as import rates reduced to 1.9 million m3/year. Over 2 million m3/year of disposal and bed-level increase occurred in Mc5b.
In all periods considered, Mc4a is the largest sediment source in the main channel. This is due the significant increase in depth and due to the disposal in the channel. Disposal continuously increased from an average 0.2 million m3/year between 1955 and 1970, to 2.9 million m3/year recently (2005–2020). The neighbouring macrocell Mc3a shows the opposite behaviour and acts as a small sediment sink between 1980 and 1994 (−0.05 million m3/year) as the main channel deepened at the same rate. Since 1994 channel dredging has doubled, but channel deepening was limited. As a result, the sink value increased; presently, this macrocell forms the second largest sink in the system (−1.9 million m3/year).
Mc1a, near the mouth of the estuary, shows alternating periods of increasing and decreasing bed levels and sink or source function. These changes are likely due to natural variability as net sand removal through mining or dredging was limited (0.1–0.2 million m3/year). Disposal does not occur in Mc2. Therefore, the bed-level increase in the latter macrocell is related to natural sediment transports. The 0.72 million m3/year deposition rate may be considered the upper limit of coastal sediment supply from the adjacent Zeeuws-Vlaanderen coastline.
Discussion and synthesis
Uncertainty in the sediment budget
Sediment composition: sand versus mud
The presented sediment budget does not resolve the complete sand and mud budget. A crude estimate of the contributions of the two fractions was based on a single bed-composition map for which the sand-mud ratio for the various morphodynamic elements was determined. These ratios were kept constant over all measurements. Based on this approximation, we can conclude that the sediment import is dominated by the sand fraction (1.9 million m3/year) with only a minor contribution of the mud fraction (0.3 million m3/year), as the sand and sediment budgets follow similar trends and are approximate of similar magnitude. Therefore, the sediment budget also provides a reasonable estimate of the sand budget. However, the mud budget results are incomplete and require careful consideration of, e.g., the harbour basins, sediment porosity and bed composition (Van Kessel et al., Reference Van Kessel, Vroom and Taal2023), and should not be used for further analysis.
The porosity of the sediment
Changes in the porosity of the sediment may result in changes in the observed sediment volume without any sediment transport. Variations in the porosity can result from physical and biological processes such as bubble sand formation (De Boer, Reference De Boer1979), compaction and bioturbation. Compaction is expected to be of importance for the marshes. These processes can result in significant variations on small time scales but are less likely to influence the year-averaged results presented here significantly.
Subsidence
In theory, subsidence of the subsurface influences the sediment budget since compensation of subsidence by deposition involves an extra sediment volume that cannot be determined from observed bed level changes. Therefore, sediment deposition rates are possibly underestimated in subsidence areas, especially over longer time scales. Major parts of the Netherlands subside, including the Western Scheldt. The exact amount of subsidence of the subsurface is challenging to establish. Measurements on the reference datum stations in the Netherlands suggest subsidence amounts to 20 mm/ century (following numbers in Brand et al., Reference Brand, van Brussel, ten Damme and Gerritsen2004; De Bruijne et al., Reference De Bruijne, van Buren, Kösters and van der Marel2005) in the Western Scheldt region. The contribution of subsidence of the subsurface in terms of volume is limited to circa 60.000 m3/year for the Western Scheldt and Saeftinghe. Local compaction of Holocene peat and mud deposits may add to the apparent sediment loss through subsidence, but this is not easy to estimate. The contribution of subsidence is unidirectional and becomes essential when considering sediment budgets over more extended periods (>50 years). Based on data analysis from 1987 to 2017, Hijma and Kooi (Reference Hijma and Kooi2018) conclude that subsidence in the Western-Scheldt estuary results in an estimated loss of 0.059 million m3/year (±0.03 million m3/year). In the Dutch part of the mouth of the estuary, subsidence introduces a loss of 0.101 million m3/year (±0.053 million m3/year). Subsidence values for the Belgian part of the mouth are unknown, but we assume these losses are smaller than the value observed in the Netherlands. These small values do not significantly impact the sediment budget presented in this study and are therefore not included in the analysis.
Sediment budget of the Western Scheldt estuary
Analyses of bathymetric data revealed that the Western Scheldt estuary lost 58 million m3 of sediment between 1955 and 2020, which is −0.9 million m3 per year. The gross annual volume change is two orders of magnitude greater: 105 million m3 per year. Dredging, disposal of the dredged material and sand mining caused a significant part of this volume change. After accounting for these activities, the estuary gained 84 million m3 of sediment (+1.3 million m3 per year).
The volumetric changes of the various morphodynamic units in the estuary illustrate that erosion dominates the main channel: −4.2 million m3 per year, with near-equal contributions of the western and eastern parts of the estuary. This increase in channel volume is caused mainly by the maintenance dredging of sills and structural deepening of the navigation channel. The secondary channels and shoals accreted at a rate of 3.3 million m3 per year, three-quarters of which accumulated in the western part of the estuary.
When comparing the net volume changes in the eastern and western parts of the estuary, opposing trends were found: the western part gained 19 million m3 in sediment volume, whereas the eastern part lost 77 million m3. The net sediment volume gain of the western part of the estuary is small, considering the net 65 million m3 of disposal in the system. Taking into account losses from dredging, disposal and sand mining, we calculate a total sediment loss in the western part of 46 million m3. The deepening of the main channel causes sediment volume changes in the eastern part of the estuary. The most considerable erosion rates occurred from 1970 to 1980 and 1994 to 2005, during and after periods of channel deepening. The volume development corrected for human interventions shows no net transport in or out of the eastern part of the estuary until 1980 and a net gain of 3.0 million m3 per year since. The annually dredged net volume in the eastern part of the estuary of 4 million m3 implies an intensive sediment exchange from west to east.
Sediment exchange between estuary and mouth area
Sediment import at the mouth of the estuary is expected to be higher than the observed volume change corrected for interventions in the estuary, since sediment losses to the Sea Scheldt and Land van Saefthinge need to be accounted for. These losses are estimated based on values presented in literature. The total sediment exchange rates at the mouth of the estuary were derived from resolving the estuary-wide sediment budget for various estimates (scenarios) and summarised in Fig. 11. Sediment import rates are calculated to range between 1.6 and 2.6 million m3/year between 1955 and 2020. Our best estimate scenario, using the results of detailed sediment budgets of the Sea Scheldt and accounting for the contribution of mud and sand, equals 2.2 million m3/year. The import rates are dominated by the sand fraction as the volumetric changes in the mud-rich areas along the estuary’s banks are limited (0.3 million m3 per year) compared to the change in the sand-dominated channels and shoals (1.9 million m3/year).
Significant variations in sediment exchange rates occurred between 1955 and 2020. Lower import rates occur between 1970 and 1980 (1.85 million m3/year), higher rates are observed between 1955−1970 and 1980−1994 (2.9 million m3/year) and maximum rates occur between 2005 and 2020 (3.7 million m3/year). Temporarily, a net export of 1.3 million m3/year occurred between 1994 and 2005. The temporary reversal from import to export at the mouth of the estuary between 1994 and 2005 is likely linked to a changed disposal strategy. Between 1997 and 2010, most of the dredged material was deposited in the western part of the estuary. As a result, the available source volume in the central part of the estuary significantly exceeded the sediment demand in the eastern part. Consequently, the surplus of sediment in the western part of the estuary was balanced through sediment export at the mouth.
Sediment transport mechanisms; natural versus anthropogenic forcing
Both natural and anthropogenic sediment transport induce morphological changes in the Western Scheldt estuary. Natural sediment transport refers to sediment movement that can be related directly to the hydrodynamics with tidal asymmetry and tidal amplification being important indicators (Fig. 8). The observed development of the tidal amplification in the estuary can be explained by the morphological changes. The deepening of the channels increases the flow conveyance capacity, and the accretion at the shoals decreases the tidal storage, favouring increased tidal amplification. This can be observed, comparing Figs. 8 and 11, which illustrates:
-
the increasing trend of tidal amplification for the entire period (1970−2020) corresponds with the deepening (decreasing sediment volume) trend of the estuary. Most tidal amplification and deepening changes occur in the eastern part of the estuary.
-
the most notable changes, increasing tidal amplification and decreasing sediment volume, occurred in 1970−1982 and 1995−2009,
-
the recent decreasing trend of the tidal amplification since around 2010 corresponds to the sediment accretion in the same period,
The development of the sediment transport and that of the tidal asymmetry do not correspond sufficiently. The vertical tide at all stations shows persistent flood dominance since 1970 as the period of the rising tide is shorter than that of the falling tide (Fig. 8). The temporary reversal in net sediment transport at the mouth that is computed from the sediment budget is apparently not caused by a change in tidal asymmetry. In addition, a continuous increase of the import rate at the mouth would be expected over the period 1970−1995, as the tidal amplification and flood dominance in the estuary were increasing. It is unlikely that other types of tidal asymmetry, for example due to the difference between the durations of the HW and LW slacks, that were not considered in the water level analysis explain the mismatch between the development of sediment transport and tidal asymmetry. This latter asymmetry is relevant for fine sediment, but has limited influence on the sand fraction that dominates the volumetric changes since 1970.
Anthropogenic transport is the most probable explanation for the observed variations in sediment import and export rates. Pieters et al. (Reference Pieters, Storm, Walhout and Ysebaert1991) indicate that before dredging, from 1920 to 1930, the equilibrium depth of the sills in the navigation channel was around 8 to 10 m. As, due to the channel deepenings, the present-day channel depth of NAP -16 m is far past its equilibrium depth, it becomes an effective sediment trap as the channel tries to retain an equilibrium between its cross-sectional area relative to the tidal prism (O’Brien, Reference O’Brien1931, Reference O’Brien1969). As a result, not only maintenance dredging increased from less than 0.5 million m3/year before 1950 to 7−10 million m3/year at present, but as most of the dredged material is disposed back in the estuary, the disposal increased at a similar rate. It is probable that this disposal and the disposal strategy plays an important role in the observed variations in sediment exchange rates at the mouth. Observations of sediment movement in the navigation channel after a flow slide (Van Schaick, Reference Van Schaick2015) and studies of the development of disposal on the Zuidgors flat (De Vet et al., Reference De Vet, van Prooijen, Colosimo, Ysebaert, Herman and Wang2020) indicated that disposed material is more easily transported than the autochthonous sediment.
So far, evaluation of the dredging and disposal strategies was focused on retaining the multichannel character of the estuary and its associated high ecological value (Van Dijk et al., Reference Van Dijk, Cox, Leuven, Cleveringa, Taal, Hiatt, Sonke, Verbeek, Speckmann and Kleinhans2021). The macrocell-based sediment budget (Fig. 13) provides further evidence of the importance of the disposal strategy on the sediment exchange at the mouth of the estuary. Before 1970, most of the maintenance dredging and disposal occurred in the estuary’s eastern part. At that time, the secondary channels and shoals acted as sediment sources, satisfying about 50% of the sediment demand of the main channel. Consequently, the sediment transport between the western and eastern parts of the estuary was limited. Since 1970 the secondary channels and shoals supplied limited volumes to the main channel, despite the disposal of dredged sediments, causing a sand deficit in the remainder of the system and increased sediment import. The channel deepening possibly caused this behaviour change and has remained since. With increased dredging rates in the main channel, sediment transport from the western to the eastern part of the estuary has increased considerably since 1980. This observation suggests that the western part of the estuary acts as a sediment source for the eastern part if sufficient sediment is available.
Excessive disposal in the western part of the estuary can lead to a reversal of the sediment transport direction at the mouth from import to export, as observed between 1994 and 2005. However, this does not imply that the Western Scheldt estuary exports sediment and temporarily supplies sediment to the coastal zone. The development of the western part of the estuary (Mc1−4) and the mouth area are more connected than previously assumed. Depending on sediment availability in the western part of the estuary (sink or source), the mouth area facing the estuary delivers or stores sediments temporarily. Therefore, the mouth area should form an integral part of the analysis.
Concluding remarks
A globally unique dataset of long-term bathymetric maps (1955−2020) of high resolution (in time and space) digital data, hydrodynamic observations and well-kept records of dredging, disposal and sand mining allowed for detailed investigations of the morphodynamics, sediment budget and forcing processes of the Western Scheldt estuary.
Understanding the morphodynamic functioning of the Western Scheldt estuary and its response to changes in hydrodynamics (natural sediment transport) and anthropogenic influence (e.g., channel deepening, sand mining and channel maintenance dredging and sediment relocation strategies) is essential for a sustainable management of this estuary.
The sediment budget reveals an average net sediment import of 2.2 million m3/year between 1955 and 2020 to balance sediment losses to the Sea Scheldt and Saefthinge (−0.97 million m3/year), net sand extraction (−2.14 million m3/year), main channel deepening (−4.21 million m3/year) and secondary channel and shoal accretion (+3.30 million m3/year). However, the sediment import rates varied over this interval and from 1994 to 2005 the sediment import reversed to export.
Natural variations in the hydrodynamics (e.g., tidal asymmetry and amplification) and sediment transports cannot explain the derived temporal variations in sediment import rates. Instead, anthropogenic sediment transport plays a dominant role. Deepening of the main channel led to an increase in maintenance dredging and disposal from less than 0.5 million m3/year before 1950 to 7–10 million m3/year at present. Since the first channel deepening, the tidal flats and secondary channels in the eastern part of the estuary do no longer actively exchange sediment with the main channel. As a result, sediment disposal in these areas leads to long-term storage of sand and, consequently, an increase in bed level and a sand deficit in the remainder of the system that induces increased sediment imports. Large-scale dredge disposal in the western part of the estuary can (temporarily) reverse the sediment exchange between the estuary and its mouth area, as observed between 1994 and 2005.
Safe navigation, shoreline management and the ecological targets of the Western Scheldt estuary require balanced sediment management at the scale of the macrocells and with a timescale of decades. The realisation that the disposal strategy directly impacts the sediment import and export rates provides opportunities for the future management of the estuary. Adverse effects of sea-level rise, such as drowning of tidal flats, may be mitigated by selecting a disposal strategy that promotes sediment import. However, such strategy may come at a cost, as the mouth area is the most probablel source to deliver these sediments.
Supplementary material
The supplementary material for this article can be found at https://doi.org/10.1017/njg.2023.11.
Acknowledgements
The paper summarises the results of research conducted as part of the projects: ‘KPP Beheer en Onderhoud Kust’ and ‘KPP Schelde-estuarium’. The latter is part of ‘Research and Monitoring for the Flemish Dutch Scheldt Committee (VNSC)’. Both projects aim to improve our understanding of the evolution of the large-scale morphological behaviour of the Scheldt Estuary and the Dutch coastal system. Marco Schrijver, Gert-Jan Liek and Marian Lazar (all at Rijkswaterstaat Sea and Delta) are thanked for pleasant collaboration, advice, review and assistance in obtaining the datasets presented here.
The comments of the reviewers greatly improved the manuscript and are much appreciated.
Open access to the Vaklodingen is provided by Deltares at: https://svn.oss.deltares.nl/repos/openearthrawdata/trunk/rijkswaterstaat/vaklodingen/


 Open access