

No CrossRef data available.
Article contents
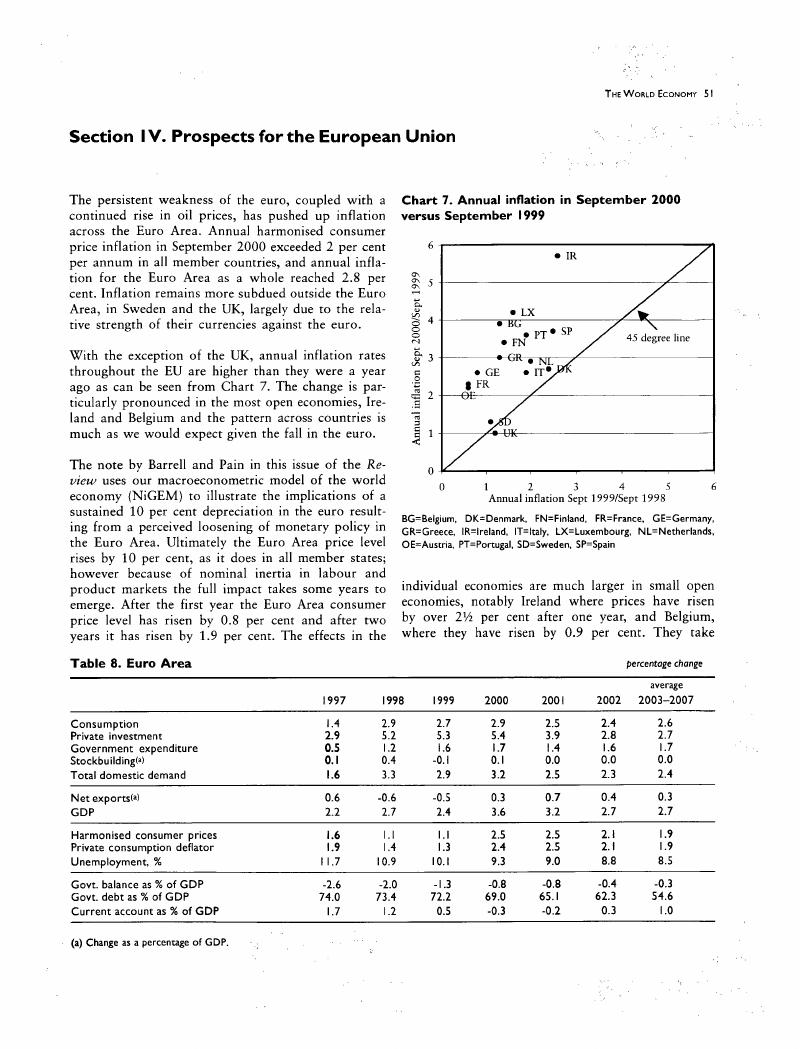
Section IV. Prospects for the European Union
Published online by Cambridge University Press: 26 March 2020
Abstract
An abstract is not available for this content so a preview has been provided. Please use the Get access link above for information on how to access this content.
- Type
- Other
- Information
- Copyright
- Copyright © 2000 National Institute of Economic and Social Research
References
Notes
1 The OECD figures include some fast-growing economies such as Mexico and Korea which account for around 5 per cent of global GDP on a PPP basis. The IMF does not include these in its advanced economies grouping used in the World Economic Outlook.
2 The appropriate accounting treatment of these transactions was discussed in the note by Martin Weale on page 40 of the July Review.
3 Figures shown are an average of spot prices of Brent crude and Dubai light crude. Prices are deflated with export prices of manufactured goods. The base year is 1999.
4 The ratio is constructed using country GDP figures converted into dollars using the PPP rates (World Development Indica tors 2000). Differences across countries reflect structural change, changes in energy efficiency and different fuel mixes. 5 The nature of these rules is discussed in Barrell and Pain (2000) and in Barrell and Dury (2000) in this issue of the Review. The parameterisation is relatively standard, and in order to en sure comparability across countries we have the same feed back coefficients in the US and in Europe.
6 The policy rule uses the consumer price deflator. The GDP deflator is not used as this can give perverse effects. A rise in the price of oil can increase the value of imports which given the definition of the GDP deflator will result in a fall in prices.
7 The model is essentially linear for these purposes, so the level of the baseline is not central to our analysis.
8 An increase represents a depreciation.
9 In this simulation a single wage equation is estimated for the European economies using panel estimation techniques. The result is a reduction in the speed of response in adjusting to the disequilibrium. The estimation and properties of both models are detailed in Barrell and Dury (2000).
10 See Digital Economy 2000, U.S Department of Commerce, Eco nomics and Statistics Administration.
11 See Digital Economy 2000, U.S Department of Commerce, Eco nomics and Statistics Administration, Chapter 4.
12 See http://www.bog.frb.fed.us/pubs/feds/2000/200038/200038abs.html. The results in this paper also indicate that if there was a permanent rise of 10 per cent in the relative minimum wage it would raise the equilbrium unemployment rate by 0.5 percentage points.
13 See The Japanese Government Balance Sheet (Preliminary Trial) available at http://www.mof.go.jp/english/budget/bs/zai002e.pdf
14 If the trend rate of nominal growth in Japan is now 4 per cent (2-2½ per cent real output growth, 1½-2 per cent inflation) then the budget deficit will have to fall to 4½ per cent of GDP to stabilise the debt-GDP ratio at 118 per cent. It would have to fall to 2.3 per cent to bring the debt ratio down to 60 per cent.
15 Forthcoming revisions to the Japanese national accounts may raise the level and rate of growth of business investment, with the move to SNA(93) based accounts leading to the incorpo ration of separately purchased computer software in fixed capital formation rather than intermediate consumption.
16 The national accounts data we use in the forecast are from the Deutsche Bundesbank and have been adjusted for sea sonal and calendar effects with CENSUS X-12-ARIMA.