

The forecasts for the world economy and the UK economy reported in this Review are produced using the National Institute's global econometric model, NiGEM. NiGEM has been in use at NIESR for forecasting and policy analysis since 1987, and is also used by a group of more than 40 model subscribers, mainly in the policy community. Further details, including articles by model users, are provided in the May 2018 edition of the Review. Most countries in the OECD are modelled separately,Footnote 1 and there are also separate models for Argentina, Brazil, Bulgaria, China, Hong Kong, India, Indonesia, Romania, Russia, Singapore, South Africa, Taiwan and Vietnam. The rest of the world is modelled through regional blocks so that the model is global in scope. All models contain the determinants of domestic demand, export and import volumes, prices, current accounts and net assets. Output is determined in the long run by factor inputs and technical progress interacting through production functions, but is also affected by demand in the short to medium term. Economies are linked through trade, competitiveness and financial markets and are fully simultaneous. Further details on NiGEM are available at http://nimodel.niesr.ac.uk/.
The key interest rate and exchange rate assumptions underlying our current forecast are shown in tables A1–A2. Our short-term interest rate assumptions are generally based on current financial market expectations, as implied by the rates of return on treasury bills and government bonds of different maturities. Long-term interest rate assumptions are consistent with forward estimates from short-term interest rates, allowing for a country-specific term premium. Where term premia do exist, we assume they gradually diminish over time, such that long-term interest rates in the long run are effectively the forward convolution of short-term interest rates.
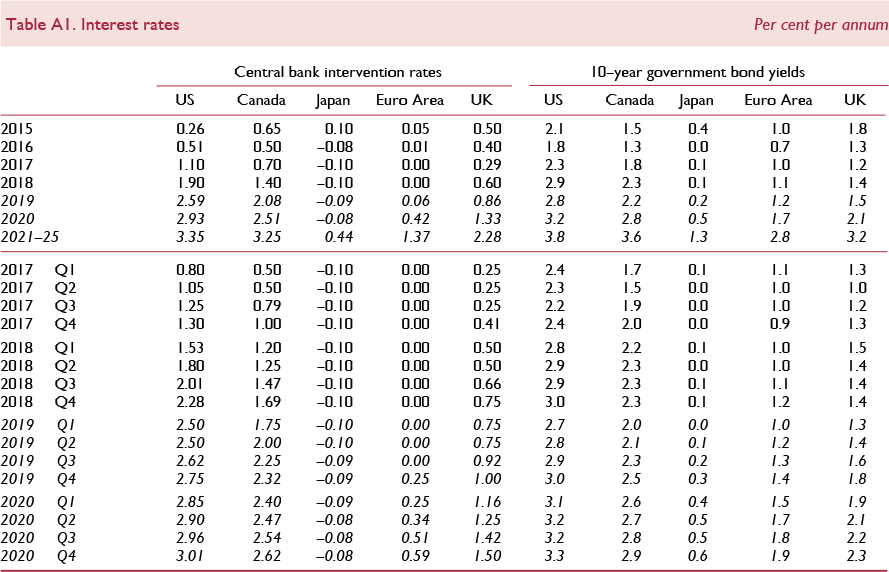

Short-term interest rates are expected to rise slightly in the second half of 2019 in the US, the UK and the Euro Area, but remain unchanged in Japan. Interest rates in the US are broadly consistent with the path signalled by the most recent Federal Open Market Committee (FOMC) minutes. As discussed in the UK chapter in this Review, we expect UK economic growth to stabilise at a rate that is close to its potential. Our central forecast assumes a soft Brexit scenario and is conditioned on Bank Rate rising 25 basis points in August 2019. Bank Rate is expected to reach 1.5 per cent in 2020, this being the point at which the MPC is assumed to stop reinvesting the proceeds from maturing gilts it currently holds, allowing the Bank of England's balance sheet to shrink ‘naturally’.Footnote 2
Figure A1 illustrates the recent movement in, and our projections for, 10-year government bond yields in the US, Euro Area, the UK and Japan. The average levels of 10-year sovereign bond yields in the US, the UK and Euro Area increased marginally (by about 10 basis points) in the fourth quarter of 2018 relative to the previous quarter, but were largely unchanged in Japan. Expectations currently for bond yields for the end of 2019 are lower, by about 30–50 basis points, for all four economies compared to expectations formed three months ago. The forecast implies gradual increases for 10-year bond yields. However, given the risks around the forecast, more volatile paths could emerge.

Figure A1. 10-year government bond yields
Sovereign risks in the Euro Area were a major macroeconomic issue for the global economy and financial markets over several years after the financial crisis. Figure A2 depicts the spread between 10-year government bond yields of Spain, Italy, Portugal and Ireland over Germany's. Political and budgetary issues led to Italy experiencing the largest increase in spreads in 2018 since 2013. Spreads in Italy remain elevated, leaving it as the worst performer, after Greece. We have assumed that spreads over German bond yields narrow in all Euro Area countries over the course of the forecast horizon.

Figure A2. Spreads over 10-year German government bond yields
Figure A3 shows the spreads of corporate bond yields over government bond yields in the US, UK and Euro Area. This acts as a proxy for the margin between private sector and ‘risk-free’ borrowing costs. Since the beginning of February 2018 corporate bond spreads in the US, UK and Euro Area have been on an upward trend, with private sector borrowing costs rising more than the observed increase in risk-free rates. However, the latest data indicate some divergence in spreads, which have remained largely unchanged in the UK and the Euro Area, and declined in the US, where corporate bond yields have edged down relative to government bond yields. Our forecast assumption for corporate spreads is that they gradually converge towards their long-term average level.

Figure A3. Corporate bond spreads. Spread between BAA corporate and 10–year government bond yields
Nominal exchange rates against the US dollar are generally assumed to remain constant at the rate prevailing on 16 January 2019 until the end of September. After that, they follow a backward-looking uncovered-interest parity condition, based on interest rate differentials relative to the US. Figure A4 plots the recent history as well as our short-term forecast of the effective exchange rate indices for Canada, the Euro Area, Japan, UK, and the US. After appreciating by about 7 per cent, in trade-weighted terms, over the course of last year, the US dollar has depreciated, by about 1 per cent, since the start of 2019. After having strengthened over the past two years, the euro has marginally lost value in effective terms since the end of last year. Among the emerging market currencies in our model, the largest movement in trade-weighted terms between the third and fourth quarters of 2018 was the depreciation of the Argentinian peso by about 13 per cent, followed by the Russian rouble and Mexican peso, which lost about 3–4 per cent of their value.

Figure A4. Effective exchange rates
Our oil price assumptions for the short term generally follow those of the US Energy Information Administration (EIA), published in January 2019, and updated with daily spot price data available up to 16 January 2019. The EIA uses information from forward markets as well as an evaluation of supply conditions. As illustrated in figure A5, oil prices, in US dollar terms, have fallen since October 2018, by about 30 per cent, reaching levels last seen at the end of 2017. Expectations for oil prices by the end of 2019 are lower than the expectation three months ago, which leaves oil prices about $40 per barrel lower than their nominal level in mid-2014.

Figure A5. Oil prices
Our equity price assumptions for the US reflect the expected return on capital. Other equity markets are assumed to move in line with the US market, but are adjusted for different exchange rate movements and shifts in country-specific equity risk premia. Since the third quarter of last year equity prices have generally fallen in major European as well as non-European economies. Figure A6 illustrates the key short-term equity price assumptions underlying our current forecast.

Figure A6. Share prices


