

No CrossRef data available.
Article contents
The Economic Situation: Chapter I. The Home Economy
Published online by Cambridge University Press: 26 March 2020
Extract
A fuller discussion of some of the individual items of expenditure is provided in the section on ‘Details of demand’ which follows.
In the first half of the year, there was no significant recovery in national output (table 1). The quarter-to-quarter movements are uncertain : but by the second quarter, on the evidence of the industrial production and unemployment figures, gross domestic product was probably less than ½ per cent higher than in the fourth quarter of 1966.
- Type
- Research Article
- Information
- Copyright
- Copyright © 1967 National Institute of Economic and Social Research
References
note (1) page 4 See National Institute Economic Review No. 40, May 1967, page 4.
note (2) page 4 I would now put the growth of output in 1967 somewhat lower than I did at the time of the Budget. On the other hand … I see no reason to alter the expectation that the level of output from now on should grow at about 3 per cent a year’. Mr. Callaghan, Weekly Hansard, 24 July 1967, col. 92.
note (1) page 6 The increases in contributions do not cancel out the reflationary effect. More than half of them are paid by employers, and the increase probably does not work through into prices straight away; when it does come through, half the effect is on the prices of goods other than consumer goods.
note (1) page 8 This is on a definition of ‘basic’ balance which includes a ‘normal’ positive balancing item of £50 million a year.
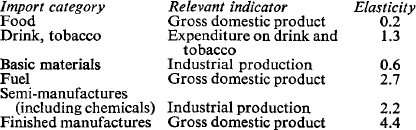
note (2) page 8 The elasticities (that is, the percentage rise in the volume of imports generated by a 1 per cent increase of the relevant indicator) were based on the experience of 1958-65, and were as follows:
note (1) page 10 This is a forecast of total unemployment, including school-leavers and temporarily stopped, before seasonal adjustment.
note (1) page 11 The method used is discussed in ‘Short-term fore casting of housing investment : a note’, on page 41 of this Review.
note (1) page 13 Public sector expenditure includes a large number of transfer payments, but excludes the investment of the nationa lised industries; it does not therefore correspond with the sum of public investment, as defined here, and public author ities' current expenditure on goods and services.
note (2) page 13 Excluding those parts of the engineering settlement which only relate to lower-paid workers, the hourly wage-rate index—starting from 111.5 in 1967 I, would read 117.3 instead of 117.7 in 1967 IV, 118.2 instead of 120.1 in 1968 I, and 122.2 instead of 124.1 in 1968 IV.
note (3) page 13 Defined in table 7 as the index obtained by dividing the wage and salary bill by the number of employees.
note (4) page 13 We have not continued this first quarter hump in 1968, since by then the seasonal adjustments to this series are likely to have been revised.
note (5) page 13 National Institute Economic Review No. 40, May 1967, page 38.
note (1) page 15 This comparison assumes that all the stock building forecast for 1967—which was presumed to be particularly of previously surcharged goods—took place in the first half of the year.