


Introduction
A material’s chemical and physical properties are closely related to its structural and compositional variations at the atomic or nanometer scale. An imaging tool that can reveal this information would be very useful and essential for research across many scientific fields. Tomography is such an imaging technique that allows complex structural or chemical features to be visualized in three dimensions, or through time-resolved in situ measurements, in four dimensions. This three-dimensional (3D) information yields deep insights into the connection between the chemical composition and structure of a material and its functionality. Though the technique has a long history, the scientific challenges we are facing today have driven the development of many new capabilities such as time-resolved in situ studies, strain mapping, multimodal imaging, and nanoscale spatial resolution.
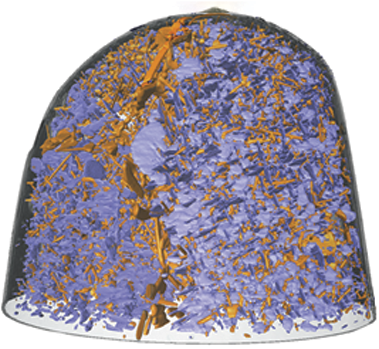
An example of the strength of the approach is provided by the drive to understand the (de)lithiation process in lithium-ion batteries. The microstructural evolution, phase-change, and chemical composition variations accompanying the complicated electrochemical reaction play critical roles in determining the reliability, capacity, and lifetime of the battery. As a result, a 3D imaging tool that can monitor the charge-discharge process at the nanoscale and in real time is essential. Lin et al., using electron tomography, visualized, in three-dimensions, how lithiation fronts propagate in a NiO nanoplate and how it deforms (Figure 1a).Reference Lin, Nordlund, Weng, Zhu, Ban, Richards and Xin1 Nanotomography has also been used to elucidate the temporal evolution and mechanical deformation processes in precipitation-strengthened Al-Cu alloys that are the basis of a large class of commercial Al alloys. Karia et al. were able to provide important insights into the deformation mechanisms in bulk samples that involve the nanoscale precipitates in these alloys (Figure 1b) using hard x-ray nanotomography.Reference Kaira, Stannard, De Andrade, De Carlo and Chawla2 There are many developments in recent years to meet these demands. We discuss a few of these emerging techniques in this article.

Figure 1. (a) Electron tomographic imaging of NiO nanoplates that are half lithiated (50% state of charge) (top) and fully lithiated (0% state of charge) (bottom) in a lithium battery (shown in gold). (b) Three-dimensional rendering of the nanostructure of an Al-Cu alloy aged at 350°C showing θ′ precipitates (blue) and θ precipitates (orange).Reference Lin, Nordlund, Weng, Zhu, Ban, Richards and Xin1,Reference Kaira, Stannard, De Andrade, De Carlo and Chawla2
Nanoscale x-ray and electron tomography
The word tomography is derived from the ancient Greek word “tomos,” which means slice and section. The 3D view in tomography is obtained from a reconstruction of a series of projected two-dimensional (2D) images acquired at different angles. In medical radiology, this is often referred to as computed tomography (CT) for clinical applications because significant computation is involved. A brief history of the technique can be found in the 2016 MRS Bulletin issueReference Evans and Friedrich3 dedicated to advanced tomography techniques for inorganic, organic, and biological materials. In this issue, we focus on nanoscale tomography, wherein microscopic techniques are required to achieve a high spatial resolution. Other than morphological imaging, x-ray tomography has evolved to be a versatile tool offering a suite of imaging modalities. Chemical composition, valence state, magnetic field, and strain can all be imaged with x-rays. Analogous to dark-field electron microscopy, synchrotron x-rays can be used to record dark-field diffraction images with 100-nm resolution. Thus, as in a transmission electron microscope (TEM), strain fields, dislocations, and other defects can be imaged. However, most importantly, unlike the TEM, the penetrating power of x-rays allows these images to be recorded in bulk materials and in 3D (see the article by Yildirim et al.Reference Yildirim, Cook, Detlefs, Simons and Poulsen4 in this issue). On the other hand, due to the electron’s high scattering cross section in solids, TEM is poised to investigate very small volumes resolving features down to the nano- and the single-atom scale.
X-rays are electromagnetic waves with short wavelengths. Unlike visible light, they are hard to focus because the refractive index for x-rays in most media is just slightly below one. The first attempts to create an x-ray microscope date back to the 1940s, but the effort leading to the modern apparatus started in the 1970s when the first transmission x-ray microscope (TXM) was built with a Fresnel zone plate ([FZP], a diffractive optic that is composed of many concentric rings with decreasing width, see Figure 2c). Following this, a scanning transmission x-ray microscope (STXM) was developed in 1980. A brief history of x-ray microscopy can be found in Reference 5. Since then, the field has grown steadily, with its applications expanded to a wide array of scientific disciplines, and this growth has accelerated even faster recently. This is partly due to advances in nanofabrication techniques that allow for the production of x-ray nanofocusing optics with the required precision, and partly a result of strong demand for x-ray microscopic tools that can probe material (either inorganic or organic) properties at small length scales. Many different types of nanofocusing optics are being developed,Reference Ice, Budai and Pang6,Reference Sakdinawat and Attwood7 and the spatial resolution of x-ray microscopy has steadily improved to approximately 10 nm.Reference Yan, Bouet, Zhou, Huang, Nazaretski, Xu, Cocco, Chiu, Brinkman and Chu8–Reference Chen, Chen, Wang, Kempson, Lee, Chu, Hwu and Margaritondo11 Most x-ray microscopy techniques have been developed with synchrotron sources. Industrial efforts in developing lab-source-based TXM has also led to commercial systems with 50-nm resolution.12

Figure 2. (a) A schematic drawing of the hard x-ray nanoprobe beamline at the National Synchrotron Light Source II (NSLS-II) of Brookhaven National Laboratory, showing how scanning x-ray microscopy works. A variety of focusing optics can be used to focus x-rays to a nanobeam. The graph shows a multilayer Laue lens, a special diffractive optic used to produce an x-ray nanoprobe. As the sample is raster-scanned by a nanoprobe, fluorescence, diffraction, and transmission signals can be collected simultaneously. (b) Three-dimensional x-ray tomography reconstruction of elemental distribution in a Ti–Mg–Al co-doped LiCoO2 battery particle. The multicolor image shows the subdomains.Reference Zhang, Li, Ouyang, Yu, Ge, Huang, Hu, Ma, Li, Xiao, Yang, Chu, Liu, Yu, Yang, Huang, Chen and Li14 Image courtesy of Y. Liu, SLAC National Accelerator Laboratory. (c) Experimental setup of a transmission x-ray microscope, where a Fresnel zone plate (ZP) is used to magnify the transmission x-ray image. Reprinted with permission from Reference 16. © 2018 AIP Publishing. (d) Three-dimensional evolution of Ag whisker growth on Cu in AgNO3 solution at one-minute intervals. Reprinted with permission from Reference 15. © 2019 AIP Publishing.
As illustrated in Figure 2, the two most common approaches used in x-ray microscopy are the scanning mode (SXM), where a nanoprobe is used to raster-scan the sample, and the full-field transmission mode (TXM), where a magnifying lens (usually an FZP) is employed to magnify the transmitted image. In the scanning mode, fluorescence- (for elemental distribution), diffraction- (for strain mapping in crystals) and transmission signals (for morphology) can all be collected simultaneously at each specific position (Figure 2a). This enables a multimodal imaging capability that provides comprehensive characterization of the sample in one experiment. The resolution of the image is mostly limited by the size of the probe. However, when certain conditions are met (coherency of the beam and overlap ratio between probed positions), sophisticated mathematical algorithms (such as ptychography) can be used to further improve the image and even probe the sample at length scales below the resolution limit set by the optics.Reference Thibault, Dierolf, Menzel, Bunk, David and Pfeiffer13 Tomography is then carried out by collecting 2D images, or projections, taken at different perspectives as the stage rotates. Figure 2bReference Zhang, Li, Ouyang, Yu, Ge, Huang, Hu, Ma, Li, Xiao, Yang, Chu, Liu, Yu, Yang, Huang, Chen and Li14 shows an example of fluorescence tomography where elemental distributions in a Ti–Mg–Al co-doped LiCoO2 battery particle are viewed in three dimensions. Though a powerful and versatile tool, SXM can be slow due to the required scanning. To achieve a high voxel resolution, in some cases, it can take more than one day to acquire enough projections for a tomographic reconstruction.
In contrast, the full-field transmission mode enables a snapshot of the sample without scanning (Figure 2c). Current state-of-the-art TXM beamlines at synchrotron facilities offer tomography with ∼30-nm resolution over the course of 1 min,Reference Ge, Coburn, Nazaretski, Xu, Gofron, Xu, Yin and Lee15,Reference Coburn, Nazaretski, Xu, Ge, Longo, Xu, Gofron, Yin, Chen, Hwu and Lee16 making it a more suitable tool for studying a dynamically evolving system where time resolution is needed. As shown in Figure 2d, 3D evolution of Ag whisker growth on Cu in AgNO3 solution can be viewed in near real time at one-minute intervals.Reference Ge, Coburn, Nazaretski, Xu, Gofron, Xu, Yin and Lee15 A disadvantage of TXM over SXM, however, is its limited modalities. Absorption-contrast is the major one used in a TXM and a drawback is its low sensitivity for a weakly absorbing material. Although phase contrast that improves the sensitivity can be realized with a Zernike ring (a ring structure that introduces a phase change to the wavefield, see Figure 2c), quantitative analysis is often difficult. Recently, the development of TXM with energy scans across an element’s absorption edge enabled chemical sensitivity, greatly extending the envelope of this technique.Reference Nelson, Harris, Izzo, Grew, Chiu, Chu, Yi, Andrews, Liu and Pianetta17,Reference Meirer, Cabana, Liu, Mehta, Andrews and Pianetta18 Combined with its fast imaging speed, TXM enables a 3D view of the chemical and structural evolution of a dynamical system and provides critical insights into the underlying mechanisms of materials evolution.Reference Wang, Chen-Wiegart, Eng, Shen and Wang19
Electron tomography (ET) operates in a similar manner to x-ray imaging-based tomography. In the (scanning) transmission electron microscope (S/TEM), projection images of a nanoscale sample are taken in either the full-field transmission mode or the scanning mode with a focused scanning beam. (Scanning) transmission electron microscopy (STEM) has seen significant improvements in resolution in the past decade due to the development and availability of aberration correctors and brighter sources. Sub-Angstrom resolution can readily be achieved in these modern instruments. While the lateral resolution of the S/TEM is quite impressive, the depth resolution is nearly 50× worse than the lateral resolution because the usable numerical apertures are still quite small, in the 10–50 mrad range. Therefore, tilt-series tomography is still the most reliable way to image 3D internal structures of materials at the nano- and atomic scales.
In this article, we do not discuss in detail how to achieve these the high spatial resolutions in various different S/TEM imaging modes, but it is useful to compare and contrast the regimes in which electron tomography operates and to outline some of the challenges the electron tomography field faces, as described next.
Sample size: Because electrons interact strongly with solid materials and the elastic/inelastic mean free path for a 200 keV electron in mid-Z materials is around 100 nm, S/TEM is more suitable for imaging samples that are no thicker than 100 nm.
Field of view: For electron tomography, the features of interest are typically smaller than tens of nanometers and the resolution required to resolve them is typically higher than 3 nm. Both the lateral sample size and the need to meet the Crowther limit place a constraint on the field of view. (The resolution of a tomography reconstruction is determined by the Crowther criterion. The minimum number of views, n, to reconstruct a particle of diameter D to a real-space resolution of d is given by n  $ = {{{\rm{\pi }}D} \over d}$).
Thus, the field of view is typically in the 100–300 nm range for nanoscale tomography and in the 10–20 nm range for atomic resolution.
Tilt range: Sample holders used in electron tomography are usually limited to –70° to 70° tilt, and sometimes even less. The limitation is typically due to two factors. In most TEM instruments, the gap between the electromagnetic lenses is typically 1–6 mm. A 3-mm TEM sample grid and the extra width needed to hold the grid limits the tilt range to +/–75°. This can be mitigated by using smaller sample grids or shaping the sample into a needle shape. The second limitation is that for lamellar-type samples the imaging thickness grows with the rotation angle, θ, at the rate of  ${1 \mathord{\left/ {\vphantom {1 {{\rm{cos}}\left( \theta \right)}}} \right. \kern-\nulldelimiterspace} {{\rm{cos}}\left( \theta \right)}}$. Thus, at a 70° tilt, the thickness is already 3× that at 0° tilt. Therefore, at high tilt angles, there is significant resolution loss if the sample is imaged in the bright-field TEM mode without an energy filter. This is why in cellular electron tomography, it is common to use –60° to +60° tilt range, even though there is plenty of room for high tilts.
Number of projection images: In the TXM, resolution is defined by the pixel size, and therefore, for a modern pixelated device that has a few thousand by a few thousand pixels, a few thousand projection images are acquired to meet the Crowther limit. In a TEM, the images are oversampled by a factor of 10–100. For example, for imaging 1-nm features, a field of view less than 50 nm would be used and the images would have at least 512 × 512 pixels. With this in mind and considering the need to limit radiation damage, the number of projections required typically falls in the range between 70 and 140. Therefore, in the angular domain, ET is undersampled compared to TXM tomography.
Time resolution: Electron tomography is slow because most mechanical stages are not sufficiently eucentric (sample remains centered while being tilted) for the small field of view used in ET. For every tilt increment, the sample needs to be tracked and brought back to the center of the field of view either through stage or image/beam translation. In the traditional setup, it takes 1–3 h to acquire a full-tilt series from –70° to +70°.
Having compared and contrasted ET with TXM-based tomography, the real advantage of electron tomography is its high spatial resolution and rich signals that can be used for reconstructing not only the mass distribution, but also chemistry, composition, electric and magnetic fields, grain orientations and strain, dislocations, and defects.Reference Midgley and Weyland20,Reference Midgley and Dunin-Borkowski21 As shown in Figure 3a–b, high-angle annular dark-field scanning transmission electron microscopy (HAADF-STEM) and STEM electron energy-loss spectroscopic (STEM-EELS) tomography can clearly map out two distinct internal structures developed, in this case during the oxidation of Ni-Co nanoparticles. The oxide hollow structure is formed due to the Kirkendall effect (because metal cations have a higher diffusion rate in the oxide film than oxygen and therefore voids form due to the nucleation of the metal vacancies), whereas the Swiss-cheese-like structure suggests that oxide shell breakage occurred during the oxidation process that allows oxygen to infiltrate the interior.Reference Han, Meng, Wang, Zhu, Wang, Du, Stach and Xin22Figure 3b shows the 3D compositional information retrieved from a STEM-EELS tomography data set. It shows that in the Swiss-cheese structure, both the internal surfaces and the external surfaces are Co-rich. This again confirms that oxygen has infiltrated the internal structure during the oxidation process, which drives oxygen absorbate-induced Co segregation. Figure 3c shows a high-resolution bright-field (BF) TEM tomography reconstruction of a NiO nanoplate that shows that the edges of these nanoplates have 3D complexity—the edge has an obtuse-angle knife-edge shape terminated by a pair of (001) and (111) nanofacets.Reference Sun, Wang, Mirkin, Cheng, Zheng, Richards, Lin and Xin23

Figure 3. (a, b) HAADF-STEM and STEM-EELS tomography reconstruction of oxidized Ni-Co nanoparticles. (c) Transmission electron microscope (TEM) tomography reconstruction of the facet terminations of a NiO oxygen reduction nanocatalyst. (d) Polymer patches on a Au nanosphere reconstructed using low-dose TEM tomography. (e) Atomic electron tomography reconstruction of Pt-Fe nanoparticles. (f) Application of single-particle cryo-electron microscopy technique to the 3D reconstruction of DNA origamis. (g) A newly proposed deep-learning approach that utilizes two generative adversarial models to jointly fill the missing-wedge information and remove artifacts for electron tomography reconstructions.Reference Midgley and Dunin-Borkowski21–Reference Tian, Wang, Liu, Xin, Li, Ke, Shih and Gang26,Reference Ding, Liu, Zhang and Xin47
For imaging soft or biological materials, the TEM mode offers much higher contrast and higher dose efficiency (dose required for focusing is minimal). Xin and colleagues used a low-keV and low-dose tomography technique and applied it to imaging the 3D distribution of polymer patches on gold nanospheres (Figure 3d).Reference Choueiri, Galati, Thérien-Aubin, Klinkova, Larin, Querejeta-Fernández, Han, Xin, Gang, Zhulina, Rubinstein and Kumacheva24Figure 3e shows how electron tomography can not only resolve atomic features inside nanomaterials, but is also sensitive enough to differentiate heavy versus medium heavy elements.Reference Zhou, Yang, Yang, Kim, Yuan, Tian, Ophus, Sun, Schmid, Nathanson, Heinz, An, Zeng, Ercius and Miao25 This information is extremely important for understanding how materials restructure at the single atom scale. Figure 3f shows a different type of 3D imaging technique in the TEM, the single-particle cryoEM approach. Technically speaking, the single-particle approach is not tomography because it requires all imaged objects to be identical; however, it is useful for imaging highly monodispersed materials such as DNA origamis and shape-controlled nanoparticles (Figure 3f).Reference Tian, Wang, Liu, Xin, Li, Ke, Shih and Gang26,Reference Wang, Slater, Leteba, Roseman, Race, Young, Kirkland, Lang and Haigh27
Because of the large range of missing projections, electron tomography typically suffers from a severe missing-wedge problem, which arises in the reciprocal space because the reconstruction does not have information from a continuous range of missing angles, which looks like a blank wedge. Mathematically speaking, the tomography inverse problem is mathematically ill-defined because the solution is non-unique. However, regularized inversionReference Sreehari, Venkatakrishnan, Wohlberg, Buzzard, Drummy, Simmons and Bouman29,Reference Batenburg, Bals, Sijbers, Kübel, Midgley, Hernandez, Kaiser, Encina, Coronado and Van Tendeloo34,Reference Xu, Chen, Wu, Scott, Theis, Ophus, Bartels, Yang, Ramezani-Dakhel, Sawaya, Heinz, Marks, Ercius and Miao36,Reference Goris, Van den Broek, Batenburg, Heidari Mezerji and Bals39–Reference Pryor, Yang, Rana, Gallagher-Jones, Zhou, Lo, Melinte, Chiu, Rodriguez and Miao45 and machine learning approaches,Reference Ha and Mueller46 particularly deep learning,Reference Ding, Liu, Zhang and Xin47 have offered some viable solutions. For example, Xin and colleagues show that the unacquired projection information can be effectively recovered by joining two inpainting generative adversarial network (GAN) models (an advanced deep-learning architecture that is capable of producing deepfake imagesReference Kietzmann, Lee, McCarthy and Kietzmann28in the projection [sinogram] and reconstruction [tomogram] domains separately) (Figure 3g).Reference Ding, Liu, Zhang and Xin47 The joint deep-learning model achieves remarkable tomography reconstruction quality for missing-wedge projection series with a missing angle as large as 45°.Reference Ding, Liu, Zhang and Xin47 The improved performance of this model stems from the fact that the problem was decoupled into two separate domains. In each domain, a unique solution, based on trained “priors,” can be learned efficiently. In addition, compared with the regularization-based method, this deep-learning method is an end-to-end method without any tuning parameters. Its performance is independent of prior knowledge or the human operator’s experience in setting hyperparameters.
In this issue
The recent development of nano-resolution x-ray spectro-tomography is reviewed by Yu et al.Reference Yu, Wang and Liu30 in their article in this issue, where they discuss the associated technical challenges and its use in characterizing energy-storage materials. Understanding the failure mechanisms of a lithium-ion battery is a long-standing problem that limits the battery’s capacity, reliability, and lifetime. To tackle this challenge, understanding the evolving compositional and chemical heterogeneity of the materials in the battery and their connection to the morphology of the electrode upon cycling are crucial. By tuning x-ray energy across the absorption edge of a target element, TXM is shown to not only differentiate the element of interest from its surrounding matrix, but also determine its valence state through x-ray absorption spectroscopy (XAS). In this article, the authors identify a few examples where TXM-XAS revealed critical information about the phase change in the (de)lithiation process. Particularly, an in situ study provided a five-dimensional (5D) data set (positions, chemical state, and time) that offered fundamental insights into the electrochemical reaction occurring in a single cathode particle. The vast amount of data also imposes a challenge in data analysis, which the authors touch upon by showing how advanced data mining methods can help to alleviate this difficulty.
The article by Gürsoy and JacobsenReference Gürsoy and Jacobsen31 provides an overview of scanning x-ray microscopy (SXM) for which a suite of imaging modalities is available. The technique offers a 3D view of electron density, chemical composition, magnetic field, and strain variation in a material. They describe how the technique works and the different acquisition methods for nanotomography, as well as the associated challenges. A few examples of applications are presented. Though a slow data acquisition speed is the major limitation of SXM, several scanning strategies can be adopted to address this issue. The authors believe that nanotomography achieved with SXM offers unique opportunities for imaging millimeter-sized specimens with nanometer scale spatial resolution, and it will have widespread use as fourth generation diffraction-limited synchrotron sources come online.
For electron tomography, two articles discuss the application and development of electron tomography at two length scales—the nanoscale and the atomic scale. Hovden and MullerReference Hovden and Muller32 discuss STEM tomography that provides quantifiable internal morphology and spectroscopic detection of elements, and recent innovations in computational reconstruction algorithms and 3D visualization tools. This article highlights the growth of electron tomography and the many scientific applications that utilize 3D structural, chemical, and functional imaging at the nanometer and subnanometer length scales.
Zhou et al.Reference Zhou, Yang, Ercius and Miao33 discuss the development of electron tomography for resolving atomic features in materials. The article summarizes the recent progress in developing atomic electron tomography through selected highlights of recent results on the determination of 3D atomic coordinates in materials and capturing how the atoms rearrange during the early stages of nucleation at atomic resolution.
Experimental techniques that allow the structure of a bulk material to be probed in three dimensions are essential to understanding the processes responsible for the development of material’s structure. The article by Yildirium et al.Reference Yildirim, Cook, Detlefs, Simons and Poulsen4 discusses a dark-field microscope that enables measurements of the local changes in a crystalline lattice, such as changes in phase, strain, and orientation. Using the penetrating ability of x-rays, it is possible to probe these changes in bulk, thus avoiding effects of small sample sizes associated with the thin foils used in electron microscopy. As an example of the bulk evolution of materials, they probe the strain and mosaicity of a single grain following deformation. They also illustrate the technique’s versatility by giving examples for how this technique can be used to provide insights into the evolution of functional materials such as SrTiO3 and biomaterials.
Future perspectives
X-ray tomography has evolved from a 3D imaging technique that provides a single modality and micrometer resolution to one with multimodality, nanometer resolution and in situ/operando capability. Strong scientific demand is the driving force for the development of x-ray tomography with faster speeds and higher spatial resolutions and capable of providing multimodal information. Advances in x-ray optics, instrumentation, and methodology have been fueling such development and are resulting in a continuously improving technique. As x-ray tomography advances, a challenge that arises is the large size of the data sets, which makes the data analysis and information extraction a daunting task. This not only requires a visualization tool that can render a high-dimensional data set to highlight subtle changes in physical and chemical quantities, but also a method to perform the analysis in an autonomous manner. Rapidly evolving machine learning approaches may provide a plausible solution, and its combination with tomography may build the synergy needed for technical breakthroughs.Reference Batenburg, Bals, Sijbers, Kübel, Midgley, Hernandez, Kaiser, Encina, Coronado and Van Tendeloo34 The next generation of x-ray sources will provide greater x-ray brightness and coherency compared to the current ones. This promises to significantly reduce the time required to acquire data and thus make second or subsecond temporal resolution dark-field microscopy possible in the near future, and promises to provide new views into the evolution of a wide range of materials.
Over the past few years, the resolution of electron tomography has seen dramatic improvements.Reference Zhou, Yang, Yang, Kim, Yuan, Tian, Ophus, Sun, Schmid, Nathanson, Heinz, An, Zeng, Ercius and Miao25,Reference Xu, Chen, Wu, Scott, Theis, Ophus, Bartels, Yang, Ramezani-Dakhel, Sawaya, Heinz, Marks, Ercius and Miao36,Reference Scott, Chen, Mecklenburg, Zhu, Xu, Ercius, Dahmen, Regan and Miao37 Though powerful, the current way of conducting electron tomography data collection and reconstruction is still far from optimal. The learning curve of electron tomography is still steep, making it a specialized technique that is far from being routinely used by the wider materials community. To achieve wider adoption of tomography imaging in the TEM field, the first area of improvement is speed. As stated earlier, electron tomography is slow because there is no perfect eucentricity. However, the current way of tracking objects tilt by tilt completely neglects the fact that the way the sample moves as a function of tilt angle is a repeatable process with a certain degree of hysteresis. With an improved tracking scheme, the acquisition time of electron tomography can be easily improved by a factor of 10.Reference Lin, Han and Xin38
Second, one of the unique problems of electron tomography is that it suffers from the severe missing wedge problem due to either limited space or unfavorable sample geometry. This ill-defined inverse problem has traditionally been mitigated by regularized inversion.Reference Sreehari, Venkatakrishnan, Wohlberg, Buzzard, Drummy, Simmons and Bouman29,Reference Batenburg, Bals, Sijbers, Kübel, Midgley, Hernandez, Kaiser, Encina, Coronado and Van Tendeloo34,Reference Goris, Van den Broek, Batenburg, Heidari Mezerji and Bals39–Reference Pryor, Yang, Rana, Gallagher-Jones, Zhou, Lo, Melinte, Chiu, Rodriguez and Miao45 However, all of these methods have hyperparameters that are problem-specific and need to be adjusted by the human operators. In this respect, machine learning approachesReference Ha and Mueller46 and specifically, deep learning,Reference Ding, Liu, Zhang and Xin47 offer end-to-end solutions to produce artifact-free reconstructions without the need of an experienced ET expert.
Third, for reconstruction of ET data, the most difficult part is the spatial registration of the projection images. Alignment of images was traditionally done by a combination of cross-correlation and human refinement. For nanoscale data, the method of subvolume reprojection and alignment works relatively robustly, however, finding good alignment for an atomic-resolution data set is still challenging because the alignment is prone to get trapped in the periodic local minima.
Fourth, electron tomography is almost always limited by radiation damage. HAADF-STEM tomography has many advantages over BF-TEM tomography, however, when it comes to low-dose imaging of low-Z materials or soft–hard interfaces, BF-TEM in most cases is superior. Even for atomic resolution tomography, TEM has the advantage of requiring a minimal dose for focusing and also higher contrast (as the low-frequency background is filtered out by the phase contrast transfer function). In addition, the exact focus is not critical (if more than one defocus is acquired) as opposed to that in HAADF-STEM: the imaging contrast reduces significantly when the defocus changes only a couple of nanometers (depth of focus of an aberration-corrected STEM is around 5 nm).Reference Ren, Ophus, Chen and Waller41
Apart from the remaining technical challenges awaiting to be resolved, there are many more channels of signals (e.g., electric and magnetic fields, charge, grain orientation and local symmetryReference Meng and Zuo50) to be explored for multidimensional imaging. For this reason, electron tomography will continue to be one of the most exciting and promising research directions in the TEM field and a significant investment is needed to develop better algorithms, stages, holders, and detectors to resolve the aforementioned challenges. It is expected this field will see rapid evolution in the next few years benefiting from the surge in machine learning-oriented research.

Hanfei Yan has been a staff scientist at the National Synchrotron Light Source II at Brookhaven National Laboratory since 2007. He received his PhD degree in materials science and engineering from Columbia University in 2005. He completed postdoctoral research at Argonne National Laboratory. His research interests focus on x-ray nanofocusing optics, high-resolution tomography, x-ray spectro-microscopy, nanoscale strain mapping, and dynamical diffraction theory. Yan can be reached by email at hyan@bnl.gov.

Peter Voorhees is the Frank C. Engelhart Professor of Materials Science and Engineering at Northwestern University, and Professor of Engineering Sciences and Applied Mathematics. He is the co-director of the Northwestern-Argonne Institute of Science and Engineering and co-director of the Center for Hierarchical Materials Design. He received his PhD degree in materials engineering from Rensselaer Polytechnic Institute. He has published more than 250 papers in the area of the thermodynamics and kinetics of phase transformations. Voorhees can be reached by email at p-voorhees@northwestern.edu.

Huolin L. Xin has been a professor at the University of California, Irvine (UCI), since 2018. He graduated from the Physics Department of Cornell University in 2011. He was a permanent staff scientist at Brookhaven National Laboratory (BNL), managing the in situ electron microscopy and the electron tomography programs from 2013 to 2017, and from 2017 to 2018, he took scientific leadership of the electron microscopy facility in the Center for Functional Nanomaterials at BNL until his departure. He completed postdoctoral research at Lawrence Berkeley National Laboratory from 2011 to 2013, respectively. Xin has published more than 170 peer-reviewed journal articles, with more than 30 of them published in Science/Nature and their sister journals. His current research focuses on the development of deep-learning-enabled self-driving transmission electron microscopy and advanced energy materials. Xin can be reached by email at huolin.xin@uci.edu.


