


Introduction
Tourmaline is the most common and the earliest-formed boron mineral on Earth and has recently received increasing interest from the geoscience community (Grew et al., Reference Grew, Krivovichev, Hazen and Hystad2016; Dutrow and Henry, Reference Dutrow and Henry2018; Henry and Dutrow, Reference Henry and Dutrow2018). Tourmaline minerals are complex borosilicates that have been studied extensively in terms of their crystal structure and crystal chemistry (e.g. Foit, Reference Foit1989; Grice and Ercit, Reference Grice and Ercit1993; Ertl et al., Reference Ertl, Hughes, Pertlik, Foit, Wright, Brandstatter and Marler2002; Novák et al., Reference Novák, Povondra and Selway2004; Bosi and Lucchesi, Reference Bosi and Lucchesi2007; Bosi Reference Bosi2013, Reference Bosi2018; Novák et al., Reference Novák, Škoda, Filip, Macek and Vaculovič2011; Henry and Dutrow, Reference Henry and Dutrow2011; Henry et al., Reference Henry, Novák, Hawthorne, Ertl, Dutrow, Uher and Pezzotta2011; Cempírek et al., Reference Cempírek, Houzar, Novák, Groat, Selway and Šrein2013; Ertl et al., Reference Ertl, Henry and Tillmanns2018; Andreozzi et al., Reference Andreozzi, Bosi, Celata, Capizzi, Stagno and Beckett-Brown2020).
The general chemical formula of tourmaline can be written as: XY3Z6T6O18(BO3)3V3W, where X = Na, K, Ca and □ (= vacancy); Y = Al, Cr, V, Fe, Mg, Mn, Zn, Cu, Li and Ti; Z = Al, Cr, V, Fe and Mg; T = Si, Al and B3+; B = B3+; V = (OH) and O; and W = (OH), F and O. Note that the non-italicised letters X, Y, Z and B represent groups of cations hosted at the [9]X, [6]Y, [6]Z, [4]T and [3]B crystallographic sites (letters italicised). The letters V and W represent groups of anions accommodated at the [3]O3 and [3]O1 crystallographic sites, respectively. The H atoms occupy the H3 and H1 sites, which are related to O3 and O1, respectively. The dominance of specific ions at one or more sites of the structure gives rise to a range of distinct mineral species.
Tourmaline-supergroup minerals are currently classified into three groups, vacant, alkali and calcic, based on the X-site occupancy (Henry et al., Reference Henry, Novák, Hawthorne, Ertl, Dutrow, Uher and Pezzotta2011). The X-site occupancy is usually related to both paragenesis and crystallisation conditions of the host rock, and these relations may be used to reconstruct the host-rock thermal and chemical history (e.g. Henry and Dutrow, Reference Henry, Dutrow, Grew and Anvitz1996; van Hinsberg et al., Reference van Hinsberg, Henry and Dutrow2011a,Reference van Hinsberg, Henry and Marschallb; Dutrow and Henry, Reference Dutrow and Henry2018; Bosi et al., Reference Bosi, Naitza, Skogby, Secchi, Conte, Cuccuru, Hålenius, De La Rosa, Kristiansson, Charlotta Nilsson, Ros and Andreozzi2018, Reference Bosi, Naitza, Secchi, Conte, Cuccuru, Andreozzi, Skogby and Hålenius2019c; Ahmadi et al., Reference Ahmadi, Tahmasbi, Khalaji and Zal2019). A further level of classification into subgroups is based on charge arrangements at the Y and Z sites. Tourmalines are also distinguished by the dominant anion at the W position of the general formula into hydroxy-, fluor- and oxy-species.
Tourmaline is also one of the most important gem materials on the market today, particularly renowned for its spectrum of colours: from colourless, through red, pink, yellow, orange, green, blue and violet, to brown and black (Pezzotta and Laurs, Reference Pezzotta and Laurs2011). The transition elements (Ti, V, Cr, Fe, Mn and Cu) are often invoked as colour-causing agents. Red tourmalines are commonly given the varietal name ‘rubellite’, which refers to tourmalines with colours ranging from rose, dark pink to purplish red, but do correspond to several regular mineral species: elbaite, fluor-elbaite, rossmanite, fluor-liddicoatite (Pezzotta and Laurs, Reference Pezzotta and Laurs2011) and oxy-dravite (Bosi and Skogby, Reference Bosi and Skogby2013).
Specifically, fluor-liddicoatite was redetermined and renamed in 2011 by the Subcommittee on Tourmaline Nomenclature of the International Mineralogical Association's Commission on New Minerals, Nomenclature and Classification (IMA-CNMNC) when the nomenclature of tourmaline-supergroup minerals was reconsidered (Henry et al., Reference Henry, Novák, Hawthorne, Ertl, Dutrow, Uher and Pezzotta2011) and the ‘liddicoatite’ from the Antandrokomby type locality (Dunn et al., Reference Dunn, Appleman and Nelen1977; Aurisicchio et al., Reference Aurisicchio, Demartin, Ottolini and Pezzotta1999; Webber, Reference Webber, Simmons and Falster2002; Dirlam et al., Reference Dirlam, Laurs, Pezzotta and Simmons2002; Ertl et al., Reference Ertl, Hughes, Prowatke, Ludwig, Prasad, Brandstätter, Körner, Schuster, Pertlik and Marschall2006; Lussier et al., Reference Lussier, Abdu, Hawthorne, Michaelis, Aguiar and Kroeker2011; Lussier and Hawthorne, Reference Lussier and Hawthorne2011) regained proper attention. Note that with the renaming of the type material as fluor-liddicoatite, the hydroxy species ‘liddicoatite’ is no longer properly defined as a species. A new type material definition is necessary to re-establish the name. Two gem-quality samples of purplish-red prismatic crystals of alleged ‘liddicoatite’ on quartz matrix from the collection of M.E. Ciriotti (MEC) were analysed with a Jeol JSM IT300LV scanning electron microscope (SEM) and energy dispersive X-ray spectroscopy (EDS) (University of Turin, Earth Sciences Department) to verify if they were F-dominant species. Although B and Li were not measured, both samples were determined to be F-dominant and were classified as fluor-liddicoatite. A small portion of a further alleged ‘liddicoatite’ sample (presented as ‘probed’ liddicoatite by its seller) in quartz–rhodizite matrix from Antandrokomby localities (the same type of purplish-red crystals are shown in the specimen in Fig. 1) was obtained by MEC, courtesy of the new owner. The sample was analysed through SEM-EDS and surprisingly showed no trace of F; in addition, its composition did not fit ‘liddicoatite’ in terms of Na and Ca.
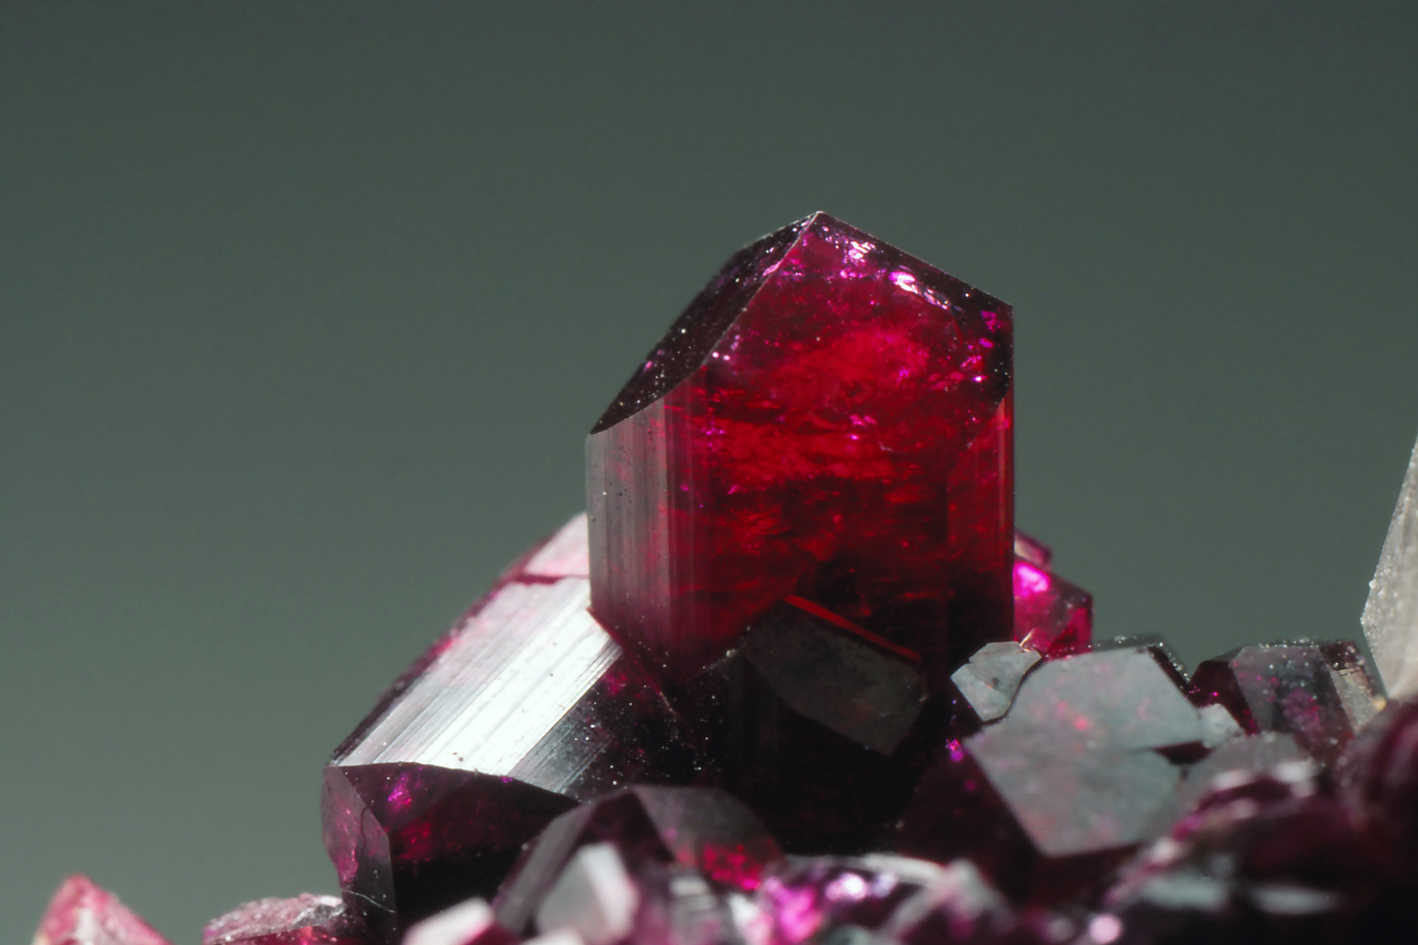
Fig. 1. Crystals of Mn-bearing purplish-red tourmaline from Madagascar, up to 1 cm in size (field of view ca. 5 cm). Sample deposited in the collections of the Natural History Museum of Milano, Italy (photo by R. Appiani).
In the present study, such a tourmaline sample from the Anjanabonoina pegmatite, central Madagascar, has been fully characterised by X-ray single-crystal diffraction, electron microprobe analysis, laser induced breakdown spectroscopy, micro-Raman, infrared and optical absorption spectroscopy, with the aim of defining its crystal-chemical identity and species.
Occurrence
The indexed stout prismatic purplish-red crystal was labelled (by the supplier) ‘liddicoatite’ from Anjanabonoina pegmatites, Ambohimanambola, Betafo, Vakinankaratra, Madagascar, ~55 km west-southwest of the city of Antsirabe. In addition to Anjanabonoina, ‘liddicoatite’ has been identified from several localities in central and south-central Madagascar, including Antaboaka, Jochy, Lacamisinten, Malakialina, Maroandro and the Sahatany Valley, as well as Vohitrakanga (De Vito, Reference De Vito, Aurisicchio, Ferrini and Pezzotta2002a,Reference De Vito, Aurisicchio, Ferrini and Pezzottab; Dirlam et al., Reference Dirlam, Laurs, Pezzotta and Simmons2002), but the present labelled locality is correct (F. Pezzotta, personal communication).
The Anjanabonoina aplite–pegmatite field is situated in the Neoproterozoic Itrembo Group, which consists of a lower unit of gneisses and an upper unit of quartzites, schists and marbles (Pezzotta and Franchi, Reference Pezzotta, Franchi, Cox and Ashwal1997; Fernandez et al., Reference Fernandez, Huber, Schreurs, Villa and Rakotondrazafy2001). The pegmatites were emplaced in a complex geological environment, perhaps at the contact between the lower and upper unit. The gem-bearing pegmatites postdate the main tectonic phase and, therefore, are thought to have intruded during a late phase of the magmatic cycle about 490 Ma (Paquette and Nédélec, Reference Paquette and Nédélec1998). The Li–Cs–Ta (with minor Nb–Y–F) aplite–pegmatite field extends for ~2.5 km. The veins are 2 to 12 m thick and large parts are kaolinised feldspars and/or deeply weathered (De Vito, Reference De Vito, Aurisicchio, Ferrini and Pezzotta2002a,Reference De Vito, Aurisicchio, Ferrini and Pezzottab).
More details about the history of the 1500s to 2000s explorations and mining of the Malagasy tourmaline gem deposits can be found in Strunz (Reference Strunz1979), Pezzotta (Reference Pezzotta1999) and Dirlam et al. (Reference Dirlam, Laurs, Pezzotta and Simmons2002).
Experimental methods and results
Thermal treatment
In order to study potential dehydration and redox effects, two oriented and polished crystals were heat treated in air at 700°C (20 h) and 750°C (90 h). These thermal conditions have previously been shown to be sufficient to impose changes in Fe redox states and intracrystalline cation distribution (e.g. Filip et al., Reference Filip, Bosi, Novák, Skogby, Tuček, Čuda and Wildner2012; Bosi et al., Reference Bosi, Skogby and Hålenius2016a,Reference Bosi, Skogby and Balić-Žunićb). The 55 and 309 μm thick samples were placed in a gold container and inserted in a preheated horizontal tube furnace equipped with a quartz-glass tube. The experiments were ended by pushing the sample container out to the cold zone of the quartz tube, which caused the sample to cool to room temperature within one minute. A distinct increase in colour intensity appeared after heat treatment, as shown in Fig. 2. Minor cracks appeared in the thicker sample after treatment at the higher temperature.
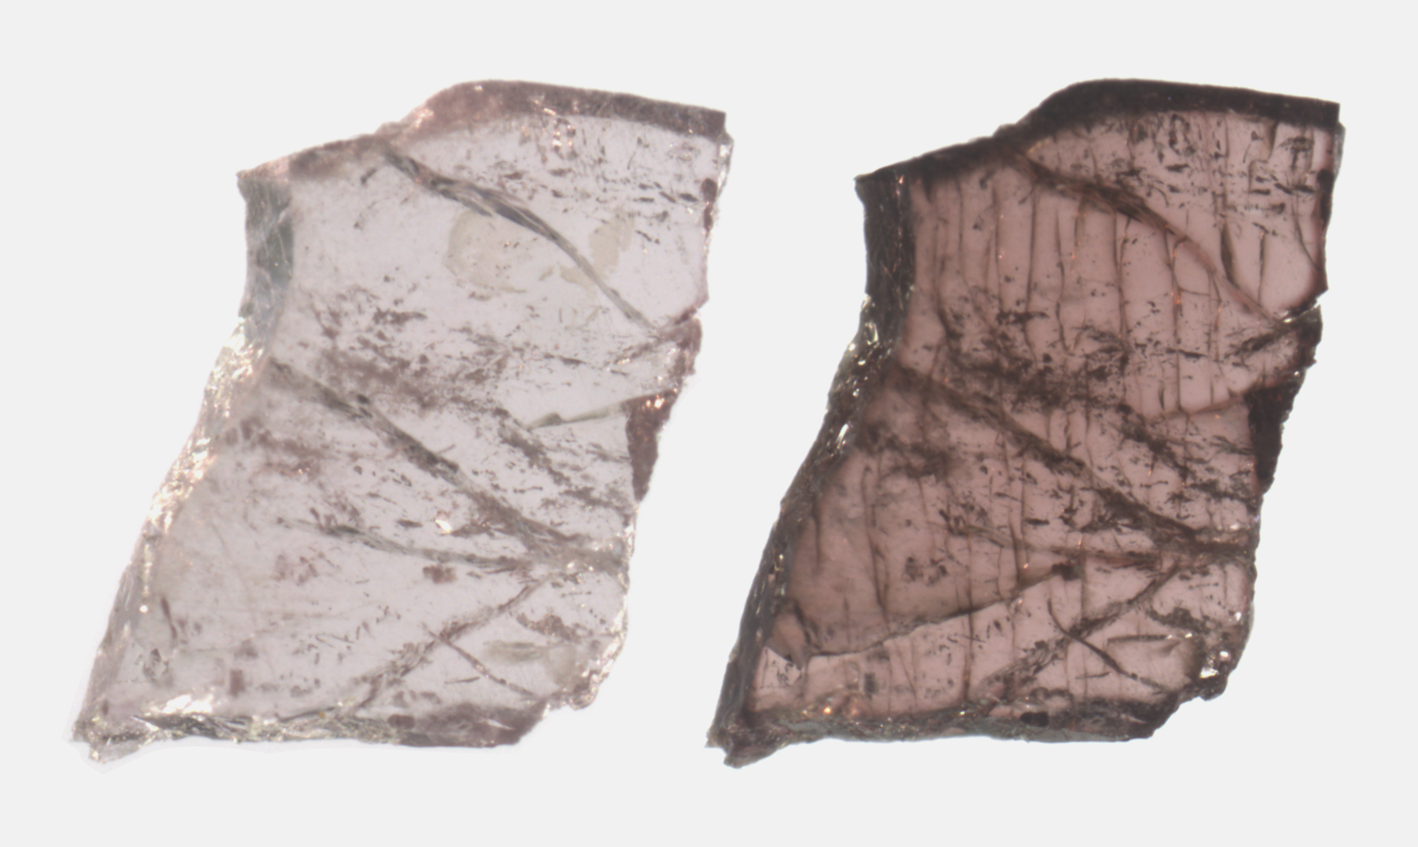
Fig. 2. Microphoto of Mn-bearing tourmaline from Madagascar before (on the left) and after (on the right) heat treatment at 750°C. Sample thickness 300 μm, long edge corresponds to 2 mm.
Single-crystal structure refinement (SREF)
A representative crystal fragment of the purplish-red tourmaline from Madagascar was selected for X-ray diffraction measurements on a Bruker KAPPA APEX-II single-crystal diffractometer (Sapienza University of Rome, Earth Sciences Department), equipped with a charge-coupled device (CCD) area detector (6.2 cm × 6.2 cm active detection area, 512 × 512 pixels) and a graphite-crystal monochromator using MoKα radiation from a fine-focus sealed X-ray tube. The sample-to-detector distance was 4 cm. A total of 3577 exposures (step = 0.2°, time/step = 20 s) covering a full reciprocal sphere with a redundancy of ~12 was collected. Final unit-cell parameters were refined using the Bruker AXS SAINT program on reflections with I > 10 σ(I) in the range 5° < 2θ < 78°. The intensity data were processed and corrected for Lorentz, polarisation and background effects using the APEX2 software program of Bruker AXS. The data were corrected for absorption using a multi-scan method (SADABS, Bruker AXS). The absorption correction led to an improvement in R int (from 0.033 to 0.027). No violation of R3m symmetry was detected.
Structure refinement was done using the SHELXL-2013 program (Sheldrick, Reference Sheldrick2015). Starting coordinates were taken from Bosi et al. (Reference Bosi, Andreozzi, Skogby, Lussier, Abdu and Hawthorne2013). Variable parameters were scale factor, extinction coefficient, atom coordinates, site-scattering values (for X, Y and Z sites) and atomic-displacement factors. Attempts to refine the extinction coefficient yielded values within its standard uncertainty, thus it was not refined. Neutral scattering factors were used for the cations and oxygen atoms. As for the atomic model refinement and in accordance with the chemical analysis results (see below), the X site was modelled by setting the vacancy content to 0.32 atoms per formula unit (apfu) and allowing the remainder of the site to refine as Ca = (0.65 – Na). Similarly, the Y site was refined by setting the (Mn+Fe) occupancy to 0.19 apfu and allowing the remainder of the site to refine as Al = (2.81 – Li) apfu. The T site was modelled by Si versus B. The Z, B and anion sites were modelled with Al, B and O scattering factors, respectively, and with a fixed occupancy of 1 as refinement with unconstrained occupancies showed no significant deviations from this value. A final refinement was then performed by modelling the site occupancy of the O1 site with O and F fixed to the value obtained from the empirical formula (see below). Similar chemical constraints were applied to refine the H1 and H3 sites. There were no correlations greater than 0.7 between the parameters at the end of the refinement.
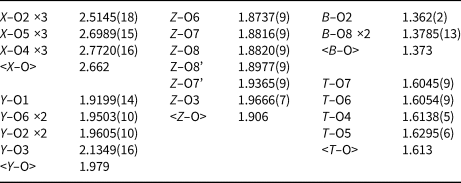
Table 1 lists crystal data, data-collection information and refinement details; Table 2 gives the fractional atom coordinates and equivalent isotropic displacement parameters; Table 3 shows selected bond lengths. A Supplementary Table with anisotropic displacement parameters and a crystallographic information file have been deposited with the Principal Editor of Mineralogical Magazine and are available as Supplementary material (see below).
Table 1. Single-crystal X-ray diffraction data details for the purplish-red tourmaline from Madagascar.

Notes: R int = merging residual value; R 1 = discrepancy index, calculated from F-data; wR 2 = weighted discrepancy index, calculated from F 2 data; GooF = goodness of fit; Diff. Peaks = maximum and minimum residual electron density.
Table 2. Fractional atom coordinates, equivalent isotropic and isotropic displacement parameters (Å2) and site occupancies for the purplish-red tourmaline from Madagascar.
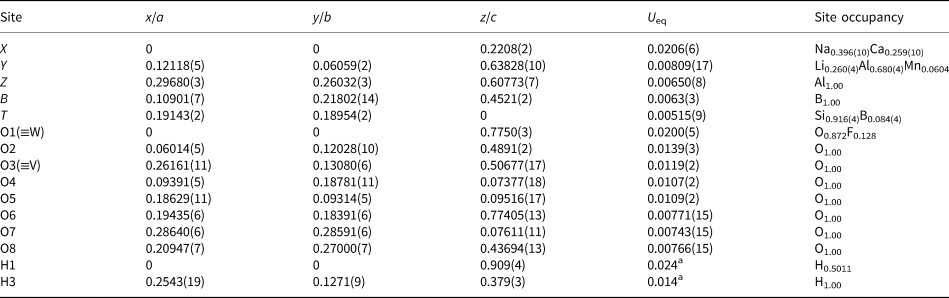
a Isotropic displacement parameters (U iso) for H1 and H3 constrained to have a U iso 1.2 times the U eq value of the O1 and O3 oxygen atoms.
Table 3. Selected bond lengths (Å) for the purplish-red tourmaline from Madagascar.
Electron microprobe analysis (EMPA)
Electron microprobe analysis, carried out on the same crystal that was used for the SREF, was performed using a wavelength dispersive spectrometer (WDS mode) with a Cameca SX50 instrument at the Istituto di Geologia Ambientale e Geoingegneria, CNR, Rome, Italy. The following analytical conditions were used: accelerating voltage 15 kV, beam current 15 nA and spot diameter 10 μm. Minerals and synthetic compounds were used as standards: wollastonite (Si, Ca), magnetite (Fe), rutile (Ti), corundum (Al), vanadinite (V), fluorophlogopite (F), periclase (Mg), jadeite (Na), orthoclase (K), sphalerite (Zn), rhodonite (Mn), metallic Cr and Cu. The PAP routine was applied (Pouchou and Pichoir, Reference Pouchou, Pichoir, Heinrich and Newbury1991). The results (Table 4) represent mean values of 8 spot analyses. Vanadium, Cr, Cu, Zn and K were below detection limits (<0.03 wt.%). Chemical analysis is given in Table 4; no other elements heavier than F were detected.
Table 4. Chemical composition for the purplish-red tourmaline from Madagascar.
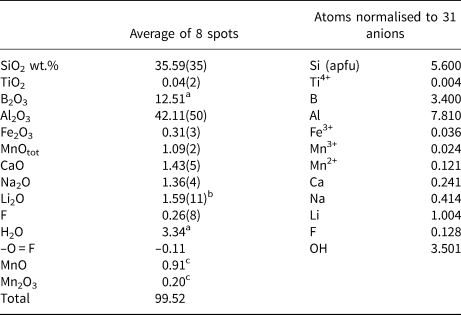
a Calculated by stoichiometry, (Y+Z+T+B) = 18.000 apfu.
b Determined by μ-LIBS
c Determined by OAS.
Errors for oxides and fluorine are standard deviations (in brackets); apfu = atoms per formula unit.
Micro-laser induced breakdown spectroscopy (μ-LIBS)
Lithium analysis, carried out on a representative sample fragment, was performed using a double pulse Q-Switched (Nd-YAG, λ = 1064 nm) laser with a 1 μs delay between the two pulses with an energy of 110 mJ per pulse. The small spot size (7–10 μm) was obtained using a petrographic optical microscope (objective lens 10X NA 0.25 WD 14.75 mm). The LIBS spectra were acquired by an AvaSpec Fiber Optic Spectrometer (390–900 nm with 0.3 nm resolution) with a delay of 2 μs after the second pulse and an integration time of 1 ms.
The main problem regarding Li quantification by LIBS concerns the self-absorption of the emission line used to extract quantitative data. In the present tourmaline, the quantitative data were obtained from linear regression using the main Li emission line intensity (I Li = 670.706 nm, corresponding to the resonance transition 1s 2 2s > 1s 2 2p) in the range from 0.009 to 2.04 wt.% of Li2O. In this regard, we verified that the self-absorption effect of this specific line was negligible in the studied concentration range, hence, not affecting the measurements. This is consistent with previous studies on beryl (McMillan et al., Reference McMillan, McManus, Harmon, De Lucia and Miziolek2006; Tempesta and Agrosì, Reference Tempesta and Agrosì2016; Tempesta et al., Reference Tempesta, Bosi and Agrosì2020). Moreover, the low variability of counts, verified by measurements on uniform matrix materials such as that of NIST glass samples, allowed us to perform measurements on tourmaline samples which normally have chemical zoning. The calibration, obtained using spectra recorded on two NIST standard glasses (SRM 610 and 612) and four Li-bearing tourmalines from Bosi et al. (Reference Bosi, Agrosì, Lucchesi, Melchiorre and Scandale2005), Filip et al. (Reference Filip, Bosi, Novák, Skogby, Tuček, Čuda and Wildner2012), Grew et al. (Reference Grew, Bosi, Gunter, Hålenius, Trumbull and Yates2018) and Bosi et al. (Reference Bosi, Skogby and Hålenius2019d), resulted in two calibration curves: one below and the other above 0.1 Li2O wt.% (Fig. 3). The latter was used for the present sample to obtain the Li quantification from the linear fit equation: Li2O = 0.00139(3) ⋅ I Li – 4.07(11). The result corresponds to 1.59(11) wt.% of Li2O (Table 4).
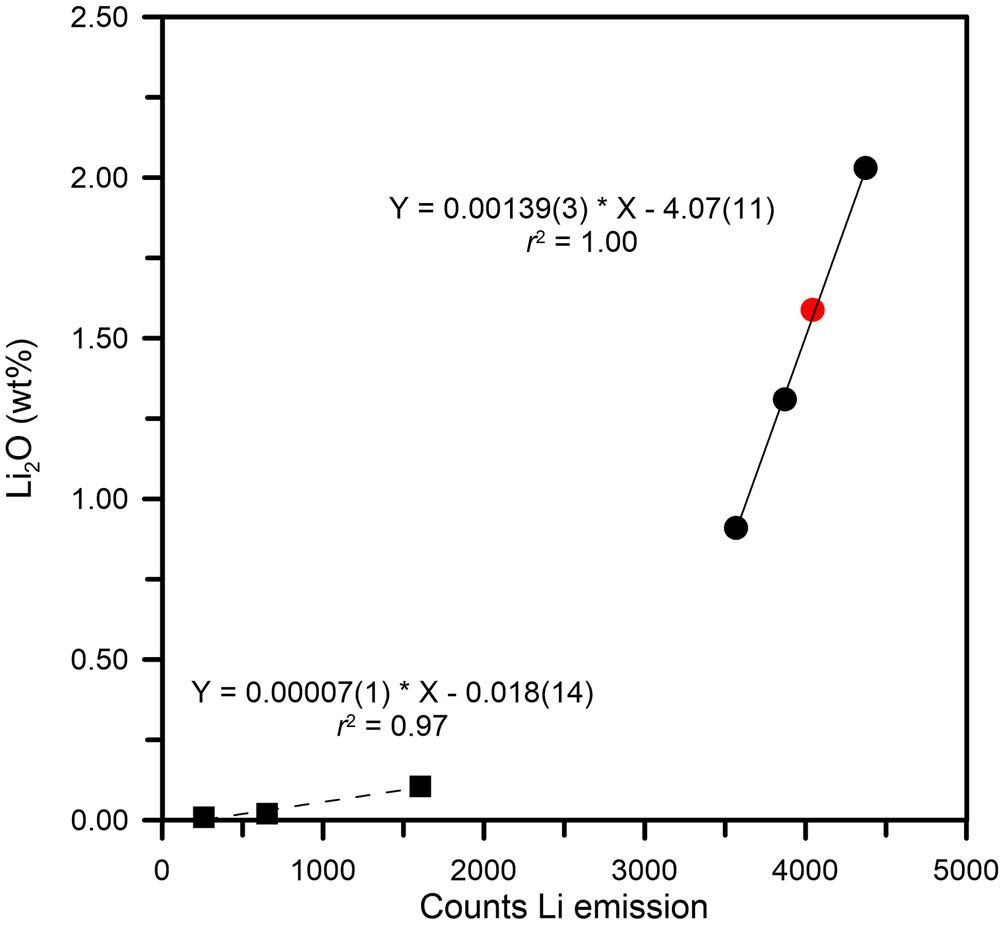
Fig. 3. Calibration of the Li emission line at 670.7 nm. The calibration resulted in two branches (one below and the other above 0.1 Li2O wt.%) described by two regression lines. Black squares represent samples from NIST standard glasses (SRM 610 and 612) and Filip et al. (Reference Filip, Bosi, Novák, Skogby, Tuček, Čuda and Wildner2012), black circles are from Bosi et al. (Reference Bosi, Agrosì, Lucchesi, Melchiorre and Scandale2005, Reference Bosi, Skogby and Hålenius2019d) and Grew et al. (Reference Grew, Bosi, Gunter, Hålenius, Trumbull and Yates2018); and a red filled circle represents the present sample.
It can be noted that μ-LIBS represents a very proficient localised analytical method, in particular if LIBS is mounted to a microscope to achieve a micrometric scale resolution. The intense emissivity of Li in optical emission spectroscopy makes the LIBS technique advantageous for Li quantification. Moreover, the potential of LIBS for Li analysis of geological materials at the micrometric scale has been validated in previous studies (Fabre et al., Reference Fabre, Boiron, Dubessy, Chabiron, Charoy and Crespo2002; Sweetapple and Tassios, Reference Sweetapple and Tassios2015; McMillan et al., Reference McMillan, Curry, Dutrow and Henry2018).
Micro-Raman spectroscopy
Raman spectra of the Mn3+-bearing red tourmaline were obtained using a micro/macro Jobin Yvon Mod. LabRam HRVIS (University of Turin, Interdepartmental Centre “G. Scansetti”), equipped with a motorised x-y stage and an Olympus microscope. The back-scattered Raman signal was collected with a 50× objective and the Raman spectrum was obtained for a 90° (perpendicular to c) oriented crystal. The 632.8 nm line of an He–Ne laser was used as excitation; laser power (20 mW) was controlled by means of a series of density filters. The minimum lateral and depth resolution was set to a few μm. The system was calibrated using the 520.6 cm–1 Raman band of silicon before each experimental session. The spectra were collected with a multiple and repeated acquisition (5) with single counting times of 50 seconds to improve the signal-to-noise ratio. The incident excitation light was scrambled to eliminate orientation and polarisation effects. The spectrum was recorded from 100 to 4000 cm–1 using the LabSpec 5 software package (Horiba Jobin Yvon GmbH, 2004, 2005). Band-component analysis was undertaken using a Lorentzian function (Fityk software package; Wojdyr, Reference Wojdyr2010). The intensity of the vibrational modes was proven to be very dependent on the polarisability tensor. The Raman spectrum of the present sample in the spectral region of the framework and (OH)-stretching vibrations is shown in Fig. 4.
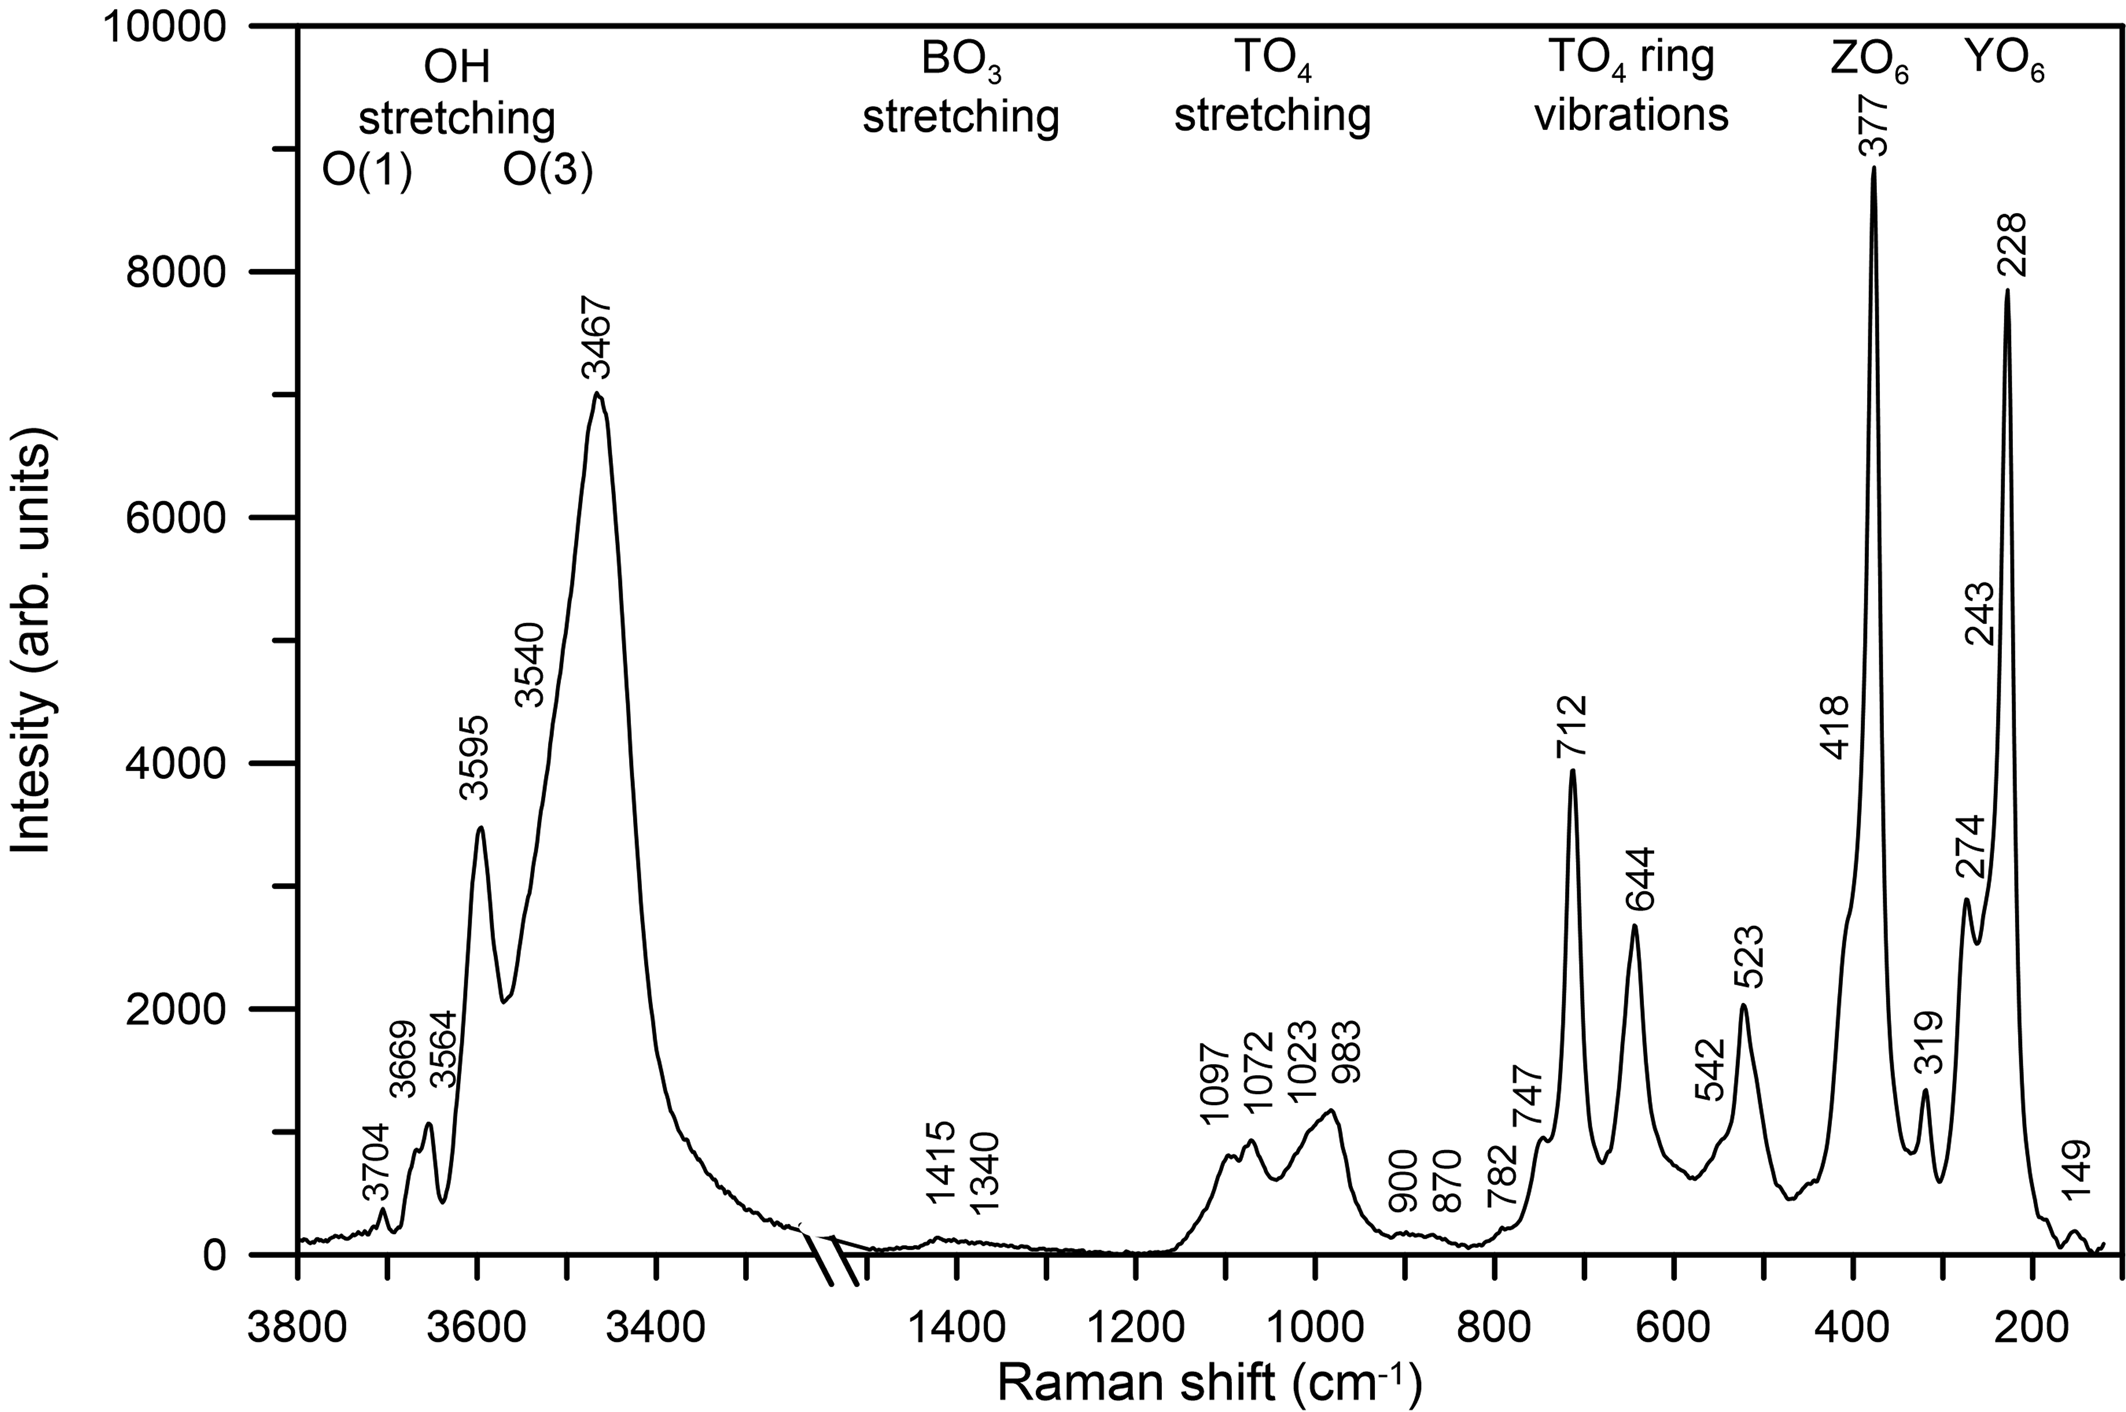
Fig. 4. Raman spectrum of the untreated Mn-bearing purplish-red tourmaline from Madagascar.
Fourier-transform infrared (FTIR) spectroscopy
Polarised Fourier-transform infrared spectra were measured on two doubly polished single-crystal sections oriented by means of optical microscopy, and with thicknesses of 55 and 309 μm. The spectrometer system consisted of a Bruker Vertex 70 spectrometer equipped with a halogen-lamp source and a CaF2 beam-splitter coupled to a Hyperion 2000 microscope with a ZnSe wire-grid polariser and an InSb detector. Spectra were measured before and after heat-treatment experiments over the wavenumber range 2000–15,000 cm−1 with a resolution of 2 or 8 cm−1. The measuring areas were masked by a 50–100 μm rectangular aperture to avoid cracks and inclusions. The FTIR spectra of the untreated and treated samples (e.g. Fig. 5) show typical, strongly pleochroic absorption bands in the (OH)-stretching region (3300–3800 cm–1), including bands above ~3600 cm–1 that demonstrate the presence of W(OH) (see below).
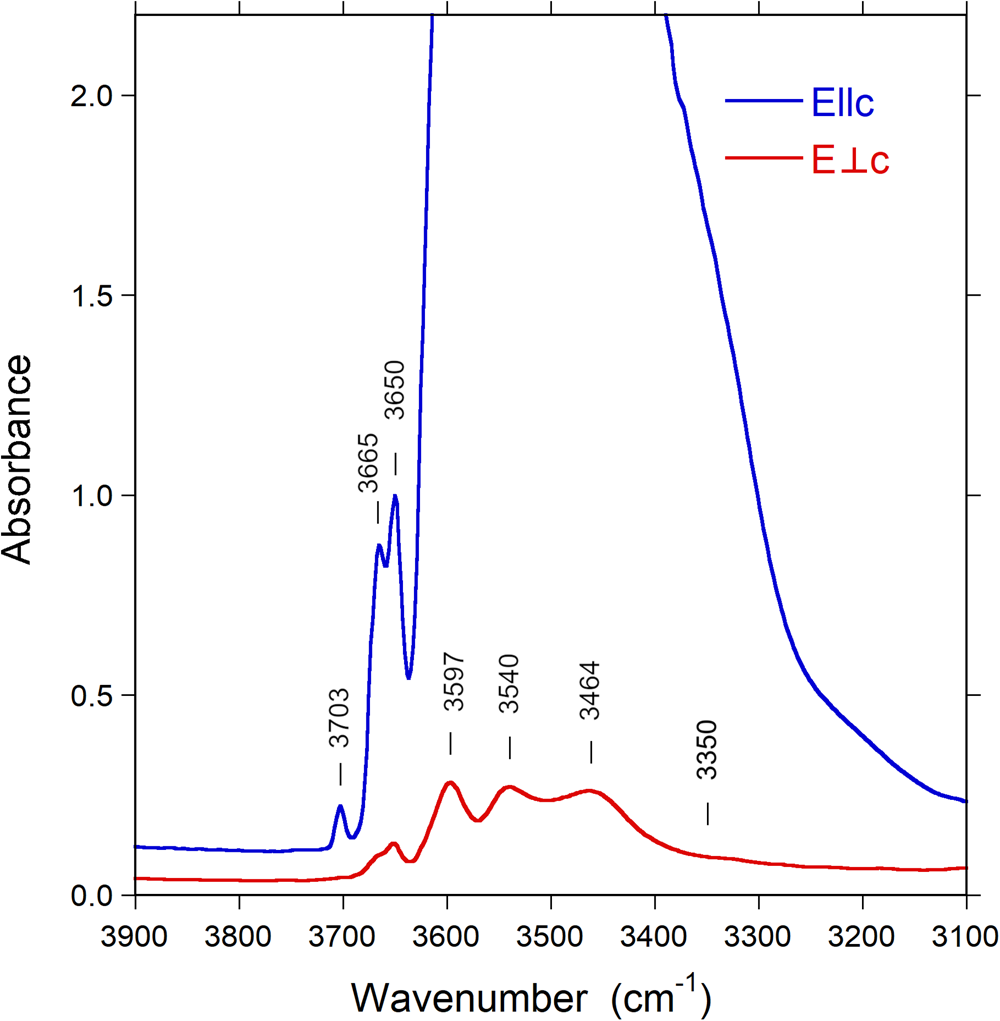
Fig. 5. Polarised FTIR spectra (E||c and E⊥c) of untreated Mn-bearing purplish-red tourmaline from Madagascar. Sample thickness 55 μm. Spectra are vertically off-set for clarity. Peak positions are indicated.
Optical absorption spectroscopy (OAS)
Polarised, room temperature optical absorption spectra in the range 30,000–12,500 cm–1 (333–800 nm) were recorded at a spectral resolution of 1 nm on the same 309 μm thick section studied by FTIR spectroscopy, using an AVASPEC-ULS2048 × 16 spectrometer attached via a 400 μm ultraviolet (UV) optical fibre cable to a Zeiss Axiotron UV-microscope. A 75 W Xenon arc lamp was used as a light source, and Zeiss Ultrafluar 10× lenses served as objective and condenser. The diameter of the circular aperture was 50 μm for the untreated sample and 30 μm for the treated sample. A UV-quality Glan–Thompson prism with a working range from 40,000 to 3704 cm−1 (250 to 2700 nm) was used as a polariser. The wavelength scale of the spectrometer was calibrated against Ho2O3-doped and Pr2O3/Nd2O3-doped standards (Hellma glass filters 666F1 and 666F7). Spectral data in the range 12,150–2000 cm–1 (800–5000 nm) was taken from the FTIR measurements.
The optical absorption spectra of the untreated sample (Fig. 6) at energies below the UV-absorption edge show a set of broad absorption bands at 21,950, 19,800, ~18,000, 13,500 and ~9500 cm–1 (corresponding to 456, 505, 556, 741 and 1053 nm). In addition, a very weak and sharp absorption band occurs at 24,330 cm–1 (418 nm), and a set of very sharp, overlapping bands are recorded in the NIR spectral range between 6700–7200 cm–1 (1492–1389 nm). The absorption bands recorded in spectra of the untreated sample at 24,330, 21,950 and ~18,000 cm–1 are more intense for light polarised perpendicular to the crystallographic c-axis. Conversely, the absorption band 19800 cm–1 is only observed as a broad shoulder in the E||c-spectrum. The set of sharp bands between 6700–7200 cm–1 is also completely E||c-polarised.
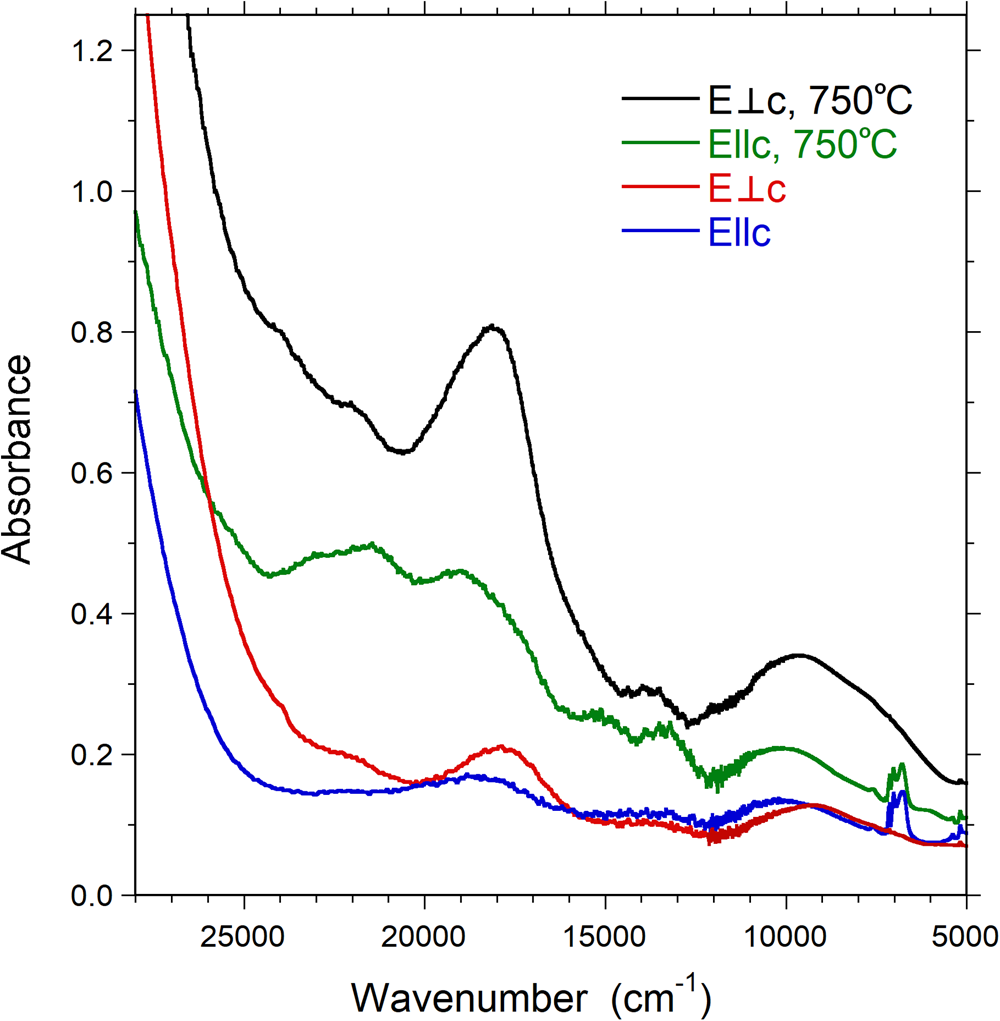
Fig. 6. Polarised OAS spectra (E||c and E⊥c) of untreated and treated Mn-bearing purplish-red tourmaline from Madagascar. Sample thickness 309 μm. Spectra are vertically off-set for clarity.
The absorption spectra recorded on the heat-treated sample (Fig. 6) display comparable features to those observed in the spectra of the natural sample. However, all absorption bands at 21,950, 19,800, ~18,000, 13,500 and ~9500 cm–1 show pronounced intensity gains, and the set of sharp absorption bands between 6700–7200 cm–1 distinctly decreases in intensity.
Determination of atomic fractions
For the untreated sample, manganese oxidation state was determined by OAS (see below and Table 4). All Fe was considered to be Fe3+ based on the OAS results and Mn and Fe redox potential arguments. Lithium was determined by μ-LIBS. Regarding the B3+, the SREF data indicate that it fully occupies the B site, but relatively small amounts of B3+ also occur at the T site: T-m.a.n. = 13.24(7) and <T–O> = 1.613 Å are in fact significantly smaller than the expected value for a T site fully occupied by Si (TSi-m.a.n. = 14 and <TSi–O> = 1.619 ± 0.001 Å; Bosi and Lucchesi, Reference Bosi and Lucchesi2007), reflecting the presence of cations lighter and smaller than Si, such as B3+ (Ertl et al., Reference Ertl, Henry and Tillmanns2018). As a result, the B2O3 and (OH) content were calculated by charge balance with the assumption (T + Y + Z + B) = 18.00 apfu and 31 anions.
For the heat-treated sample, all Mn was considered as Mn3+ (i.e. Mn2O3 = 1.21 wt.%), in conformity with the heat treatment conditions and the redox reaction:
 $$\lpar {{\rm M}{\rm n}^{2 + }} \rpar + \lpar {{\rm OH}} \rpar ^-\to \lpar {{\rm M}{\rm n}^{3 + }} \rpar + \lpar {{\rm O}^{2-}} \rpar + \raise.5ex\hbox{$\scriptstyle 1$}\kern-.1em/ \kern-.15em\lower.25ex\hbox{$\scriptstyle 2$} {\rm H}_2\lpar {\rm g} \rpar $$
Determination of site population and mineral formula
The anion site populations in the samples studied follow the general preference suggested for tourmaline (e.g. Henry et al., Reference Henry, Novák, Hawthorne, Ertl, Dutrow, Uher and Pezzotta2011): the O3 site (V position in the general formula) is occupied by (OH)–, while the O1 site (W position in the general formula) can be occupied by O2–, (OH)– and F–. The refined Z-site scattering and <Z–O> values (13 and 1.906 Å, respectively) are the typical values observed for a Z site fully occupied by Al (Bosi and Andreozzi, Reference Bosi and Andreozzi2013). The resulting empirical formula for the untreated sample is as follows:
 $$\eqalign{&^{\rm X} \lpar {{\rm N}{\rm a}_{0.41}\squ_{0.35}{\rm C}{\rm a}_{0.24}} \rpar _{\Sigma 1.00}{\rm ^{\rm Y}} \!\lpar {{\rm A}{\rm l}_{1.81}{\rm L}{\rm i}_{1.00}{\rm F}{\rm e}^{3 + }_{0.04} {\rm M}{\rm n}^{3 + }_{0.02} {\rm M}{\rm n}^{2 + }_{0.12} {\rm T}{\rm i}_{0.004}} \rpar_ {\Sigma 3.00} \cr &\quad\ \ \ {^{\rm Z}} \! {\rm A}{\rm l}_6\lsqb {^{\rm T} {\lpar {{\rm S}{\rm i}_{5.60}{\rm B}_{0.40}} \rpar }_{\Sigma 6.00}{\rm O}_{18}} \rsqb \lpar {{\rm B}{\rm O}_3} \rpar _3\lpar {{\rm OH}} \rpar _3 \cr &\quad\ \ \ {}^{\rm W} \lsqb {{\lpar {{\rm OH}} \rpar }_{0.50}{\rm F}_{0.13}{\rm O}_{0.37}} \rsqb _{\Sigma 1.00}$$
The bond-valence analysis is consistent with the proposed site populations (Table 5). Moreover, the amount of 0.40 TB3+ apfu is consistent with the relation of Hughes et al. (Reference Hughes, Ertl, Dyar, Grew, Wiedenbeck and Brandstätter2004): [4]B = [53.404–0.0346 ⋅ V cell] = 0.44 apfu.
Table 5. Weighted bond valences (valence units) for the purplish-red tourmaline from Madagascar.
Note: Weighted bond valence according to Bosi (Reference Bosi2014). Bond valence parameters from Brown and Altermatt (Reference Brown and Altermatt1985).
a Expected mean atomic valence (or formal charge) from the empirical formula.
As for the treated sample, the following ordered formula is proposed:
 $$\eqalign{&{}^{\rm X} \lpar {{\rm N}{\rm a}_{0.41}\squ_{0.35}{\rm C}{\rm a}_{0.24}} \rpar _{\Sigma 1.00} {\rm ^{\rm Y}} \! \lpar {{\rm A}{\rm l}_{1.81}{\rm L}{\rm i}_{1.00}{\rm F}{\rm e}^{3 + }_{0.04} {\rm M}{\rm n}^{3 + }_{0.15} {\rm T}{\rm i}_{0.004}} \rpar_{\Sigma 3.00} \cr &\qquad\ \ {\rm ^{\rm Z}} \! {\rm A}{\rm l}_6\lsqb {^{\rm T} {\lpar {{\rm S}{\rm i}_{5.60}{\rm B}_{0.40}} \rpar }_{\Sigma 6.00}{\rm O}_{18}} \rsqb \lpar {{\rm B}{\rm O}_3} \rpar _3\lpar {{\rm OH}} \rpar _3 \cr &\ \ \qquad{\rm ^{\rm W}} \! \lsqb {{\lpar {{\rm OH}} \rpar }_{0.38} {\rm F}_{0.13}{\rm O}_{0.49}} \rsqb _{\Sigma 1.00}$$
Discussion
Tourmaline classification
The empirical formula of the untreated sample is consistent with a tourmaline belonging to the alkali-group, subgroup 2 (Henry et al., Reference Henry, Novák, Hawthorne, Ertl, Dutrow, Uher and Pezzotta2011): it is Na-dominant (Na > □ > Ca) at the X position of the general formula of tourmaline XY3Z6T6O18(BO3)3V3W and hydroxy-dominant at W with (OH+F) > O and (OH) >> F. Because Al and Si are the dominant cations at the Z and T sites (respectively), the end-member formula can be approximated as X(Na)(Y3)Σ6+ Z(Al6)T(Si6O18)(BO3)3V(OH)3W(OH). For formula electroneutrality reasons, the valency-imposed double site-occupancy for the Y site is required with an atomic arrangement (Li1.5Al1.5)Σ6+. In accordance with the tourmaline nomenclature and the IMA-CNMNC rules (Henry et al., Reference Henry, Novák, Hawthorne, Ertl, Dutrow, Uher and Pezzotta2011; Bosi et al., Reference Bosi, Biagioni and Oberti2019a,Reference Bosi, Hatert, Hålenius, Pasero, Miyawaki and Millsb), the present sample can be classified as Mn-bearing elbaite, Na(Li1.5Al1.5)Al6Si6O18(BO3)3(OH)3OH.
Note that, although the empirical site-total-charge at Y (= +6.986) is very close to +7, suggesting the arrangement Y(Al2Li)Σ7+, the latter must be ruled out because it would lead to a charge imbalanced end-member formula: [Na(Al2Li)Al6(Si6O18)(BO3)3(OH)3OH]Σ1+. Thus, only atomic arrangements consistent with (Y3)Σ6+, such as (Al1.5Li1.5)Σ6+, can occur (Bosi et al., Reference Bosi, Biagioni and Oberti2019a,Reference Bosi, Hatert, Hålenius, Pasero, Miyawaki and Millsb).
Micro-Raman spectroscopy in the framework vibration region
In accordance with the studies of Mihailova et al. (Reference Mihailova, Gasharova and Konstantinov1996), Reddy et al. (Reference Reddy, Frost, Martens, Wain and Kloprogge2007), McKeown (Reference McKeown2008) and Watenphul et al. (Reference Watenphul, Schlüter, Bosi, Skogby, Malcherek and Mihailova2016b), five main ranges of framework vibrations can be identified in the Raman spectrum of the untreated sample (Fig. 4) and attributed to the following vibrating groups. (1) The range ~200–300 cm–1 is dominated by YO6 vibrations; in particular, the band at ~274 cm–1 corresponds to the Mn–O bond, previously observed in a pink-tourmaline by Reddy et al. (Reference Reddy, Frost, Martens, Wain and Kloprogge2007). (2) The range ~300–400 cm–1 (the strongest Raman peak) is generated by ZO6 vibrations, in particular the sharp peak at 377 cm–1 may be given by the ZAl–O bond. (3) The range ~500–750 cm–1 is dominated by breathing modes of bridging oxygen atoms of TO4 rings. (4) The range ~950–1100 cm–1 is generated mainly from TO4 stretching vibrations. (5) The range ~1300–1400 cm–1 arises from B–O stretching vibrations.
With regard to the region of the (OH)-stretching vibrations (3300–3800 cm–1), the Raman scattering peaks of the untreated sample show wavenumbers similar to those of the infrared absorption bands (cf. Fig. 4 with Fig. 5); thus, the (OH)-stretching modes are discussed below.
FTIR spectra in the (OH)-stretching region and band assignment
Infrared spectra of the untreated and treated samples recorded in polarised mode parallel to the c-axis direction display a very intense absorption feature in the 3400–3600 cm–1 region, which is truncated due to excessive absorption (Fig. 5). This problem is commonly encountered in polarised transmission spectra of tourmaline single crystals, and it is normally not possible to thin samples sufficiently to get this main band ‘on scale’. Bands of lower intensity occur on both the low-energy (ca. 3340 cm–1) and high-energy (3650, 3665 and 3703 cm–1) sides of the major absorption band. Spectra polarised perpendicular to the c-axis direction (E⊥c) show a set of bands with substantially lower intensities (Fig. 5). The spectral range that is obscured by excessive absorption in the E||c direction displays here the presence of three bands at wavenumbers 3464, 3540 and 3597 cm–1, indicating (OH)-dipoles aligned close to, but with a small inclination to the c-axis (Gatta et al., Reference Gatta, Bosi, McIntyre and Skogby2014).
After thermal treatment, a number of changes can be observed in the FTIR spectra: the sharp band at 3665 cm–1 progressively decreases in intensity and almost disappears in the E||c direction (Fig. 7), whereas a new band appears at 3395 cm–1, visible in the E⊥c direction (Fig. 8). The (OH) bands in the overtone region (Fig. 9) show a distinct decrease in absorption intensity, amounting to 17±3% as estimated from spectral fitting. However, a general decrease in absorption band intensity is not observed in the principal (OH)-region in spectra of the heat-treated samples polarised in the E⊥c direction. Instead, we observe a weak increase in intensity, probably related to a decrease in polarisation efficiency due to microcracks and other crystal imperfections formed during heat treatment, leading to minor contributions from the extremely intense absorbance in the E||c direction.
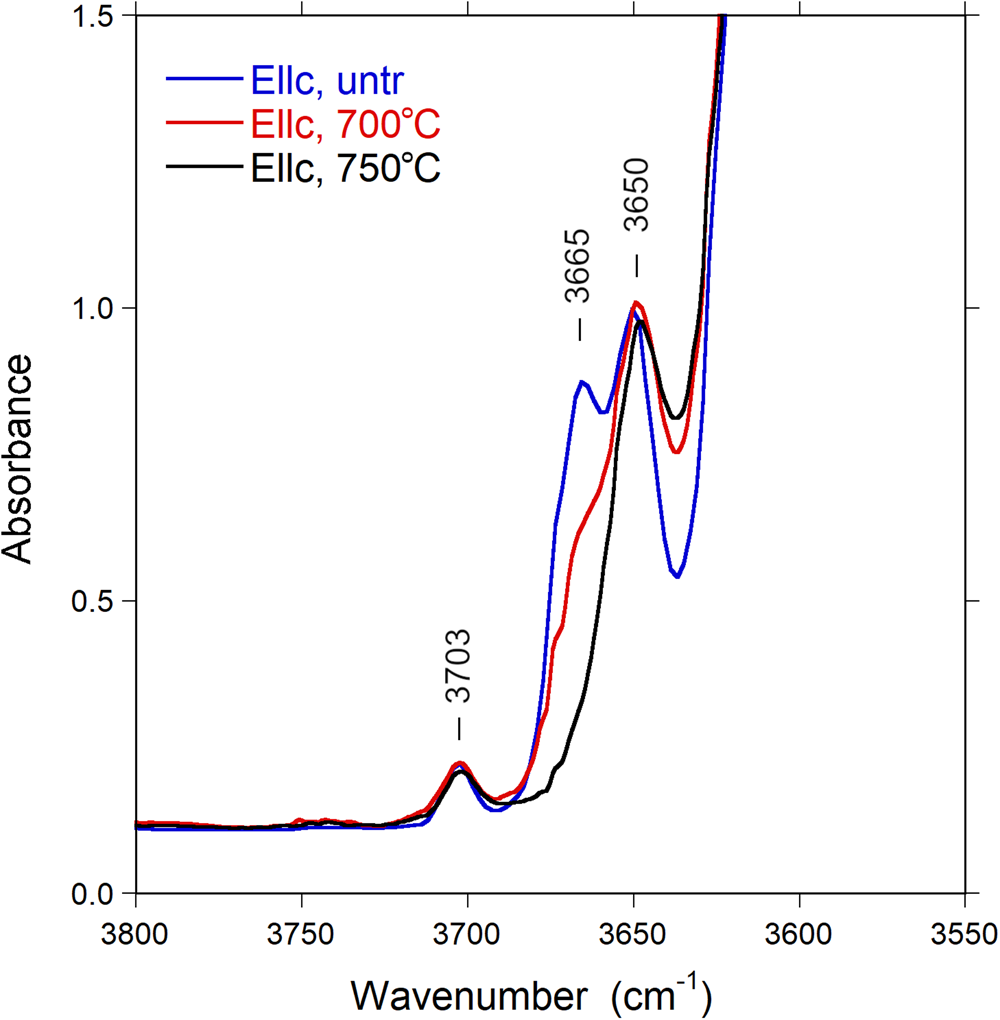
Fig. 7. Polarised FTIR spectra (E||c) of untreated and heat-treated Mn-bearing tourmaline. Sample thickness 55 μm. Spectra are vertically off-set for clarity. Peak positions are indicated.
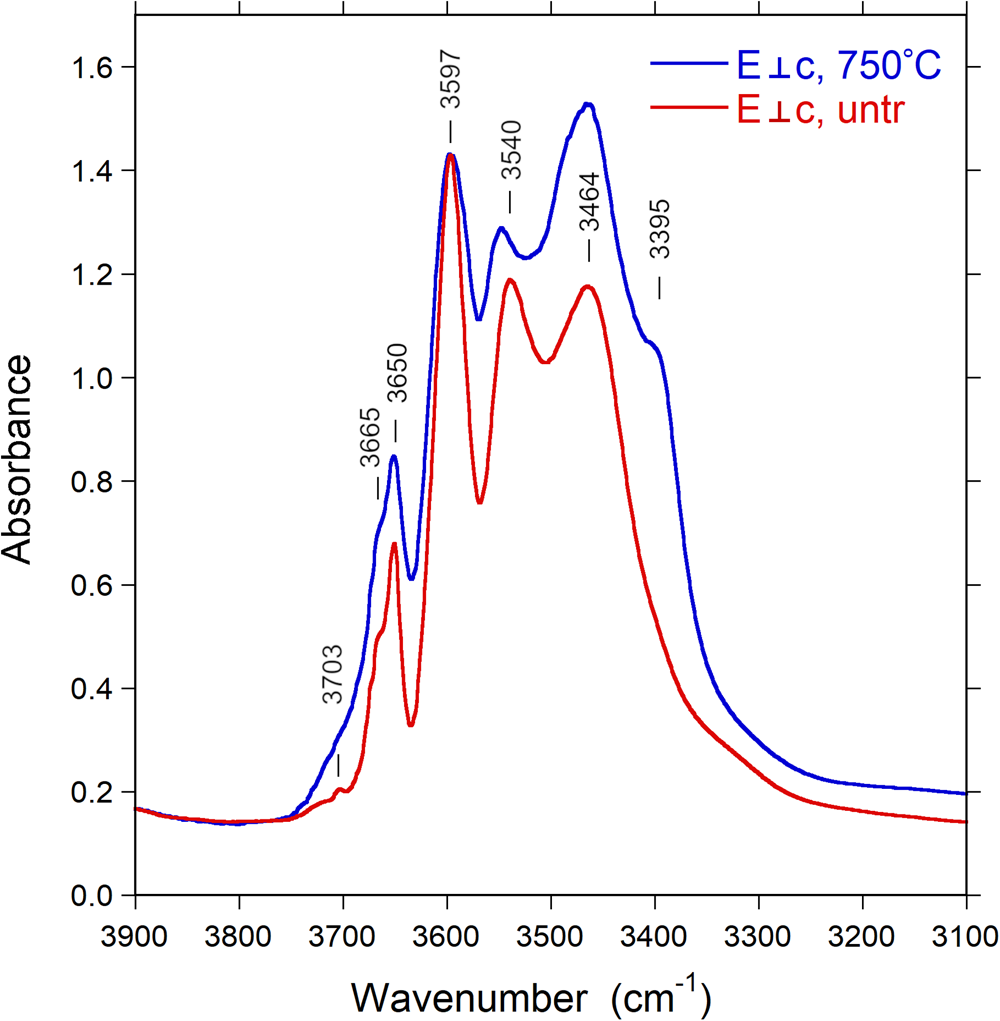
Fig. 8. Polarised FTIR spectra (E⊥c) of untreated Mn-bearing tourmaline. Sample thickness 309 μm. Spectra are vertically off-set for clarity. Peak positions are indicated. Note new band appearing at 3395 cm–1 after treatment.

Fig. 9. Polarised FTIR/NIR spectra (E||c) of untreated and heat-treated Mn-bearing tourmaline in the OH-overtone region. Sample thickness 309 μm. Spectra are vertically adjusted for clarity.
In the tourmaline structure, the O1 site (≡ W) is surrounded by three Y cations, whereas the O3 site (≡ V) is surrounded by one Y and two Z cations. In accord with Gatta et al. (Reference Gatta, Bosi, McIntyre and Skogby2014), we assume that: the O1(OH) group forms a very weak hydrogen bond (bond strength < 0.05 valence units, vu) with O4 and O5, whereas the O3(OH) group forms a weak hydrogen bond (bond strength ~0.11 vu) with the closest O5 atom (O3–H3⋅⋅⋅O5); the strength of the hydrogen bond will cause a frequency shift of the principal (OH)-stretching vibration (e.g. Libowitzky, Reference Libowitzky1999). Therefore, the relative weak vibrational bands above ~3600 cm–1 may be assigned to the O1 site, whereas the strong bands below ~3600 cm–1 may be assigned to the O3 site (e.g. Gonzalez-Carreño et al., Reference Gonzalez-Carreño, Fernandez and Sanz1988; Bosi et al., Reference Bosi, Skogby, Lazor and Reznitskii2015). Based on the studies of Skogby et al. (Reference Skogby, Bosi and Lazor2012), Bosi et al. (Reference Bosi, Skogby, Agrosì and Scandale2012, Reference Bosi, Skogby and Balić-Žunić2016b), Watenphul et al. (Reference Watenphul, Burgdorf, Schlüter, Horn, Malcherek and Mihailova2016a) and Kutzschbach et al. (Reference Kutzschbach, Wunder, Rhede, Koch-Müller, Ertl, Giester, Heinrich and Franz2016) as well as on the observed site populations, the FTIR bands of the present purplish-red tourmaline may be related to the following atomic arrangements:
~3350 cm–1 is assigned to hydrogen bond O3O–H3⋅⋅⋅O5, which may reflect both the presence of TB3+ and the X-site occupancy;
~3395 cm–1 is assigned to 3[Y(Mn3+,Al)ZAlZAl]–O3(OH)3;
~3464, 3540 and 3597 cm–1 to 3[Y(Li,Mn2+,Al)ZAlZAl]–O3(OH)3;
~3650 cm–1 is assigned to Y(LiAlAl)–O1(OH)–X(□);
~3665 cm–1 is assigned to Y(LiMn2+Al)–O1(OH)–X(□); and ~3703 cm–1 is assigned to Y(LiAlAl)–O1(OH)–X(Na).
The main difference between the FTIR spectra of the untreated and treated sample occurs in gradual decrease in the intensity of the band at 3665 cm–1 and the appearance of the band at 3395 cm–1 with the increase in temperature up to 750°C. As a result, these bands, in particular that at 3665 cm–1, may be correlated directly with the decreased Mn2+ and increased Mn3+ content, according to the redox reaction (1), reported in the section ‘Determination of atomic fractions’. However, it appears that (OH) is also lost by mechanisms other than the redox reaction. Only a partial loss of 0.12 (OH) apfu can be coupled to the oxidation of Mn2+, whereas the total (OH) loss as estimated from the decrease of (OH) overtone intensities (17 ± 3%) corresponds to ca. 0.6 (OH) apfu. The reason for this additional dehydration is unknown, but may be related to initial breakdown processes of the crystal structure.
Of particular interest is also the association of the O1(OH) stretching modes with the X-site constituents: the bands between ~3600–3700 cm–1 are considered associated with X□, whereas those above 3700 cm–1 are considered associated with XNa+. This distinction is related to the repulsive electrostatic interaction between the Xn + cation and H+ of the O1(OH) group, which reinforces the strength of the O1O–H bond, shifting the (OH)-stretching mode towards higher wavenumbers (e.g. Gonzalez-Carreño et al., Reference Gonzalez-Carreño, Fernandez and Sanz1988; Berryman et al., Reference Berryman, Wunder, Ertl, Koch-Müller, Rhede, Scheidl, Giester and Heinrich2016; Watenphul et al., Reference Watenphul, Burgdorf, Schlüter, Horn, Malcherek and Mihailova2016a). Consequently, the presence of XNa+ determines an electrostatic repulsion with H1H+ along the crystallographic c-axis, whereas the substitution X□ → XNa+ removes such a repulsion (Fig. 10). From the energetic-stability viewpoint, the rossmanite type arrangements (YYY)–O1(OH)–X(□) should hence be more likely to occur than the elbaite type arrangement (YYY)–O1(OH)–X(Na). The Xn +–H+ repulsion effect will be stronger with the substitution XCa2+ → XNa+. On the other hand, this cation–cation repulsion can be removed by the chemical substitution O1F– → O1(OH)– or the deprotonation process O1(OH)– + ¼ O2(g) → O1O2– + ½ H2O(g), both of which would favour the occurrence of fluor-liddicoatite and darrellhenryite type arrangements (YYY)–O1(O,F)–X(Na,Ca).
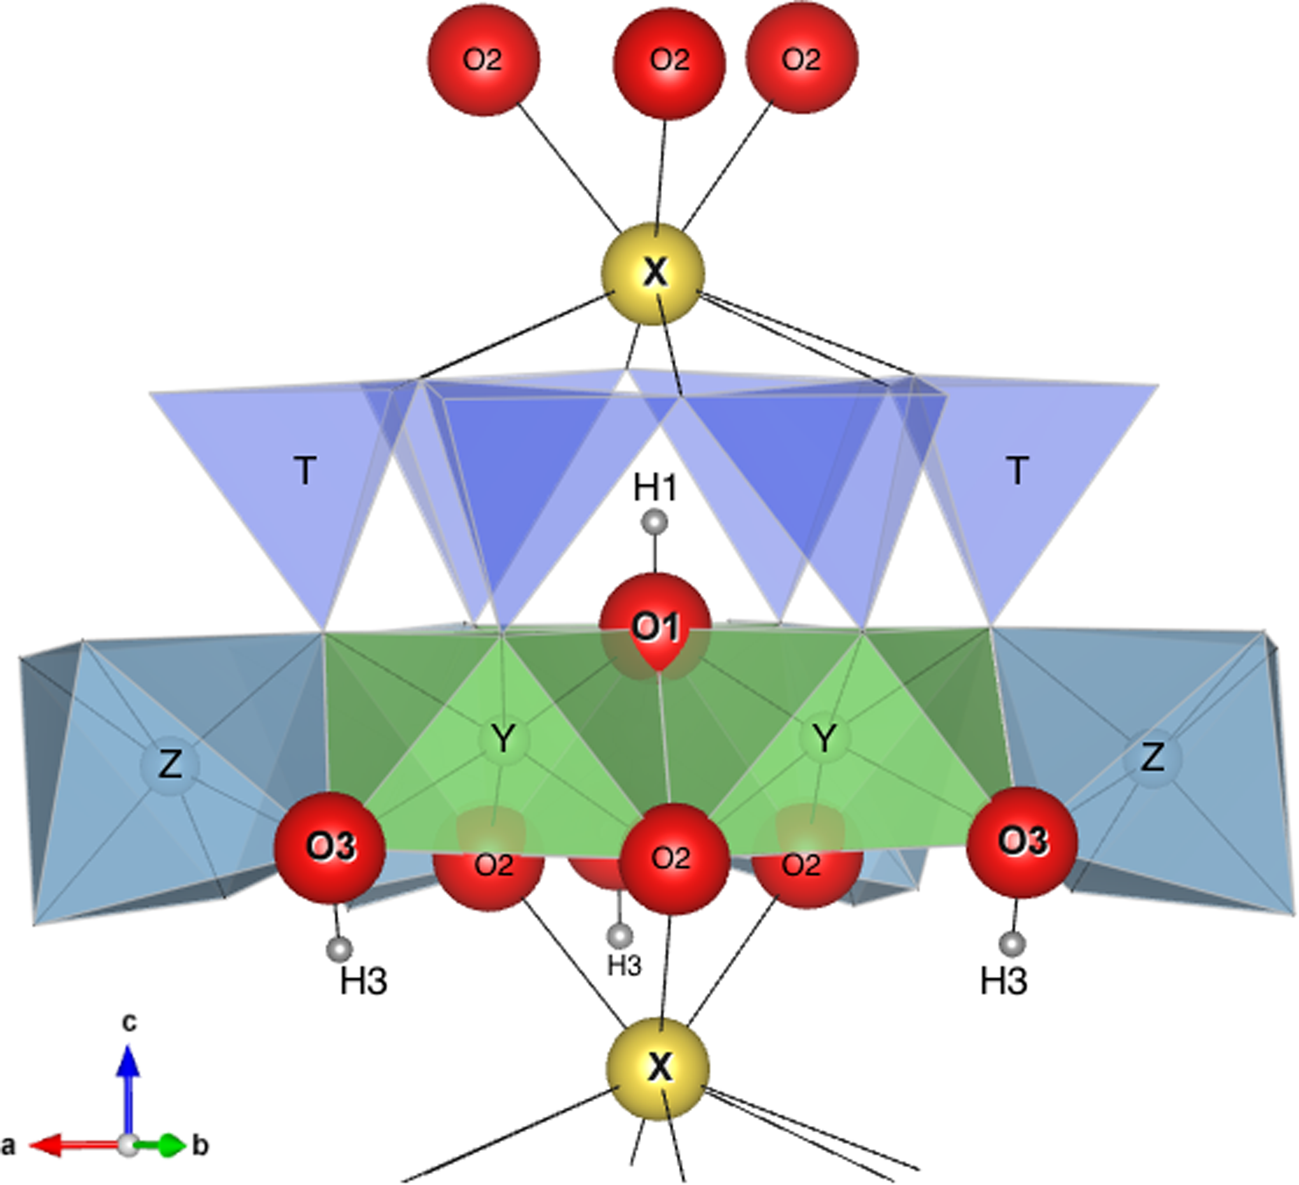
Fig. 10. Simplified structure of tourmaline showing the relative positions of H1, H3, O1, O3 and X with respect to Y, Z and the ring of tetrahedra TO4. Of particular interest is the strong interaction between X and H1 (distance ≈2.21 Å) and the very weak interaction between X and H3 (distance ≈3.65 Å).
Optical spectra
With the exception of the broad absorption band at ~9500 cm–1, the characteristics (band energy, band width and polarisation) of all observed bands in the spectra of the present sample are in very good agreement with those recorded for Mn3+-bearing tourmaline specimens (Reinitz and Rossman, Reference Reinitz and Rossman1988; Ertl et al., Reference Ertl, Rossman, Hughes, Prowatke and Ludwig2005; Novák et al., Reference Novák, Ertl, Povondra, Vašinová Galiová, Rossman, Pristacz, Prem, Giester, Gadas and Škoda2013; Bosi et al., Reference Bosi, Cámara, Ciriotti, Hålenius, Reznitskii and Stagno2017a). In agreement with these previously published studies we assign bands at 21,950, 19,800, ~18,000, 13,500 cm–1 to electronic transitions in octahedrally coordinated Mn3+ and the very weak and sharp band at 24,330 cm–1 to an electronic transition in octahedrally coordinated Mn2+. The set of strongly E||c-polarised, sharp bands in the NIR region between 6700–7200 cm–1 are due to overtones of the fundamental (OH)-stretching modes.
Based on the intensity of the Mn3+ band at ~18,000 cm–1 in the spectrum perpendicular to the c-axes (Fig. 6) in combination with the published molar absorption coefficient for that absorption band (Reinitz and Rossman, Reference Reinitz and Rossman1988), we calculate an Mn2O3 content of ~1 wt.%. However, the strong intensity increase by a factor of ~4× for this band in spectra of our heat-treated sample, in combination with the analysed MnOtot content, strongly suggests that the absorption coefficient for the band is somewhat higher than that indicated by Reinitz and Rossman (Reference Reinitz and Rossman1988). Assuming that all Mn2+ was oxidised to Mn3+ during the heat treatment of our sample we determine an absorption coefficient of ~30 l mole–1cm–1, compared to the value of ~7.5 suggested by Reintitz and Rossman (Reference Reinitz and Rossman1988). Based on this revised absorption coefficient we calculate a Mn2O3 content of ~0.2 wt.% for the untreated sample.
In view of the limited set of transition metals (Mn, Fe and Ti) in the present tourmaline, the number of potential origins for the broad absorption band recorded at ~9500 cm–1 is very limited as well. The broadness of this band and its relatively high intensity exclude that it is caused by electron transitions in Mn2+ or Fe3+, which all give rise to much weaker and also sharper spin-forbidden absorption bands. Furthermore, redox potential arguments exclude the presence of Fe2+ in a Mn3+-bearing substance. Finally, Ti4+ is not a chromophore and Ti3+ is also excluded on the basis of redox potential considerations. Consequently, there remain only transitions in Mn3+ as a cause for the ~9500 cm–1 band. This assignment is in agreement with observations of a broad Mn3+-related absorption band at ~1040 nm (corresponding to ~9615 cm–1) in optical spectra of oxidised Mn2+-rich elbaite (Ertl et al., Reference Ertl, Kolitsch, Dyar, Hughes, Rossman, Pieczka, Henry, Pezzotta, Prowatke, Lengauer, Körner, Brandstätter, Francis, Prem and Tillmanns2012). It is also in agreement with the observed increase in band intensity on heat treatment (oxidation) of the present sample. The relatively low energy of this band offers two main alternative assignment schemes. Firstly, low-energy bands caused by transitions in Mn3+ are frequently observed in spectra of substances, in which the cation is at the centre of octahedra that are characterised by one or two metal–ligand bonds deviating strongly from the remaining ones, either by being considerably shorter or longer (Burns, Reference Burns1993). Secondly, transitions in tetrahedrally coordinated [4]Mn3+ may also give rise to spectral bands of relatively low energy, as shown by a broad absorption band at 10,800 cm–1 in spectra of [4]Mn3+-doped spinel (Bosi et al., Reference Bosi, Hålenius, Andreozzi, Skogby and Lucchesi2007). The observed intensity increase for the ~9500 cm–1 band in response to heat treatment, i.e. oxidation, represents a strong argument against this second suggestion, as this would require Mn2+ to be located initially at the tetrahedrally coordinated sites of tourmaline, which is highly unlikely (Bačík and Fridrichová, Reference Bačík and Fridrichová2020). Furthermore, the SREF results provides no indications for [4]Mn3+ and consequently we prefer the suggestion that the band is caused by a transition in Mn3+ cations at octahedrally coordinated sites, where the local electronic field around the cation is strongly distorted from the Oh symmetry.
Conclusions
The comprehensive multi-analytical approach of the present study shows that the gem-quality purplish-red colour of the hand specimen of elbaite from the Anjanabonoina pegmatite (Madagascar) is caused by Mn3+, which occurs as a minor element (Mn2O3 = 0.20 wt.%, corresponding to 0.02 apfu). The colour intensity strongly increases with increasing Mn3+ concentrations (Mn2O3 up to 1.21 wt.%, corresponding to 0.15 apfu).
Although the bulk chemical composition of the present sample corresponds to elbaite, based on the electrostatic H+–Na+ repulsion, the more intense FTIR bands related to O1 could be ascribed to the rossmanite-type arrangements (YYY)–O1(OH)–X(□) rather than elbaite-type ones (YYY)–O1(OH)–X(Na).
Following this model of the electrostatic interaction between the X cation and W anions, the substitution F– → (OH)– as well as the removal of H from the W(OH) group would favour the occurrence of fluor-liddicoatite- and darrellhenryite-type clusters. On the other hand, the presence of H in the W(OH) group could explain the absence or rarity of tourmalines such as ‘liddicoatite’, ideally Ca(Li2Al)Al6Si6O18(BO3)3(OH)3OH. The latter is still, in fact, a missing mineral species. Similar arguments might be applied to uvite, CaMg3Al6Si6O18(BO3)3(OH)3OH (Bosi et al., Reference Bosi, Biagioni, Pezzotta, Skobgy, Hålenius, Cempírek, Hawthorne, Lussier, Abdu, Day, Fayek, Clark, Grice and Henry2020), but in this case we have to consider the increased total charge at the Y site of uvite (+6) compared to ‘liddicoatite’ (+5), which may accommodate composition with a strong H+–Ca2+ repulsive effect. In this regard, Ertl and Bačík (Reference Ertl and Bacík2020) described the correlations between the F content and the X-site charge, whereas Henry and Dutrow (Reference Henry and Dutrow2011) showed: (1) that interaction among the X, Y and O1 sites can accommodate unfavourable compositions; (2) the latter may also be influenced by the petrological environment, which may yield deviation from the limitations imposed by the tourmaline crystal chemistry. Bosi et al. (Reference Bosi, Reznitskii, Hålenius and Skogby2017b) showed that direct correlation between F and Cr observed in Cr tourmalines from the Sludyanka complex, Lake Baikal, Russia, requires the occurrence of the local arrangements Y(CrCrCr)–O1(F), which should be unstable from a short-range bond-valence perspective (e.g. Bosi, Reference Bosi2013, Reference Bosi2018).
Supplementary material
To view supplementary material for this article, please visit https://doi.org/10.1180/mgm.2021.20
Acknowledgements
Chemical analyses were completed with the kind assistance of M. Serracino, to whom the authors express their gratitude. Funding by Sapienza University of Rome (Prog. Università 2018 to F. Bosi) is gratefully acknowledged. We thank F. Pezzotta for providing the photo of the sample analysed in this study. Comments and suggestions by the Associate Editor Ian T. Graham, A. Ertl and two anonymous reviewers were much appreciated.


 Open access