Introduction
The SiO2 system is very complex. Though it has a simple chemical formula, SiO2, at least 15 modifications or polymorphs are known, i.e. mineral phases with the same stoichiometric composition but different crystal structures. Quartz is the most important silica polymorph in nature, and occurs as a common constituent of magmatic, metamorphic and sedimentary rocks. In addition, quartz represents an economically important silica raw material. Both single crystals and polycrystalline quartz material are used in industry, for example, as high-purity quartz crystals or sands, refractory materials, or as an ore for silicon metal. For certain highly advanced applications, synthetic quartz crystals or SiO2 materials are necessary due to increasing quality requirements not being easily met by silica raw materials (Götze and Möckel, Reference Götze and Möckel2012; Müller et al., Reference Müller, Wanvik, Ihlen, Götze and Möckel2012, Reference Müller, Ihlen, Snook, Larsen, Flem, Bingen and Williamson2015).
The growing worldwide consumption of a wide range of high-technology applications means there is an increasing demand for high-quality natural quartz raw materials. Such high-purity quartz is defined as quartz containing less than 50 ppm of impurity elements, specifically < 30 ppm Al, < 10 ppm Ti, < 8 ppm Na and K, < 5 ppm Li and Ca, < 3 ppm Fe, < 2 ppm P and < 1 ppm B (Harben, Reference Harben2002; Müller et al., Reference Müller, Wanvik, Ihlen, Götze and Möckel2012). The type of impurities controlling the quality of high-purity quartz strongly influences the processing and potential use of the raw materials. Therefore, exploration for high-purity quartz deposits requires a thorough knowledge of the factors influencing the petrological and chemical properties of quartz. Several studies have shown that granitic pegmatites provide potentially the best sources of high-purity quartz (Larsen, Reference Larsen, Polvé and Juve2000; Müller et al., Reference Müller, Ihlen and Wanvik2007, Reference Müller, Wanvik, Ihlen, Götze and Möckel2012, Reference Müller, Ihlen, Snook, Larsen, Flem, Bingen and Williamson2015).
The mineralogy and mineral chemistry of quartz are determined mainly by its defect structure. Certain point defects, dislocations, planar defects and micro-inclusions of fluids/melts and minerals can be incorporated into quartz during crystallisation under diverse thermodynamic conditions and by secondary processes, such as alteration, irradiation, diagenesis or metamorphism (Götze, Reference Götze2009). The resulting real structure is not only a fingerprint of the specific physicochemical environment of quartz formation and secondary processes, but also determines the quality of SiO2 raw materials. Therefore, quartz represents an important industrial raw material, and also serves as an important mineralogical and geochemical indicator for geological and ore-forming processes (e.g. Götze and Möckel, Reference Götze and Möckel2012 and references therein).
Quartz is one of the purest minerals, nevertheless minor impurities and defects have potentially significant importance and information, particularly regarding the mineral genesis. However, the detection and characterisation of such defects is generally a technical challenge and can only be successfully accomplished by a combination of advanced analytical methods, such as electron paramagnetic resonance (EPR) spectroscopy, cathodoluminescence (CL) microscopy and spectroscopy, synchrotron X-ray absorption spectroscopy (XAS) together with spatially resolved trace-element analysis such as laser ablation inductively coupled plasma mass spectrometry (LA-ICP-MS) and secondary-ion mass spectrometry (SIMS). Trace-element analysis provides general information about the types of impurities in quartz and their quantitative abundance. Information about the homogeneity or heterogeneity of quartz grains/crystals and the possible spatial distribution of defects can be obtained from CL measurements. Finally, EPR and XAS measurements yield additional information about the structural incorporation of trace elements and other structural defects not related to impurities, and are increasingly complemented by theoretical data from first-principles calculations. In addition, other spectroscopic techniques such as synchrotron XAS and Mössbauer spectroscopy, which have lower sensitivities than EPR techniques, have contributed useful information about the structural states of iron in quartz. In many cases, microscopic techniques (polarising microscopy, scanning electron microscopy (SEM), transmission electron microscopy (TEM), micro-Raman spectroscopy, or microbeam synchrotron X-ray fluorescence and XAS can complement the investigations.
This paper presents a review of the state-of-the-art knowledge concerning the mineralogy and mineral chemistry of quartz and the importance for better understanding of certain geological processes, together with improvements in technical processing of silica raw materials.
The mineralogy of quartz
Quartz is a mineral with the chemical formula SiO2, which exists in two modifications in nature. The most common and most important modification is trigonal, low-temperature alpha-quartz, which is stable under surface conditions. At atmospheric pressure, alpha-quartz transforms at ca. 573°C into hexagonal, high-temperature beta-quartz. This transformation is reversible and is accompanied by a change of the density from 2.65 to 2.51 g/cm3. The process also occurs, vice versa, during crystallisation from a melt or high-grade metamorphism during which the hexagonal high-temperature beta-quartz forms and subsequently transforms during cooling into the trigonal low-temperature modification. The structural changes during this transformation typically result in the formation of defects or twinning (Blankenburg et al., Reference Blankenburg, Götze and Schulz1994).
The crystal structure of alpha-quartz consists of a three-dimensional network of [SiO4]4–-tetrahedra, which are all linked via the oxygen atoms and are arranged in helical chains along the c-axis forming structural channels (Fig. 1). The left-handed or right-handed helices in the quartz structure correspond to morphologically right and left crystals, respectively (Donnay and Le Page, Reference Donnay and Le Page1978; Glazer, Reference Glazer2018), which can be distinguished by the relative position of the trapezohedron face x to the positive main rhombohedron face r. The c-axis in the trigonal symmetry is identical with the optical axis and results in the optical uniaxial character of alpha-quartz. The silicon atom in the quartz structure resides on a two-fold axis, whereas all oxygen atoms are at general positions (Le Page et al., Reference Le Page, Calvert and Gabe1980; Kihara, Reference Kihara1990; Baur, Reference Baur2009). Each SiO4 tetrahedron has two long and two short Si–O bonds at 1.613(2) Å and 1.603(2) Å, respectively, in quartz measured at 291 K and ambient pressure (Baur, Reference Baur2009). Le Page et al. (Reference Le Page, Calvert and Gabe1980) noted that the two Si–O bond distances are 1.611(1) Å and 1.606(1) Å at 94 K, and they do not change in the temperature range from 94 K to 298 K, however the Si–O–Si angle increases from 142.69(4)° to 143.65(5)°. In the EPR literature, the SiO4 tetrahedron in the quartz structure is typically represented by the notation [SiO4]0 to emphasise its overall neutrality, whereas substitutional groups such as [GeO4]0 and [AlO4]–, together with their associated paramagnetic centres [GeO4]– and [AlO4]0 are denoted accordingly (Weil, Reference Weil1984; Mashkovtsev and Pan, Reference Mashkovtsev, Pan, Novak and Marek2013; Alessi et al., Reference Alessi, Agnello, Buscarino, Pan, Mashkovtsev, Lund and Shiotani2014).
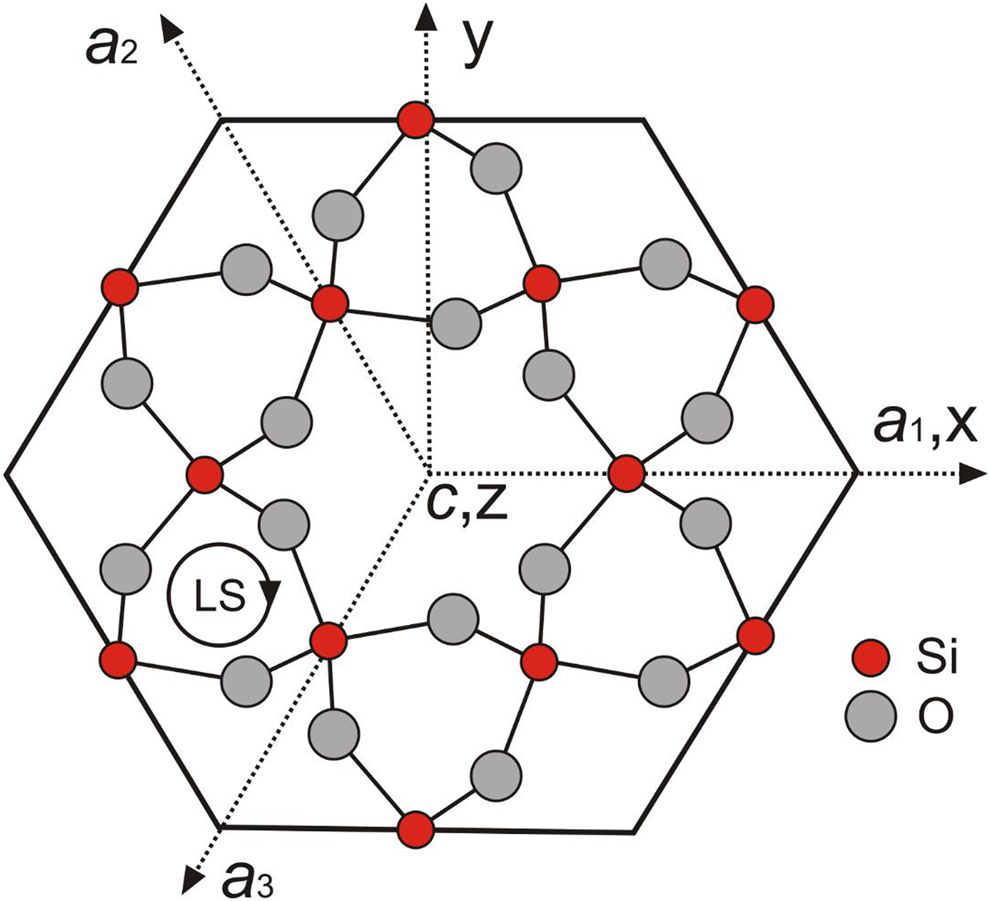
Fig. 1. Projection of morphologically right-handed α-quartz atomic positions onto the (0001) plane perpendicular to the c-axis, showing the EPR coordinate system (xyz), crystallographic axes a1, a2 and a3, and z∥c; the central c-axis large channel is seen to be surrounded by six c-axis small channels; LS denotes left-handed helices.
Several chemical and physical properties of quartz such as trace element and isotopic composition, luminescence behaviour, micro-inclusion inventory or colour are strongly dependent on the specific P–T–x conditions of its formation. These varying properties result in the development of numerous varieties, i.e. colour varieties such as amethyst, smoky quartz and rose quartz, or certain growth phenomena such as fibre and sceptre quartz, or microcrystalline quartz varieties such as chalcedony and quartzine (Rykart, 1995; Blankenburg et al., Reference Blankenburg, Götze and Schulz1994; Götze, Reference Götze2009).
Point defects in quartz
Zero-dimensional point defects in quartz can be related to the incorporation of foreign ions in lattice sites and interstitial positions, to different types of displaced atoms, and/or to defects associated with silicon or oxygen vacancies (e.g. Weil, Reference Weil1984, Reference Weil, Helms and Deal1993; Stevens Kalceff, Reference Stevens-Kalceff2009; Nilges et al., Reference Nilges, Pan and Mashkovtsev2008, Reference Nilges, Pan and Mashkovtsev2009; Pan et al., Reference Pan, Nilges and Mashkovtsev2009; Mashkovtsev and Pan, Reference Mashkovtsev and Pan2012a, Reference Mashkovtsev and Pan2012b; Mashkovtsev et al., Reference Mashkovtsev, Pan, Novak and Marek2013a; Alessi et al., Reference Alessi, Agnello, Buscarino, Pan, Mashkovtsev, Lund and Shiotani2014; Mashkovtsev and Pan, Reference Mashkovtsev and Pan2014). The latter represent pure lattice defects and can be generated without the incorporation of impurity ions into the quartz lattice. Point defects can serve as the starting locations for more extended defects such as dislocations or planar defects (McLaren et al., Reference McLaren, Cook, Hyde and Tobin1983, Reference McLaren, Fitz Gerald and Gerretsen1989; Lin et al., Reference Lin, Payne, Heine and McConnell1994; McConnell et al., Reference McConnell, Lin and Heine1995).
According to their electronic structure, point defects can be classified into diamagnetic and paramagnetic types and investigations are mainly recognised using EPR spectroscopy in combination with other spectroscopic methods (e.g. luminescence spectroscopy, UV-Vis-IR absorption spectroscopy, synchrotron XAS, Mössbauer spectroscopy) and trace-element analysis. Most of the paramagnetic centres in quartz are metastable, i.e. they are sensitive to irradiation and temperature treatment. However, some stable centres have also been detected, which can be formed by the incorporation of paramagnetic ions such as H+/0, Ag2+/0, Li0, Cu2+/0 or Ni+, mainly in interstitial positions (Laman and Weil, Reference Laman and Weil1977; Davis and Weil, Reference Davis and Weil1978; Isoya et al., Reference Isoya, Weil and Davis1983; Weil, Reference Weil, Helms and Deal1993). Even these paramagnetic ions in quartz are mostly not intrinsic and are either incorporated by electron diffusion or converted from diamagnetic precursors via irradiation. Indeed, most point defects in quartz are diamagnetic, but can be converted to paramagnetic ones recognisable by EPR analysis, by various physical and chemical treatments (e.g. natural and artificial irradiation; Weil, Reference Weil1984; Pan and Nilges, Reference Pan, Nilges, Henderson, Neuville and Downs2014).
The EPR techniques, with superior sensitivity unmatched by any other structural methods, have identified a large number of paramagnetic defects (and their diamagnetic precursors) in quartz (Supplementary Tables S1 and S2, see details below). In particular, the common detection and analysis of diagnostic hyperfine or superhyperfine structures of paramagnetic defects, which arise from interactions with non-zero-spin nuclei, not only aid in their unambiguous identification, but also typically provide definitive information about their geometric and electronic configurations. For example, 29Si hyperfine structures, which is the only stable isotope of silicon with a non-zero nuclear spin (I = 1/2) and a natural isotope abundance of 4.7%, are often detected by EPR. However, analysis of 17O hyperfine structures, which is the only stable isotope of oxygen with a non-zero nuclear spin (I = 5/2) and an exceedingly low abundance of 0.04%, generally requires artificially 17O-enriched quartz samples (McEachern and Weil, Reference McEachern and Weil1994; Mashkovtsev et al., Reference Mashkovtsev, Li, Mao and Pan2013).
Aluminium
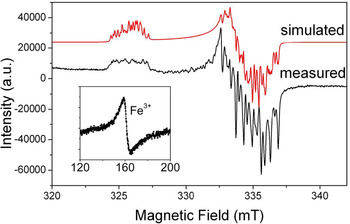
Aluminium is the prevailing impurity in quartz. The [AlO4]0 centre (Fig. 2) was first described in smoky quartz by Griffiths et al. (Reference Griffiths, Owen and Ward1954). This paramagnetic centre is the most common trace-element defect in quartz, which is caused by substitution of Si4+ by Al3+ with an electron hole localised at one of the four nearest O2– ions. The precursor state for this paramagnetic centre is the diamagnetic [AlO4/M+]0 defect with an adjacent charge compensating cation (M+ = H+, Li+, Na+) at an interstitial position in the c-axis channel (Botis et al., Reference Botis and Pan2009). These diamagnetic defects have been confirmed by the low-temperature EPR characterisation of the paramagnetic [AlO4/M+]+ centres in quartz irradiated and measured at 77 K (Table S1; Mackey, Reference Mackey1963; Mackey et al., Reference Mackey, Boss and Wood1970; Nuttall et al., Reference Nuttall and Weil1981a,Reference Nuttall and Weilb; Dickson and Weil, Reference Dickson and Weil1990; Walsby et al., Reference Walsby, Less, Claridge and Weil2003; Botis and Pan, Reference Botis and Pan2009, Reference Botis and Pan2011). The paramagnetic [AlO4/M+]+ centres are known to convert to the [AlO4]0 centre upon warming to room temperature (Cohen, Reference Cohen1956; Nuttall and Weil, Reference Nuttall and Weil1981a; Walsby et al., Reference Walsby, Less, Claridge and Weil2003). The optically active [AlO4]0 centre is responsible for the colour of smoky quartz (O'Brien, Reference O'Brien1955; Meyer et al., Reference Meyer, Lohse, Spaeth and Weil1984). Nuttall and Weil (Reference Nuttall and Weil1981c) also reported the triplet-state (S = 1) centre [AlO4]+ in quartz measured at ~35 K after X-ray irradiation at 77 K (Table S1), which contains two electron holes, one at each of two symmetry-related oxygen atoms bonded to an aluminium substituting for silicon and apparently formed from the diamagnetic [AlO4/M+]0 precursors as well.
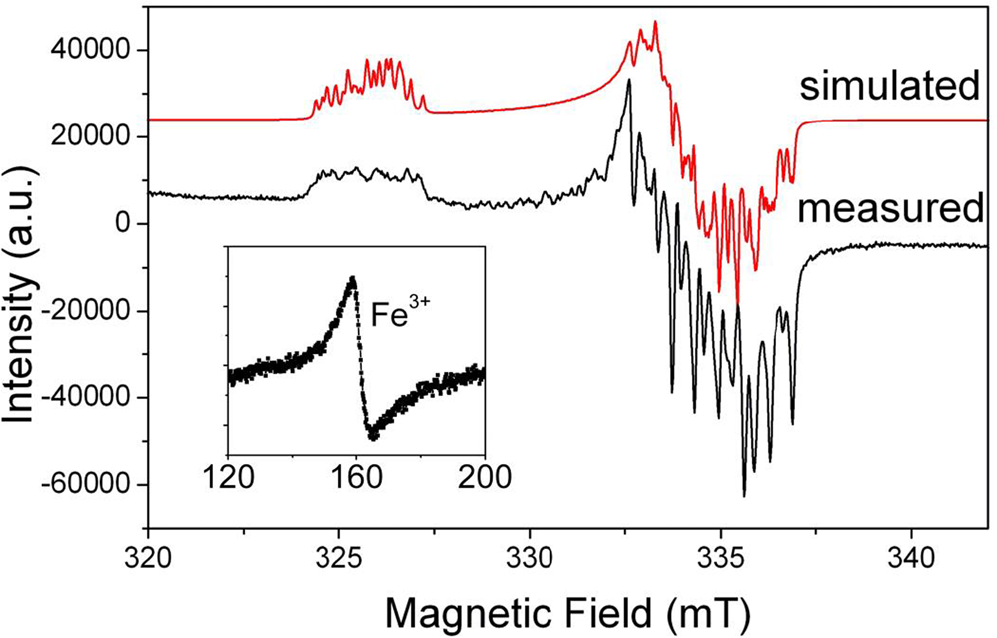
Fig. 2. Representative powder EPR spectrum of a high-purity quartz from Kyshtym (Russia) containing 4.2 ppm Al (Götze et al., Reference Götze, Pan, Müller, Kotova and Cerin2017) measured at a microwave frequency (ν) of ~9.39 GHz and temperature of 85 K, showing the [AlO4]0 centre. Also shown for comparison is the simulated spectrum of this centre using spin Hamiltonian parameters from Walsby et al. (Reference Walsby, Less, Claridge and Weil2003). Insert is a room-temperature spectrum of the same sample containing <0.41 ppm Fe (i.e. the detection limit of LA-ICP-MS), showing a rhombic Fe3+ centre at the effective g = ~4.28.
Gemanium
Although the abundance of germanium in nature is low, the isovalent substitution of Ge4+ for Si4+ is common. The resulting diamagnetic [GeO4]0 defect in quartz can be transformed by ionising radiation at <100 K into two paramagnetic [GeO4]– centres (Table S1), which are distinguished by the orbital of the unpaired spin lying along the different O–Ge–O bisectors of the GeO4 tetrahedron (Mackey, Reference Mackey1963; Isoya et al., Reference Isoya, Weil and Claridge1978; McEachern et al., Reference McEachern, Weil and Sawyer1992; McEachern and Weil, Reference McEachern and Weil1994). On warming above 150 K or irradiation at room temperature, the [GeO4]– centres can capture M+ ions (Li+, Na+ and Ag+) released from associated [AlO4/M+]0 centres and form the [GeO4/M+]0 centres (Table S1; Mackey, Reference Mackey1963; Weil, Reference Weil1971; Weil, Reference Weil1984; Rakov et al., Reference Rakov, Milovidova, Kuvshinova and Moiseev1985; Dickson et al., Reference Dickson, Weil and Davis1991; McEachern et al., Reference McEachern, Weil and Sawyer1992; McEachern and Weil, Reference McEachern and Weil1994; Claridge et al., Reference Claridge, Kryliouk, Weil and Williams2008).
In addition, multiply-compensated germanium electron centres such as [GeHLi2] and [GeH–H1+H2+] have been reported. They are interpreted to derive from the diamagnetic [GeO4/M1M2] precursors, containing a divalent Ge2+ ion and two monovalent charge compensators (M = Li+, H+, Na+), by capturing a paramagnetic atomic hydrogen during irradiation (Weil, Reference Weil1971; Laman and Weil, Reference Laman and Weil1978; Weil, Reference Weil1984).
Iron
Iron can be incorporated into quartz in three different valence states (Fe2+, Fe3+ and Fe4+; Cox, Reference Cox1976, Reference Cox1977; Cohen, Reference Cohen1985; Cressey et al., Reference Cressey, Henderson and Van der Laan1993; Weil, Reference Weil1994; Schofield et al., Reference Schofield, Henderson, Cressey and Van der Laan1995; Dedushenko et al., Reference Dedushenko, Makhina, Marin, Mukhanov and Perfiliev2004; Di Benedetto et al., Reference Di Benedetto, D'Acapito, Fornaciai, Montegrossi, Pardi, Tesi and Romanelli2009; SivaRamaiah et al., Reference SivaRamaiah, Lin and Pan2011; SivaRamaiah and Pan, Reference SivaRamaiah and Pan2012), in addition colloidal clusters of metallic iron have also been reported to occur in quartz (Daniels and Morton, Reference Daniels and Morton1981; SivaRamaiah and Pan, Reference SivaRamaiah and Pan2012). EPR studies have established at least six distinct Fe3+ centres substituting for Si, as either the charge uncompensated [FeO4]– centre or charge-compensated [FeO4/M+]0 centres (M+ = Li+, H+, Na+, Table S1; Scala and Hutton, Reference Scala and Hutton1976; Mombourqette et al., Reference Mombourqette, Tennant and Weil1986, Reference Mombourqette, Minge, Hantehzadeh, Weil and Halliburton1989; Halliburton et al., Reference Halliburton, Hantehzadeh, Minge, Mombourquette and Weil1989; Minge et al., Reference Minge, Weil and McGavin1989, Reference Minge, Mombourquette and Weil1990; Weil, Reference Weil1984, Reference Weil1994). The larger ionic radius of Fe3+ (0.64 Å) compared to Si4+ (0.42 Å), means that the tetrahedra will be distorted. Therefore, the structural incorporation of Fe3+ is only possible in marginal parts of the quartz crystals or in fissures (Götze and Plötze, Reference Götze and Plötze1997). Higher amounts of iron can cause lattice defects promoting the formation of highly disordered areas such as in the case of amethyst (Mineeva et al., Reference Mineeva, Bershov and Petrov1991).
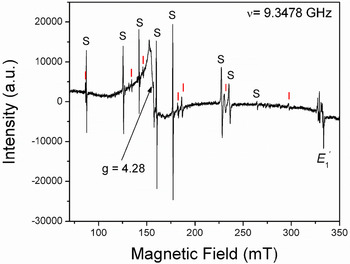
The [FeO4/M+]0 centres can be converted to the [FeO4]– centre by irradiation (Hutton and Troup, Reference Hutton and Troup1966; Stegger and Lehmann, Reference Stegger and Lehmann1989). This process also results in the conversion of Fe3+ to Fe4+ accompanied by the formation of the typical amethyst colour (Fig. 3; Lehmann and Moore, Reference Lehmann and Moore1966; Stegger and Lehmann, Reference Stegger and Lehmann1989; Dedushenko et al., Reference Dedushenko, Makhina, Marin, Mukhanov and Perfiliev2004; Di Benedetto et al., Reference Di Benedetto, D'Acapito, Fornaciai, Montegrossi, Pardi, Tesi and Romanelli2009). However, details concerning the Fe4+ site and its local environment have not been determined unequivocally (Cox, Reference Cox1976, Reference Cox1977; Dedushenko et al., Reference Dedushenko, Makhina, Marin, Mukhanov and Perfiliev2004; Di Benedetto et al., Reference Di Benedetto, D'Acapito, Fornaciai, Montegrossi, Pardi, Tesi and Romanelli2009). Similarily, very little is known about the local structural environment of Fe2+ in quartz (Cressey et al., Reference Cressey, Henderson and Van der Laan1993; Schofield et al., Reference Schofield, Henderson, Cressey and Van der Laan1995; Di Benedetto et al., Reference Di Benedetto, D'Acapito, Fornaciai, Montegrossi, Pardi, Tesi and Romanelli2009), because the magnetic properties of Fe2+ with oxygen neighbours preclude its EPR observation at conventional X-band frequencies (Weil, Reference Weil1994).

Fig. 3. Representative single-crystal EPR spectrum of a natural amethyst measured with B∥y and at 294 K. Letters S and I mark lines belonging to the S1 ([FeO4/Li]0; Han and Choh, Reference Han and Choh1989; Halliburton et al., Reference Halliburton, Hantehzadeh, Minge, Mombourquette and Weil1989) and I centres, respectively. Note that the so-called interstitial (I) centre is actually [FeO4]– with substitutional Fe ions at the Si sites (Mombouquette et al., 1986). Also present are the broad signal at g = 4.28 and the E′1 centre (modified from SivaRamaiah et al., Reference SivaRamaiah, Lin and Pan2011).
Titanium
Titanium is a typical trace impurity in quartz and isovalently substitutes as Ti4+ for Si4+ in the SiO4 tetrahedra. The Ti4+ in the diamagnetic [TiO4]0 centre can be transformed to the paramagnetic [TiO4]– centre during irradiation at low temperatures (Table S1; Bershov, Reference Bershov1970; Isoya and Weil, Reference Isoya and Weil1979; Weil, Reference Weil1984; Bailey et al., Reference Bailey, Pawlik, Sothe, Spaeth and Weil1992; Bailey and Weil, Reference Bailey and Weil1992a,Reference Bailey and Weilb). This [TiO4]– centre is unstable above 120 K and, similar to the [GeO4]– centres, can capture diffusing M+ ions (H+, Li+, Na+) to form charge compensated [TiO4/M+]0 centres (Table S1; Wright et al., Reference Wright, Weil, Buch and Anderson1963; Rinneberg and Weil, Reference Rinneberg and Weil1972; Weil, Reference Weil1984; Matyash et al., Reference Matyash, Brik, Zayats and Masykin1987; Isoya et al., Reference Isoya, Tennant and Weil1988; Bailey and Weil, Reference Bailey and Weil1991, Reference Bailey, Pawlik, Sothe, Spaeth and Weil1992).
There is an ongoing discussion about the role of substitutional Ti as an origin for the rose colour in quartz (Wright et al., Reference Wright, Weil, Buch and Anderson1963). Smith et al. (Reference Smith, Vance, Hasan, Edgar and Runciman1978) suggested that the colour originates from a charge transfer between substitutional Ti4+ and interstitial Fe2+. Investigations by Lehmann and Bambauer (Reference Lehmann and Bambauer1973) and Cohen and Makar (Reference Cohen and Makar1985) showed that additional Ti3+ at interstitial structural channel sites is responsible for the rose colouration. However, further studies have shown that nano-inclusions of dumortierite can also produce the colour in massive rose quartz (Goreva et al., Reference Goreva, Ma and Rossman2001; Ma et al., Reference Ma, Goreva and Rossman2002).
Phosphorus
Phosphorus as a trace element has been shown to substitute for Si4+ in the quartz structure as EPR has detected several radiation-induced [PO4]0 centres (Table S1). In particular, Mashmeyer and Lehmann (1983) reported the [O3AlO–PO3] centre with a hole trapped on the bridging oxygen atom between substitutional Al and P atoms in quartz, providing unambiguous evidence for the coupled substitution: P5+ + Al3+ = 2 Si4+. In addition, Maschmeyer and Lehmann (Reference Maschmeyer and Lehmann1983) suggested that the [O3AlO–PO3] centre is responsible for radiation-induced rose colouration of quartz.
The aforementioned examples illustrate that there typically exists a close relation between point defects and the different colours of quartz (Lehmann, Reference Lehmann1978; Rossman, Reference Rossman, Heaney, Prewitt and Gibbs1994). Although several allochromatic colours in quartz such as green, blue and red are caused by micro-inclusions of impurities (e.g. dickite, rutile, hematite, goethite, celadonite and dumortierite), idiochromatic colours are mainly generated by chromophores (Rossman, Reference Rossman, Heaney, Prewitt and Gibbs1994; Yang et al., Reference Yang, Mashkovtsev, Botis and Pan2007; Scholz et al., Reference Scholz, Chaves, Krambrock, Pinheiro, Barreto, De Menezes, Götze and Möckel2012). This group consists of ions of 3d elements (e.g. synthetic blue quartz: Co2+, green chrysoprase: Ni2+) or paramagnetic centres, which can be activated by irradiation (Lehmann, Reference Lehmann1978; Meyer et al., Reference Meyer, Lohse, Spaeth and Weil1984). However, the discussion concerning the origin of colours in quartz is very complex and partly controversial and will not be made here in detail. A thorough review about the origin of colours in quartz is given by Rossman (Reference Rossman, Heaney, Prewitt and Gibbs1994).
A number of point defects can be attributed to oxygen and silicon vacancies or oxygen excess. Oxygen-excess centres in quartz include the peroxy linkage (≡Si–O–O–Si≡) and the peroxy radical (≡Si–O–O), an oxygen associated hole centre consisting of an O2– ion bound to a single silicon on three oxygen atoms (Friebele et al., Reference Friebele, Griscom, Stapelbroek and Weeks1979). In addition, hydrogen excess from the H2O crystallisation medium can also result in the formation of OH– centres in quartz. This defect consists of a proton bound on a regular O2– ion of the SiO4 tetrahedron (Weil, Reference Weil1984, Reference Weil, Helms and Deal1993). In addition, the EPR detection of two H-trapped hole centres ([H4O4]+ and [H3O4]0) (Table S1) has been used to suggest the presence of the neutral diamagnetic precursor with four hydrogen atoms located at the tetrahedral Si site (i.e. the [H4O4]0 or hydrogarnet defect; Nuttall and Weil, Reference Nuttall and Weil1980; Lin et al., Reference Lin, Payne, Heine and McConnell1994; Lees et al., Reference Lees, Walsby, Williams, Weil and Claridge2003; Jollands et al., Reference Jollands, Blanchard and Balan2020). Similarly, the EPR detection of the [HLi2O4]0) centre in gamma-ray-irradiated quartz suggests the presence of analogous diamagnetic precursors [HLi3O4]0 or [H2Li2O4]0 (Table S1; Lees et al., Reference Lees, Walsby, Williams, Weil and Claridge2003).
The group of oxygen-vacancy electron centres
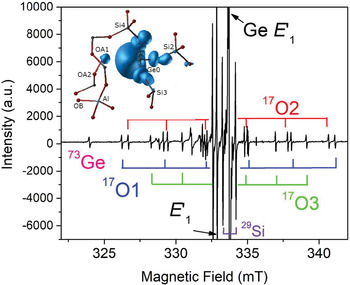
The group of oxygen-vacancy electron centres (OVEC) involves an oxygen vacancy (≡Si–Si≡) and can be divided into the E′ and E′′ types, denoting one and two unpaired electrons (S = 1/2 and 1), respectively (Table S2). The E′ (the •Si≡O moiety) centres are the most frequent defects in quartz apart from Al centres and can occur in different stages depending on thermal stability and sensibility to irradiation (Griscom, Reference Griscom1985). The most common E′1 centre can be formed by various irradiations involving alpha particles, electron beams, neutrons, gamma- and X-rays, and has been used as palaeo-dosimeters and geochronometers due to its high thermal stability (> 550°C) (Moiseev, Reference Moiseev1985; Toyoda, Reference Toyoda2011, Reference Toyoda2016). In addition, the E′1 centre in nature, induced by diverse radiation sources from U/Th-bearing rocks/fluids to potassic alteration, can be used as an indicator for the formation of uranium deposits when the dominant source of radiation is uranium (Pan et al., Reference Pan, Botis and Nokhrin2006; Botis et al., Reference Botis, Pan, Bonli, Xu, Zhang, Nokhrin and Sopuck2006, Reference Botis, Pan, Nokhrin and Nilges2008; Cerin et al., Reference Cerin, Götze and Pan2017). X-ray or fast-electron irradiation of Ge-doped quartz at room temperature yielded at least three Ge analogues of E′ centres, including the Ge E′1 centre stable up to 700 K, the Ge E′2 centre with a hydrogen impurity stable up to 500 K, and another Ge(IV) centre unstable at room temperature (Fig. 4; Feigl and Anderson, Reference Feigl and Anderson1970; Mashkovtsev et al., Reference Mashkovtsev, Li, Mao and Pan2013).

Fig. 4. Representative single-crystal EPR spectrum of an electron-irradiated, 17O-enriched quartz (JC324) measured, after annealing at 573 K, with B‖c, room temperature and X-band frequency (~9.3 GHz; modified from Mahskovtsev et al., 2013), showing three 17O hyperfine sextets and one 73Ge hyperfine line of the Ge E′1 centre. Insert shows the 3D spin density of the Ge E′1 centre calculated from the tri-vacancy with an Al impurity model.
Understanding of the E′1 and Ge E′1 centres in quartz has evolved with increasingly complete EPR data and sophisticated first-principles calculations (Fig. 4; Li and Pan, Reference Li, Pan, Götze and Möckel2012; Mashkovtsev et al., Reference Mashkovtsev, Li, Mao and Pan2013). The tri-vacancy model with an Al impurity, which best reproduces all available EPR data, involves the removal of one Si and two O atoms as well as the presence of a neighbouring Al impurity atom (Fig. 4; Li and Pan, Reference Li, Pan, Götze and Möckel2012; Mashkovtsev et al., Reference Mashkovtsev, Li, Mao and Pan2013). Other well-characterised E′ centres in quartz include the E′4 and E′11,16 centres (Table S2; Perlson and Weil, Reference Perlson and Weil2008; Mashkovtsev and Pan, Reference Mashkovtsev and Pan2012a, Reference Mashkovtsev and Pan2016, Reference Mashkovtsev and Pan2018; Mashkovtsev et al., Reference Mashkovtsev, Botis, Nilges and Pan2019). The former contains a proton near the oxygen vacancy, wheras the latter with diagnostic 27Al superhyperfine structures provide experimental proof for the hypothesis that Al impurity plays an important role in the formation of E′ centres (Jani et al., Reference Jani, Bossoli and Halliburton1983; Mashkovtsev and Pan, Reference Mashkovtsev and Pan2018; Mashkovtsev et al., Reference Mashkovtsev, Botis, Nilges and Pan2019). In addition, various E′′ centres arising from interactions between two neighbouring E′ centres have been discovered and characterised with the triplet-state model in recent years (Table S2; Mashkovtsev et al., Reference Mashkovtsev, Howarth and Weil2007; Mashkovtsev and Pan, Reference Mashkovtsev and Pan2011, Reference Mashkovtsev and Pan2012a, Reference Mashkovtsev and Pan2012b, Reference Mashkovtsev and Pan2014).
A family of silicon-vacancy hole centres is represented by different localisations of the unpaired electron on one, two or three oxygen atoms of the tetrahedra with silicon vacancies, which have been denoted as the O–, O2–, O23– or O3– type radicals (Fig. 5; Table S2; Mashkovtsev et al., Reference Mashkovtsev, Shcherbakova and Solntsev1978; Botis et al., Reference Botis, Nokhrin, Pan, Xu and Bonli2005; Nilges et al., Reference Nilges, Pan and Mashkovtsev2008, Reference Nilges, Pan and Mashkovtsev2009; Pan et al., Reference Pan, Nilges and Mashkovtsev2008, Reference Pan, Nilges and Mashkovtsev2009; Mashkovtsev and Pan, Reference Mashkovtsev, Pan, Novak and Marek2013; Alessi et al., Reference Alessi, Agnello, Buscarino, Pan, Mashkovtsev, Lund and Shiotani2014). By analogy to the notation for oxygen-vacancy electron centres, Mashkovtsev and Pan (Reference Mashkovtsev, Pan, Novak and Marek2013) relabelled the silicon-vacancy hole centres as H′1 to H′7 (Table S2). The O– centres with a hole trapped in a single nonbonding 2p orbital (i.e. the non-bridging oxygen hole centres or NBOHC; ≡Si–O) are very common defects in almost all quartz types, which can be detected by CL spectroscopy (Stevens Kalceff, Reference Stevens-Kalceff2009). However, the majority of the O– centres in quartz are those associated with impurity ions such as Al3+ described above (Table S1) and are not linked with any silicon vacancy.
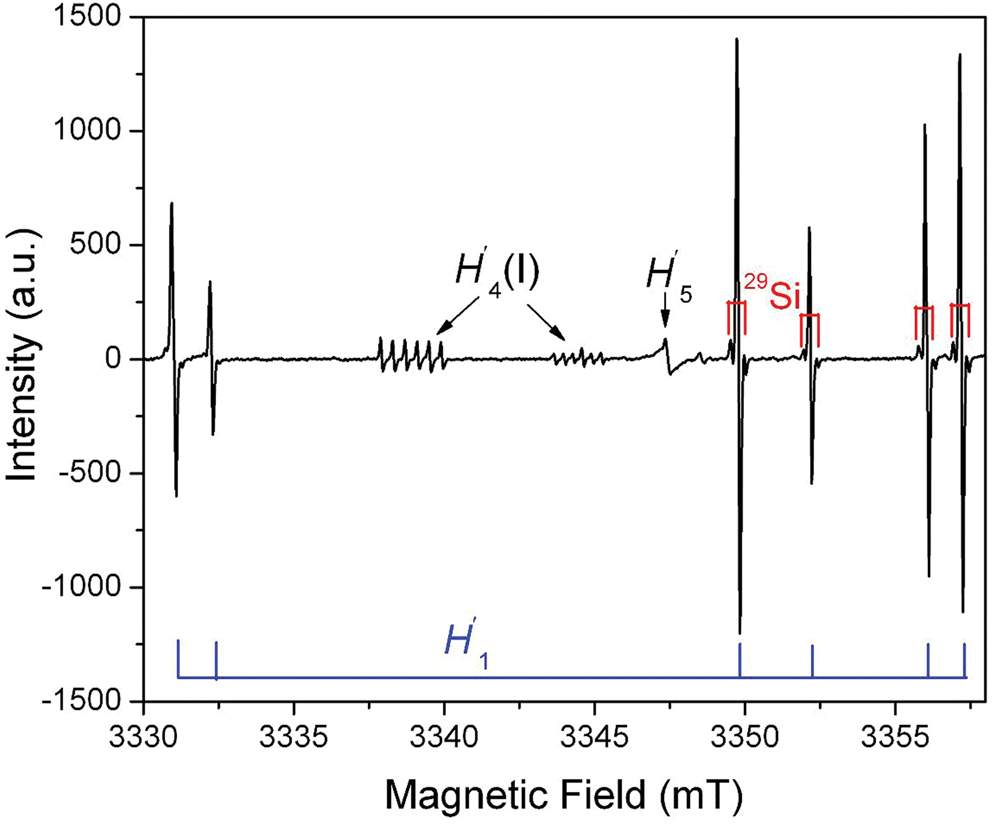
Fig. 5. Representative single-crystal EPR spectrum of an electron-irradiated quartz measured at W-band frequency (~94 GHz), B^c = ~140°, T = 110 K and a microwave power of 0.2 mW, illustrating three silicon-vacancy hole centres (H′1, H′4(I) and H′5) (modified from Nilges et al., Reference Nilges, Pan and Mashkovtsev2009). Note that the H′1 (alias #1) centre has six main lines corresponding to six magnetically inequivalent sites and that 29Si hyperfine satellites are marked on four main lines. Also note that the two remaining main lines at ~3330 mT have irregular line shapes due to an incompletely resolved 27Al superhyperfine structure (Nilges et al., Reference Nilges, Pan and Mashkovtsev2009). The H′4(I) centre is characterised by a well-resolved 27Al superhyperfine structure.
Several studies showed that defects associated with oxygen and silicon vacancies are most frequent in quartz crystallised at relatively low temperature (< 250°C) from amorphous silica precursors due to rapid cooling (Götze et al., Reference Götze, Plötze, Fuchs and Habermann1999, Reference Götze, Gaft and Möckel2015a, Reference Götze, Möckel and Pan2020). Therefore, these defects are common in microcrystalline quartz (agate, chalcedony) and in some hydrothermal quartz formed with high growth rates. In contrast, pegmatite quartz, in general, has a remarkably low abundance of defects associated with oxygen or silicon vacancies indicating growth of quartz from a parent melt/fluid under more or less constant physicochemical conditions (Götze et al., Reference Götze, Plötze, Graupner, Hallbauer and Bray2004, Reference Götze, Plötze and Trautmann2005).
Moreover, partial dissolution experiments demonstrated that the silicon-vacancy hole centres in detrital quartz from the Athabasca Basin (Canada) are concentrated preferentially along the grain margins. This observation is consistent with the limited penetration distances of alpha particles emitted from the decay of the uranium series present in palaeo-uranium-bearing fluids, providing the best linkage with mineralisation processes in uranium deposits (e.g. tracing the conduits of uranium-bearing fluids and constraining the sources of uranium; Pan et al., Reference Pan, Botis and Nokhrin2006; Hu et al., Reference Hu, Pan, Botis, Rogers, Kotzer and Yeo2008; Cerin et al., Reference Cerin, Götze and Pan2017).
In addition, abundant data exist on the health effects of quartz. This varies widely in emphasis from particle sizes/morphologies to surface properties and structural states. Long-term exposures to quartz and other silica forms (e.g. cristobalite and amorphous silica) are known to cause serious and potentially life-threatening diseases such as silicosis, fibrosis and lung cancer (Goldsmith, Reference Goldsmith, Heaney, Prewitt and Gibbs1994). Of particular interest are the identification of various defects such as the peroxy and superoxide radicals and NBOHC on the surfaces of, and in, bulk quartz and their effects on toxicity and carcinogenic activity (Fubini et al., Reference Fubini, Giamello, Volante and Bolis1990; Giordano et al., Reference Giordano, Sushko, Pacchioni and Shluger2007; Di Benedetto et al., Reference Di Benedetto, Giaccherini, Montegrossi, Pardi, Zoleo, Capolupo, Innocenti, Lepore, d'Acapito, Capacci, Poli, Iaia, Buccianti and Romanelli2019, Reference Di Benedetto, Giaccherini and Romanelli2021). For example, Fubini et al. (Reference Fubini, Giamello, Volante and Bolis1990) proposed the presence of these radicals on quartz surfaces or chemical functionalities as a possible mechanism for fibrogenecity via their reactions with macrophage oxygen metabolites, triggering the abnormal production of fibroblast stimulating factors and ultimately silicosis. However, a comprehensive synthesis of the voluminous literature on the health effects of quartz is beyond the scope of this review in which the emphasis is on geological contexts.
Cathodoluminescence properties of quartz
Cathodoluminescence (CL) is a powerful method, which enables the visualisation of the defect structure of minerals and reveals visually internal features caused by the varying spatial distribution of point defects that are not discernible by other analytical methods (Götze, Reference Götze2012a; Götze et al., Reference Götze, Hanchar, Schertl., Neuser and Kempe2013; Götze and Hanchar, Reference Götze and Hanchar2018). In general, quartz and other SiO2 modifications (including amorphous silica) show similar main luminescence emission bands. This is due to the fact that short-range order structural defects are caused mainly by silicon–oxygen and silicon–silicon interactions rather than by interactions between oxygen atoms (Walker, Reference Walker, Berry and Vaughan1985). However, the band positions of the CL emissions can vary depending on the specific structure of the SiO2 polymorph and experimental conditions (e.g. Walker, Reference Walker, Berry and Vaughan1985; Luff and Townsend, Reference Luff and Townsend1990; Remond et al., Reference Remond, Cesbron, Chapoulie, Ohnenstetter, Roques-Carmes and Schvoerer1992).
The CL emissions for quartz are mostly weak but variable and the relation of specific luminescence emission bands to different defect centres causes a diversity of CL characteristics and visible CL colours, both in natural and synthetic quartz, depending on the processes of mineral formation or alteration (Table 1).
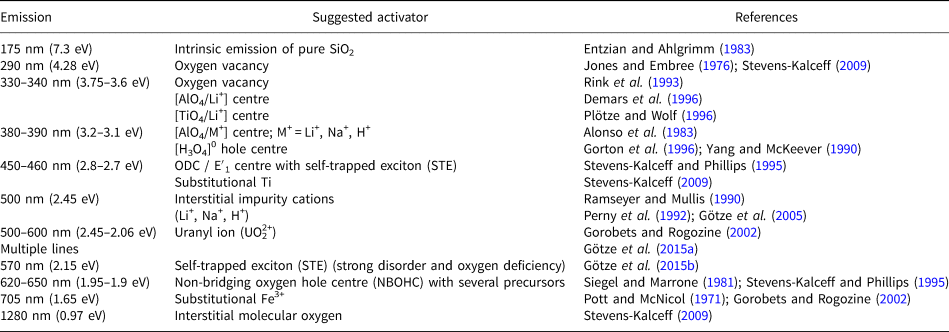
Table 1. Main emission bands in CL spectra of quartz and suggested activators (modified after Götze, Reference Götze2012a).
Therefore, knowledge about the origin of different luminescence centres can help to reconstruct geological processes and to reveal different growth generations (Fig. 6). However, the interpretation of the origin of CL emission bands in quartz is difficult due to a lack of stringent quantitative correlations between the intensities of CL bands and the concentrations of specific defects or trace elements.
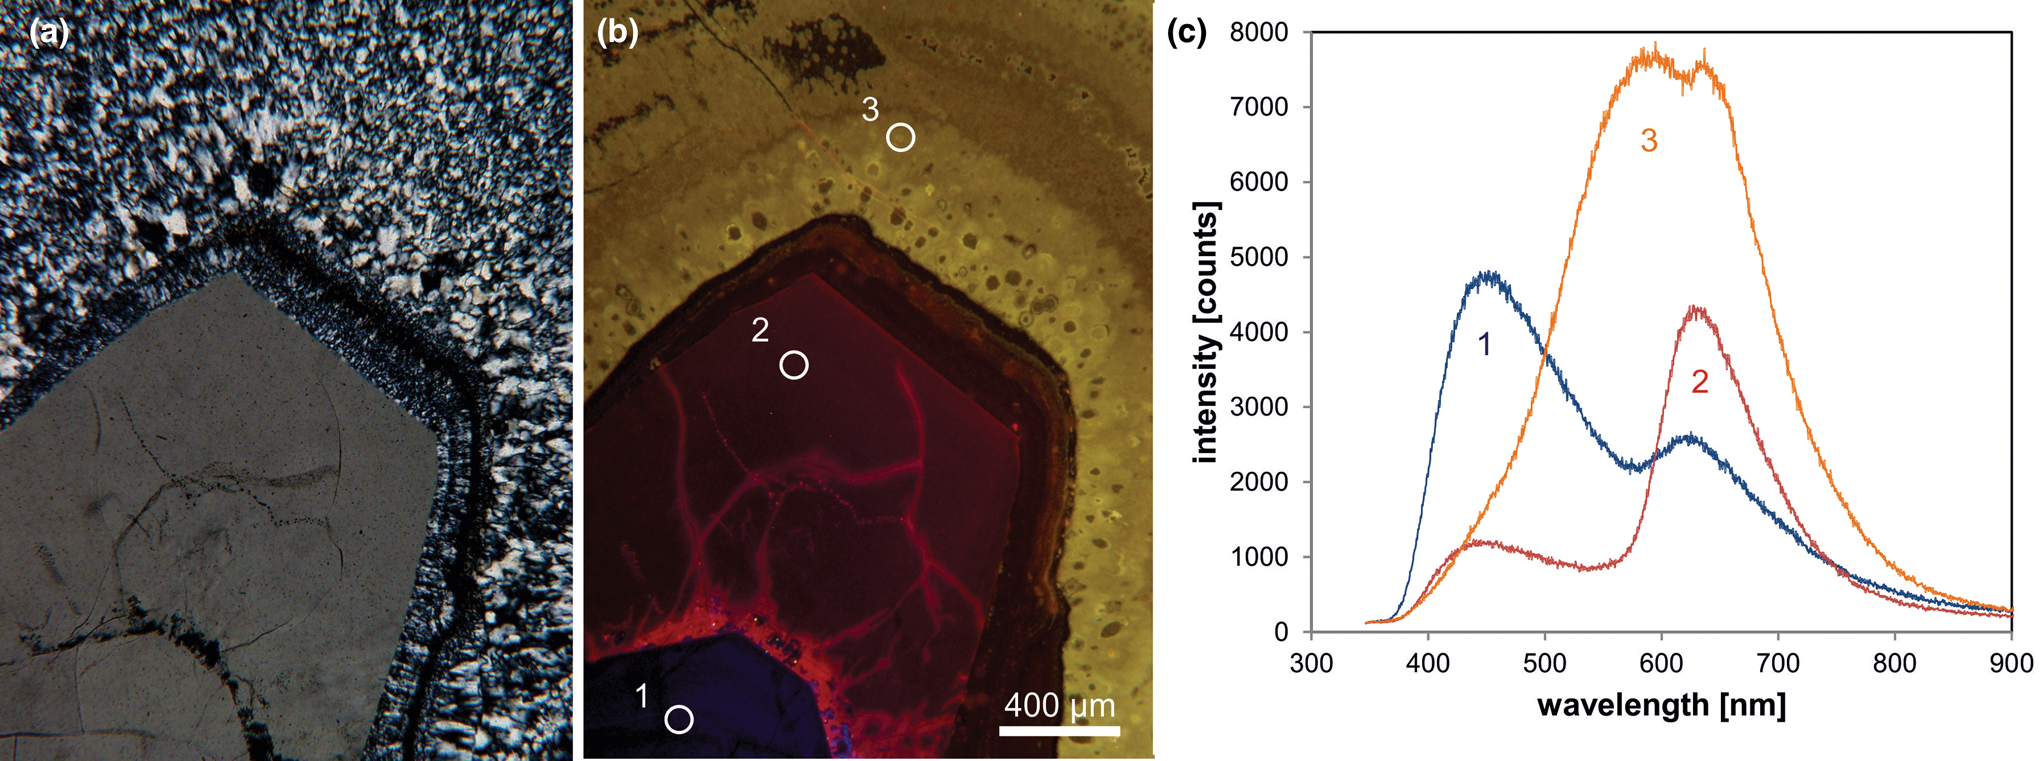
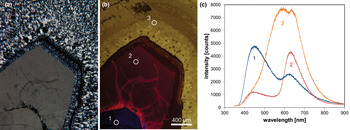
Fig. 6. Photomicrographs of quartz in transmitted light (crossed polars – a) and CL (b) in a rhyolite from Kemmlitz (Saxony, Germany); different quartz generations are distinguishable by different CL colours: (1) primary quartz phenocryst with blue CL, (2) reddish volcanic quartz of a second generation, (3) secondary microcrystalline quartz of hydrothermal origin with yellow CL. (c) The volcanic quartz exhibits two main emission bands at 450 and 620 nm with varying intensity ratios, whereas the hydrothermal quartz has a main emission at 570 nm and a subordinate shoulder at 620 nm; the circles in (b) mark the positions of spectral CL analyses.
In general, structural defects are much more important than trace elements as CL activators in quartz. Although correlations between CL zoning and several trace elements have been observed (e.g. Watt et al., Reference Watt, Wright, Galloway and McLean1997; Müller et al., Reference Müller, Wiedenbeck, Van den Kerkhof, Kronz and Simon2003; Rusk et al., Reference Rusk, Reed, Dilles and Kent2006, Reference Rusk, Lowers and Reed2008; Leeman et al., Reference Leeman, McRae, Wilson, Torpy, Lee, Student, Thomas and Vicenzi2012), the origin of the CL is related mostly to intrinsic lattice defects. The most common CL emission bands in natural quartz are bands with maxima at 450 and 650 nm (Ramseyer et al., Reference Ramseyer, Baumann, Matter and Mullis1988; Götze et al., Reference Götze, Plötze and Habermann2001a). The visible luminescence colours of quartz in most igneous and metamorphic rocks and in some authigenic quartz depend on the relative intensities of these two dominant emission bands (Fig. 6).
Blue emission band at ~450 nm (2.75 eV)
The ~450 nm (2.75 eV) blue emission band (Fig. 6c) is related to oxygen deficiency centres (ODC) and is similar in amorphous and crystalline SiO2 (Skuja, Reference Skuja1998). Recombination of the so-called self-trapped exciton (STE) involves an irradiation-induced electron hole pair (oxygen Frenkel pair) consisting of an oxygen vacancy and a peroxy linkage (Stevens Kalceff and Phillips, Reference Stevens-Kalceff and Phillips1995). The blue emission at ca. 450 nm is probably the most common CL emission in natural quartz and can be detected in almost all quartz types.
In addition to the evidenced activation of the 450 nm band by a structural defect, several studies reported a strong correlation between the intensity of luminescence and the concentration of Ti in quartz, with the brightest CL corresponding to the highest Ti concentrations (e.g. Müller et al., Reference Müller, Kronz and Breiter2002, Reference Müller, Wiedenbeck, Van den Kerkhof, Kronz and Simon2003; Van den Kerkhof et al., Reference Van den Kerkhof, Kronz, Simon and Scherer2004; Rusk et al., Reference Rusk, Lowers and Reed2008; Leeman et al., Reference Leeman, McRae, Wilson, Torpy, Lee, Student, Thomas and Vicenzi2012; Drivenes et al., Reference Drivenes, Larsen, Müller and Sørensen2016). Up to now there has been no serious spectroscopic evidence that Ti is responsible for the activation of the blue emission in quartz. However, recent systematic studies of Ti-rich natural quartz from igneous rocks, as well as synthetic quartz from Ti-diffusion experiments could prove that Ti might also be responsible for the activation of the 450 nm luminescence emission band (unpublished data – compare with Fig. 22).
Red emission band at 620–650 nm
The red emission band at 620–650 nm (1.95–1.9 eV; Fig. 6c) is attributed to the recombination of electrons in the non-bridging oxygen band-gap state with holes in the valence-band edge (Siegel and Marrone, Reference Siegel and Marrone1981; Stevens-Kalceff, Reference Stevens-Kalceff2009). A number of different precursors of this NBOHC has been proposed such as strained silicon–oxygen bonds, hydrogen or sodium impurities, or peroxy linkages (Stevens-Kalceff and Phillips, Reference Stevens-Kalceff and Phillips1995). The formation of the NBOHC from these different defects causes variations of the band position. It is assumed that the 620 nm (1.95 eV) component is characteristic for hydroxyl precursors (:Si–OH), which are common in hydrothermal and authigenic quartz as well as silicified wood (Stevens-Kalceff et al., Reference Stevens-Kalceff, Phillips, Moon, Kalceff, Pagel, Barbin, Blanc and Ohnenstetter2000).
The CL emission at 1.9 eV (650 nm) commonly increases during electron irradiation due to the formation of NBOHC from different precursors. A high state of lattice damage can be attained in radiation-damaged quartz. The creation of NBOHC defects by bond breaking due to the α-particles was observed in both natural radiation-damaged quartz samples and in radiation experiments (e.g. Komuro et al., Reference Komur, Horikawa and Toyoda2002; Krickl et al., Reference Krickl, Nasdala, Götze, Grambole and Wirth2008). In natural quartz, such lattice damage causes halos around U- and Th-bearing accessory minerals or migration tracks of U-bearing fluids (Fig. 7), which cannot be detected by conventional microscopic techniques (e.g. Owen, Reference Owen1988; Ramseyer et al., Reference Ramseyer, Baumann, Matter and Mullis1988; Meunier et al., Reference Meunier, Sellier and Pagel1990; Götze et al., Reference Götze, Plötze and Habermann2001a ; Botis et al., Reference Botis, Nokhrin, Pan, Xu and Bonli2005; Cerin et al., Reference Cerin, Götze and Pan2017).
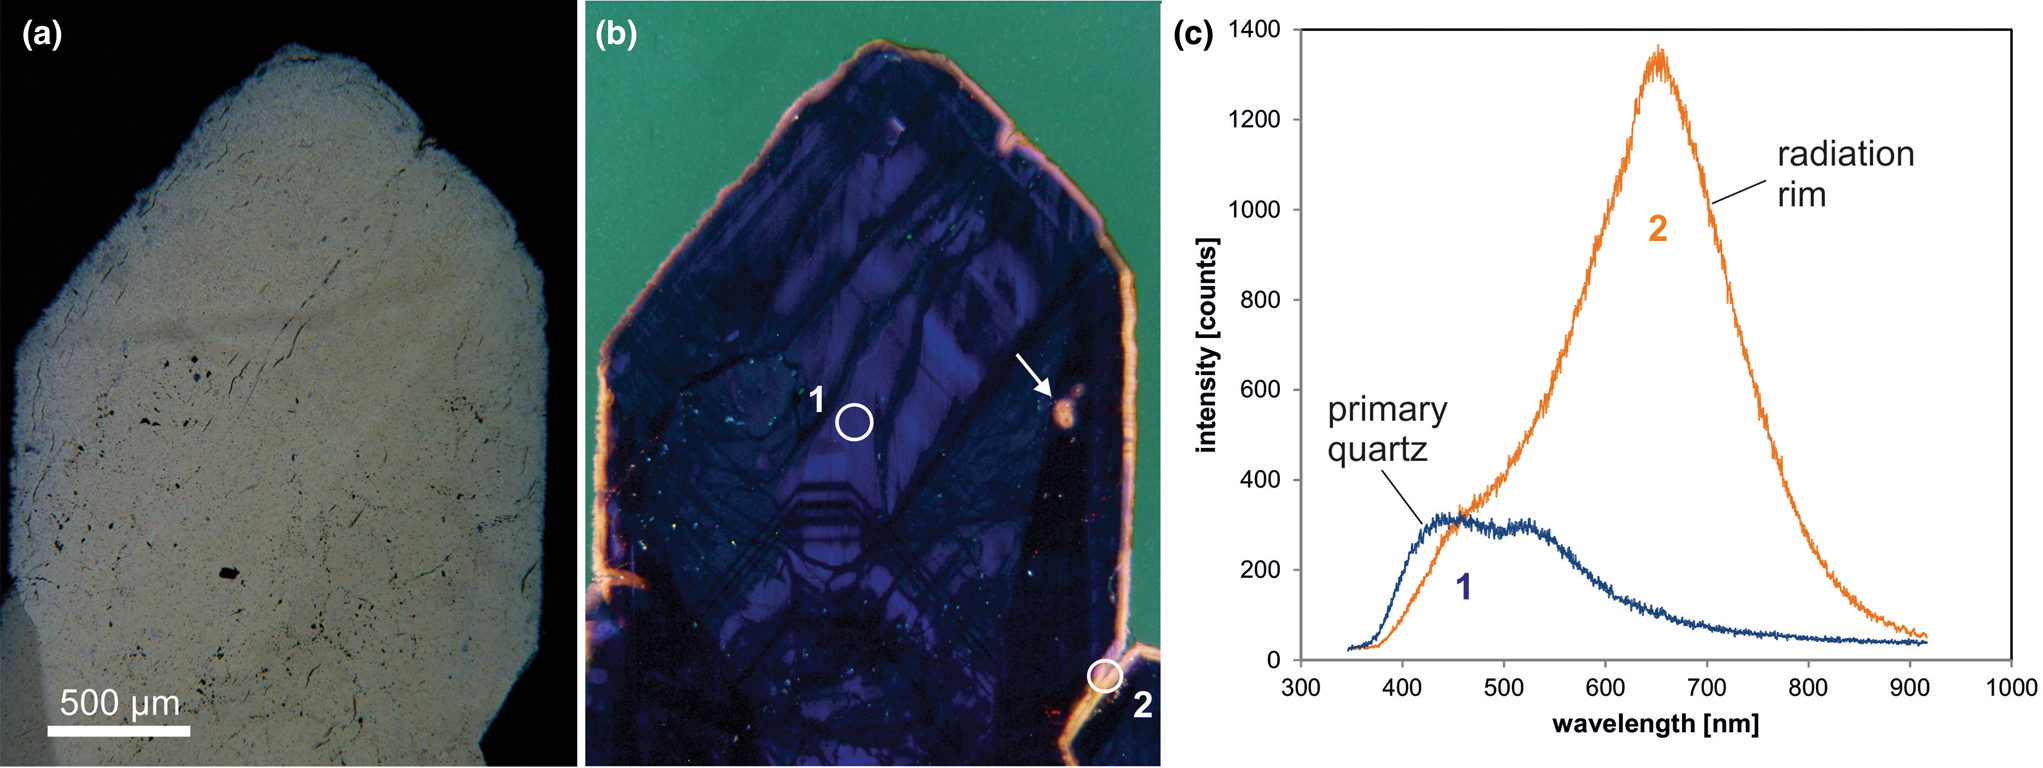
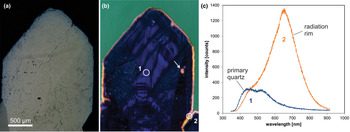
Fig. 7. Photomicrographs in transmitted light (crossed polars, a) and CL (b) of drusy quartz from the Arrow U-deposit, Athabasca basin (Saskatchewan, Canada); the CL image reveals a continuous yellow orange radiation rim around the crystal as well as radiation halos around radioactive inclusions (arrow). (c) The CL spectra display strong development of the 650 nm emission band (NBOHC) due to radiation induced lattice damage; the circles in (b) mark the positions of spectral CL analyses.
Yellow emission band at 570 nm (2.15 eV)
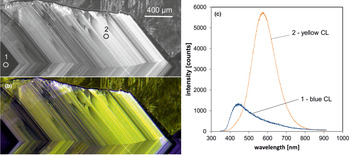
Another defect-related CL emission in quartz is a broad yellow emission band centred at 570 nm (2.15 eV) that was first observed by Rink et al. (Reference Rink, Rendell, Marseglia, Luff and Townsend1993) in natural quartz of hydrothermal origin and Götze et al. (Reference Götze, Plötze, Fuchs and Habermann1999) in agates of acidic volcanic rocks and hydrothermal vein quartz (Fig. 6c). Götze et al. (Reference Götze, Pan, Stevens-Kalceff, Kempe and Müller2015b) showed that the appearance of the 570 nm emission band can be attributed to high oxygen deficiency and local structural disorder in quartz. The proposed luminescence centre model implies self-trapped exciton (STE) emissions from strongly disordered regions in quartz. Additional geochemical data proved that quartz with yellow CL occurs exclusively in a low-temperature hydrothermal environment (mostly <250°C) and is related to fast crystallisation in an environment with oxygen deficiency.
Blue emission band at 385 nm (3.15 eV)
Trace-element activated CL in quartz is rare, but can be observed for specific geological environments, in particular in hydrothermal and pegmatite quartz. A blue emission at the edge of the UV region with a maximum at ca. 385 nm (3.15 eV; Fig. 8) correlates well with the Al content and the concentration of paramagnetic [AlO4/M+] centres (Alonso et al., Reference Alonso, Halliburton, Kohnke and Bossoli1983; Luff and Townsend, Reference Luff and Townsend1990; Perny et al., Reference Perny, Eberhardt, Ramseyer and Mullis1992). The short-lived blue CL is the typical feature of natural and synthetic hydrothermal quartz (Ramseyer et al., Reference Ramseyer, Baumann, Matter and Mullis1988; Götze et al., Reference Götze, Plötze and Habermann2001a, Reference Götze2009). Because of the sensitivity to electron irradiation, this emission has been attributed to the recombination of a hole trapped adjacent to a substitutional, charge-compensated aluminium-alkali ion centre (Stevens Kalceff and Phillips, Reference Stevens-Kalceff and Phillips1995). The rapid attenuation of the 385 nm emission under an electron beam results from the dissociation and electromigration of the charge compensating cations out of the interaction volume under the influence of the irradiation induced electrical field (Perny et al., Reference Perny, Eberhardt, Ramseyer and Mullis1992). However, Gorton et al. (Reference Gorton, Walker and Burley1996) found a reduced 390 nm band even in ultra-pure synthetic quartz and suggested that the 3.15 eV emission is probably not completely related to Al.
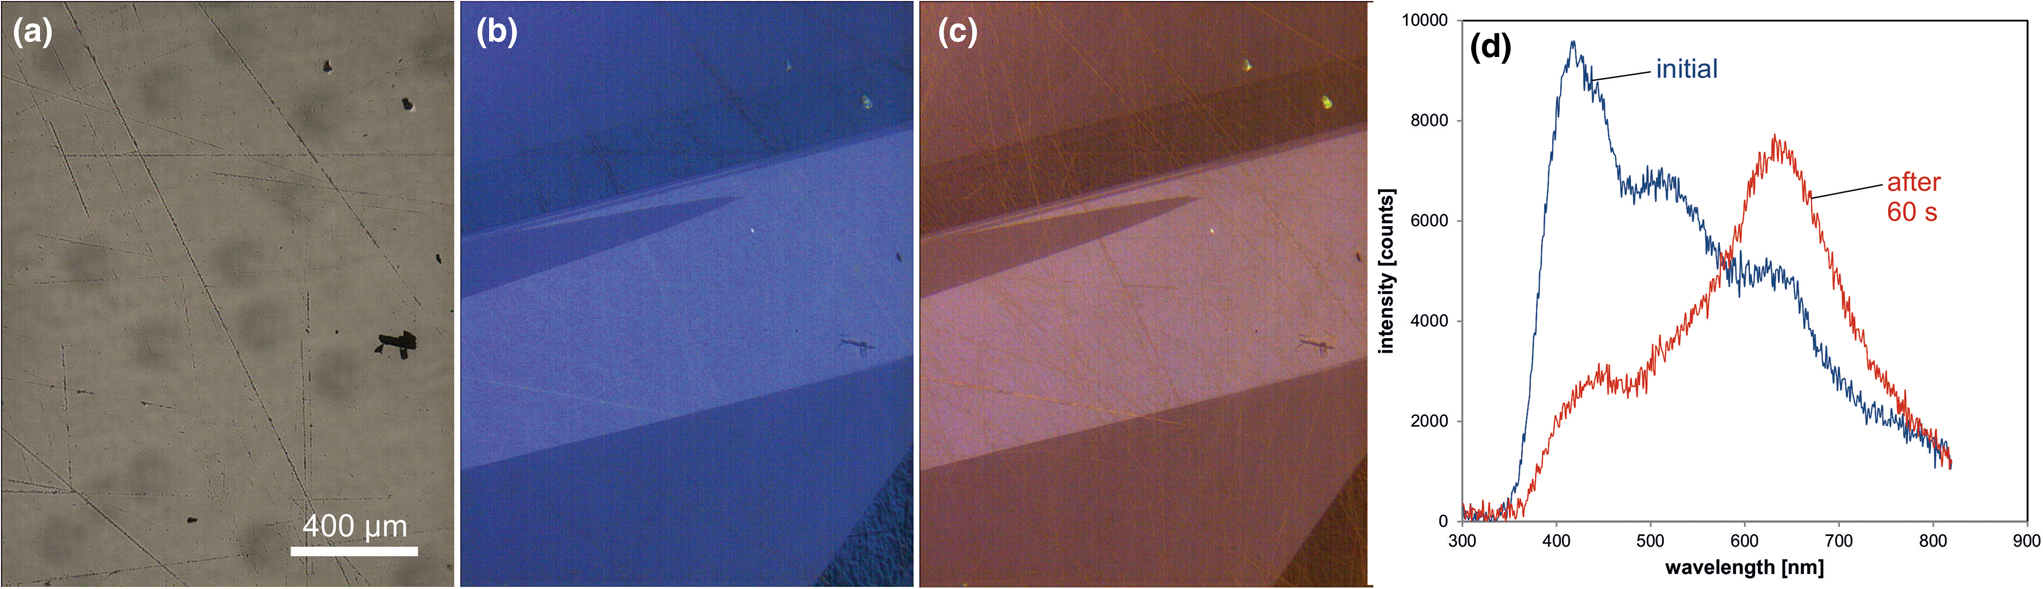
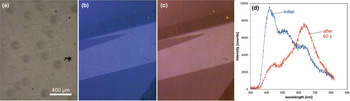
Fig. 8. Photomicrographs in transmitted light (crossed polars, a) and CL (b) of an Al-doped, synthetic hydrothermal quartz; CL reveals growth zones not visible in transmitted light. (c) The CL image after 60 s of electron irradiation reveals the transient character of the CL, which turns from initial blue (b) to reddish-brown (c). The related CL spectra (d) show a strong decrease of the blue emission band, whereas the red band increases due to the conversion of precursor centres (e.g. silanol groups :Si–OH) into the NBOHC.
Blue green emission at ~500 nm (2.45 eV),
Another trace-element related luminescence emission band in quartz is the short-lived blue-green CL (Fig. 9) at ca. 500 nm (2.45 eV), which can be related to the alkali-compensated trace-element centres in the quartz structure (Ramseyer and Mullis, Reference Ramseyer and Mullis1990; Perny et al., Reference Perny, Eberhardt, Ramseyer and Mullis1992, Götze et al., Reference Götze, Plötze and Trautmann2005). Ramseyer and Mullis (Reference Ramseyer and Mullis1990) and Perny et al. (Reference Perny, Eberhardt, Ramseyer and Mullis1992) performed CL measurements, microprobe analyses, temper and electro-diffusion experiments and concluded that the CL can be related to the uptake of positively charged interstitial cations (H+, Na+, Li+) associated with the substitution of Al for Si. Several studies showed that the transient blue-green CL is a characteristic feature of pegmatite quartz and can also occur in hydrothermal and even in metamorphic quartz (Ramseyer and Mullis, Reference Ramseyer and Mullis1990, Perny et al., Reference Perny, Eberhardt, Ramseyer and Mullis1992; Götze et al., Reference Götze, Plötze and Habermann2001a, Reference Götze, Plötze and Trautmann2005; Sittner and Götze, Reference Sittner and Götze2018). Recent studies showed the predominance of Li+ as a charge-balancing cation for the 500 nm CL emission in pegmatite quartz (Sittner, Reference Sittner2019).

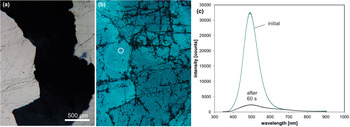
Fig. 9. Photomicrographs in transmitted light (crossed polars, a) and CL (b) of a pegmatite quartz from Heftetjern, Tørdal region (Norway); the sample exhibits the characteristic transient blue-green CL; fluid trails are visible due to dark CL. (c) The CL spectra show a drastic drop of the CL intensity of the 500 nm emission band during electron irradiation; the circle in (b) marks the position of spectral CL measurements.
The intensity of the blue-green CL falls off rapidly within 30 to 60 seconds during electron irradiation. This transient behaviour can be related to ionisation-enhanced diffusion of luminescence centres as was proved by electro-diffusion experiments (Ramseyer and Mullis, Reference Ramseyer and Mullis1990). The short-lived CL can be restored by heating the quartz to 500°C for one day (Perny et al., Reference Perny, Eberhardt, Ramseyer and Mullis1992) indicating an opposite mechanism to that of thermoluminescence. In contrast, gamma-irradiation causes a decrease in the intensity of the short-lived blue-green CL and an increase in smoky colouration (Ramseyer and Mullis, Reference Ramseyer and Mullis1990). This can be explained by the conversion of [AlO4/M+]0 luminescence centres into [AlO4]0 colour centres.
Green luminescence at ~500–600 nm
A remarkable feature of some microcrystalline silica varieties as well as macrocrystalline quartz in agates is greenish luminescence emitted in CL and under short-wave UV (<300 nm) excitation, which is uncommon in quartz of magmatic and metamorphic rocks (Fig. 10). There have also been a few reports about UV-excited green luminescence in opal and chert that have elevated uranium concentrations (Gaillou et al., Reference Gaillou, Delaunay, Rondeau, Bouhnik-le-Coz, Fritsch, Cornen and Monnier2008). The green luminescence is due to the electron transition from an excited to a ground state of the uranyl ion (UO22+) and is shown by a typical emission line at ~500 nm (2.45 eV) accompanied by several equidistant lines (Götze et al., Reference Götze, Gaft and Möckel2015a; Fig. 10c). These are due to the harmonic vibrations of oxygen atoms along the uranyl axis (Gorobets and Rogojine, Reference Gorobets and Rogozine2002). Recent studies have revealed that U is mainly incorporated in the form of a uranyl-silicate complex in opal and microcrystalline quartz (Pan et al., Reference Pan, Li, Feng, Wiens, Chen, Götze and Lin2021). The mechanism of the uranyl luminescence is very effective and can be detected in SiO2 phases with U contents as low as 1 ppm.
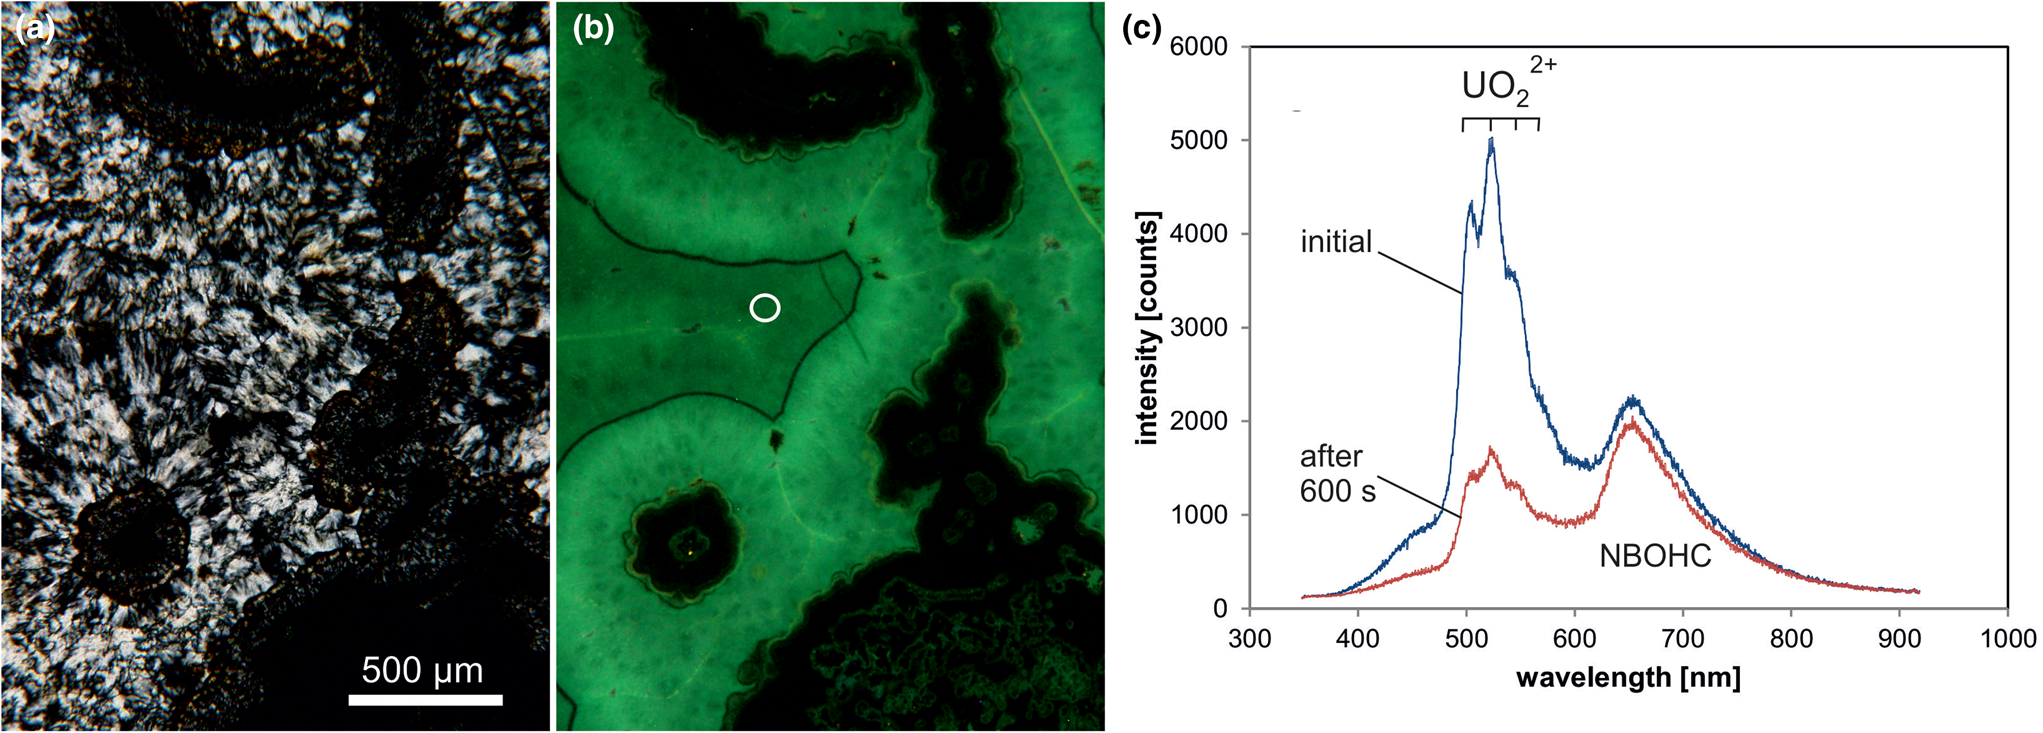
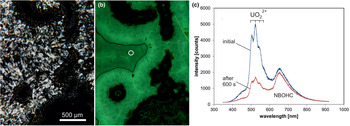
Fig. 10. Photomicrographs in transmitted light (crossed polars, a) and CL (b) of a chalcedony sample from Kardzali, Bulgaria; microcrystalline quartz exhibits a bright green CL. (c) The CL spectra reveal that uranyl (UO22+) is responsible for the emission peak at ~500 nm accompanied by several equidistant lines; there is an additional CL emission band at 650 nm due to the non-bridging oxygen hole centre (NBOHC). The circle in (b) marks the position of spectral CL analyses.
Red luminescence at 705 nm (1.65 eV)
A CL emission band in the red on the edge to the infrared around 705 nm (1.65 eV) was first reported from synthetic quartz crystals (Pott and McNicol, Reference Pott and McNicol1971). It is assumed that this ~705 nm emission can be related to the substitutional incorporation of Fe3+ into the quartz lattice similar to other silicates such as feldspar minerals (Pott and McNicol, Reference Pott and McNicol1971; Gorobets and Rogojine, Reference Gorobets and Rogozine2002). Some red luminescing quartz was also found in metasomatically overprinted granites from Khaldzan Buregte (Mongolia), where the ferric iron was probably mobilised during fenitisation processes (Kempe et al., Reference Kempe, Götze, Dandar and Habermann1999). Because of the relatively large ionic radius of Fe3+ its incorporation into the quartz lattice is limited and therefore, the 705 nm emission is rare. Its origin has to be further verified by measurements of the luminescence lifetime and/or the luminescence excitation spectra.
Mineral chemistry of quartz
Quartz is one of the purest minerals in the Earth's crust in terms of chemical impurities expressed as trace-element contents. Due to limitations in charge and ionic radii only a limited number of ions can substitute for Si4+ in the crystal lattice or can be incorporated in interstitial positions. Therefore, most elements are present in quartz in concentrations below 1 ppm (Müller et al., Reference Müller, Wiedenbeck, Van den Kerkhof, Kronz and Simon2003, Reference Müller, Wanvik, Ihlen, Götze and Möckel2012; Götze, Reference Götze2009). The structural incorporation in a regular Si4+ lattice position has been proven for Al3+, Ga3+, Fe3+, B3+, Ge4+, Ti4+ and P5+ (e.g. Weil, Reference Weil1984), in which Al is probably the most common ion (up to a few 1000 ppm) because of its abundance in the Earth's crust and the similar ionic radii of Si4+ and Al3+. Mono- and divalent ions, primarily H+, Li+, Na+, K+, Be+, Rb+ and Fe2+ may enter interstitial lattice positions in small amounts and charge-compensate trivalent substitutional ions, mainly Al3+ (Bambauer, Reference Bambauer1961, Kats, Reference Kats1962, Perny et al., Reference Perny, Eberhardt, Ramseyer and Mullis1992, Stalder et al., Reference Stalder, Potrafke, Billström, Skogby, Meinhold, Gögele and Berberich2017, Potrafke et al., Reference Potrafke, Stalder, Schmidt and Ludwig2019). For most other elements (e.g. Ca, Mg, Ba, Sr, REE, Mn, U and Th) capture by nano- (< 100 nm) or micro-inclusions (0.1–1 μm) of fluids or minerals is the most important mechanism (e.g. Gerler and Schnier, Reference Gerler and Schnier1989; Müller et al., Reference Müller, Wiedenbeck, Van den Kerkhof, Kronz and Simon2003; Götze, Reference Götze2009).
Aluminium
The structural incorporation of aluminium is evidenced by numerous studies using EPR spectroscopy (Alonso et al., Reference Alonso, Halliburton, Kohnke and Bossoli1983). The substitution of Si4+ by Al3+ is mostly accompanied by charge compensating cations in interstitial positions. Combined studies by EPR, CL, spatially resolved trace-element analyses and SIMS mapping have revealed that Li+ seems to be the dominant charge compensating ion in igneous and pegmatite quartz (Götze et al., Reference Götze, Plötze and Trautmann2005; Beurlen et al., Reference Beurlen, Müller, Silva and Da Silva2011; Sittner, Reference Sittner2019), whereas H+ plays an additional significant role in hydrothermal quartz and authigenic quartz in sedimentary/diagenetic environments (Bambauer, Reference Bambauer1961; Miyoshi et al., Reference Miyoshi, Yamaguchi and Makino2005; Müller and Koch-Müller, Reference Müller and Koch-Müller2009; Jourdan et al., Reference Jourdan, Vennemann, Mullis, Ramseyer and Spiers2009; Götte et al., Reference Götte, Pettke, Ramseyer, Koch-Müller and Mullis2011; Lehmann et al., Reference Lehmann, Pettke and Ramseyer2011; Götte, Reference Götte, Armitage, Butcher, Churchill, Csoma, Hollis, Lander, Omma and Worden2016; Stalder et al., Reference Stalder, Potrafke, Billström, Skogby, Meinhold, Gögele and Berberich2017; Fig. 11). The preferred incorporation of H+ in interstitial structural positions in natural and synthetic hydrothermal quartz can be explained by its input from the mineralising aqueous fluids (Bambauer et al., Reference Bambauer, Brunner and Laves1962; Stenina, Reference Stenina2004). Further possible mechanisms of structural incorporation of Al3+ are the coupled substitution with a pentavalent ion or the charge compensation by electron defects on vacancies.
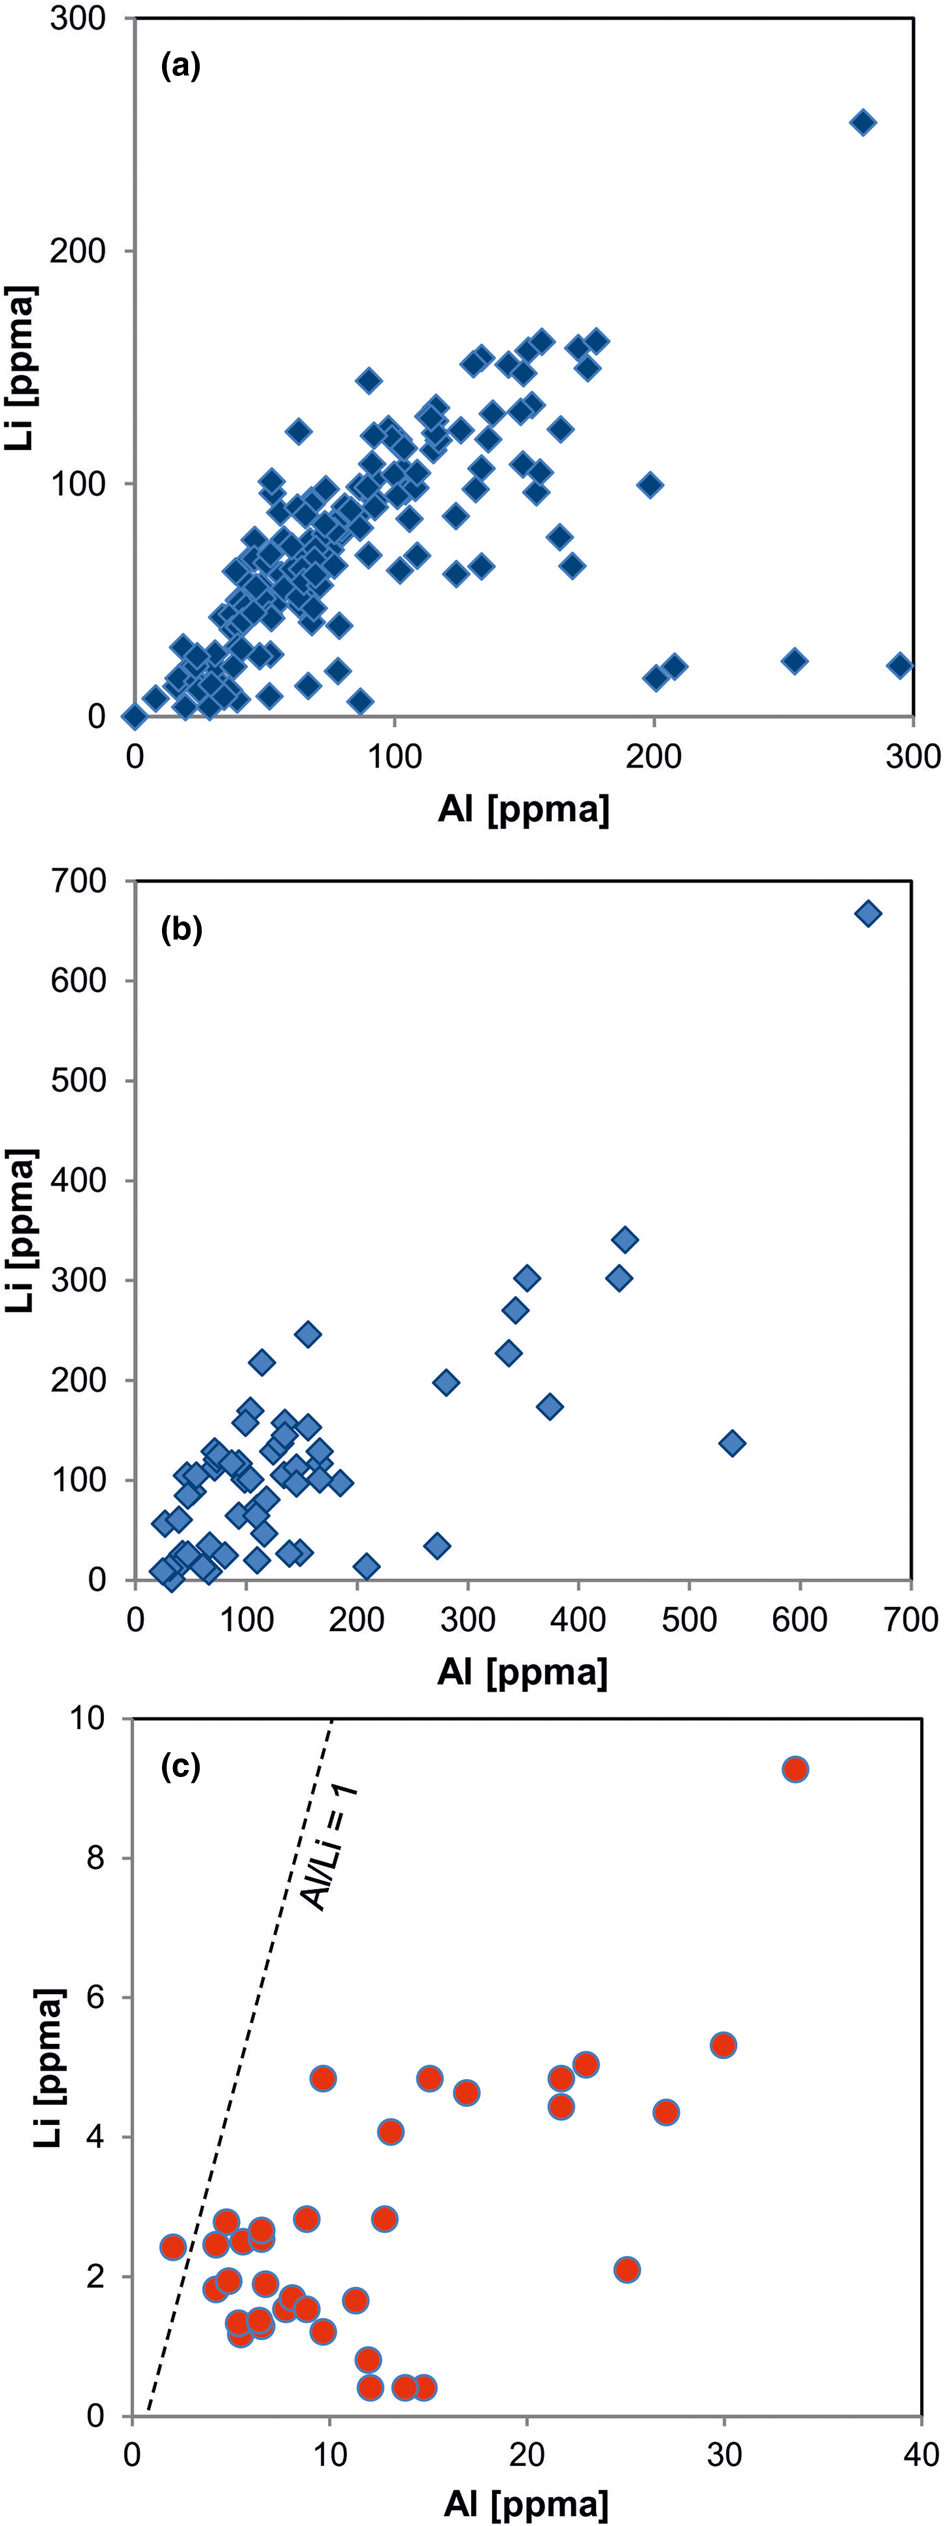
Fig. 11. Element correlation for Al vs. Li (ppma = atoms per 106 atoms Si) in quartz of different origin: (a) pegmatite quartz from Norway; (b) pegmatite quartz from different deposits in Norway and Namibia; (c) hydrothermal quartz from the Ural region, Russia. The pegmatite quartz shows almost 1:1 ratios of Al to Li, whereas the hydrothermal quartz is Li deficient (data from Götze et al., Reference Götze, Plötze, Graupner, Hallbauer and Bray2004, Reference Götze, Pan, Müller, Kotova and Cerin2017; Sittner, Reference Sittner2019).
The concentration of Al in quartz in magmatic systems seems to be mainly controlled by the aluminium saturation index of the melt rather than by the temperature (Jacomon and Larsen, Reference Jacamon and Larsen2009; Breiter et al., Reference Breiter, Ackerman, Svojtka and Müller2013, Reference Breiter, Ďurišová and Dosbaba2020). Accordingly, the Al concentration in quartz increases during melt evolution from metaluminous to peraluminous compositions. In hydrothermal systems, factors such as temperature, growth rate and Al concentration in the aqueous solution influence the Al content in quartz. It was shown that changes in pH have strong effects on Al solubility and the aqueous Al concentration, and thus cause variations of the Al concentration in hydrothermal quartz (e.g. Perny et al., Reference Perny, Eberhardt, Ramseyer and Mullis1992; Rusk et al., Reference Rusk, Lowers and Reed2008; Müller et al., Reference Müller, Herrington, Armstrong, Seltmann, Kirwin, Stenina and Kronz2010; Luo et al., Reference Luo, Zhou, Huang, Caulfield, Zhao, Feng and Ouyang2020).
The incorporation of Al into SiO4 tetrahedra is limited by the ionic radius of the Al3+ ion (0.54 Å), which can occur both in fourfold and sixfold coordination with oxygen. Therefore, high amounts of Al substitution in quartz result in a distortion of the tetrahedra and destroy the perfection of the crystal lattice. Nevertheless, previous EPR studies of [AlO4]0 centres in chalcedony and the macrocrystalline quartz in agates have revealed abnormal high concentrations of structural Al in these SiO2 phases (Götze et al., Reference Götze, Plötze, Tichomirowa, Fuchs and Pilot2001b). There are strong indications that the formation of some hydrothermal quartz and/or agate proceeds through several structural states of SiO2 with amorphous silica as the first solid phase (Dong et al., Reference Dong, Morrison and Jaireth1995, Götze et al., Reference Götze, Möckel and Pan2020). This might result in areas or zones with a high degree of disorder and large numbers of lattice defects (oxygen and silicon vacancies), which enable the incorporation of high concentrations of ‘defect’ Al. Such a scenario could also explain the extreme high concentrations of Al in neighbouring individual growth zones or generations of hydrothermal quartz, which reflect abrupt changes in the physicochemical conditions (open hydrothermal system).
Titanium
In contrast to Al, titanium can be both incorporated as substitutional ion for Si4+ and bound on mineral micro-inclusions such as rutile or anatase. The geochemical compatibility of Ti and its relatively large ionic radius (Ti4+ 0.61 Å) results in a preferred uptake in early formed quartz at high temperatures and pressures. Therefore, the highest Ti contents in quartz can be found in quartz phenocrysts in volcanic rocks and early crystallised quartz grains in igneous rocks. In granitic melts, decrease in the Ti concentrations in quartz can be observed during increasing fractionation and decreasing temperature (Larsen et al., Reference Larsen, Henderson, Ihlen and Jacamon2004; Breiter and Müller, Reference Breiter and Müller2009). The lowest Ti concentrations in quartz were measured in quartz crystallised from aqueous solutions at relatively low temperatures (Blankenburg et al., Reference Blankenburg, Götze and Schulz1994; Müller et al., Reference Müller, Wiedenbeck, Van den Kerkhof, Kronz and Simon2003). Using the temperature dependence of Ti uptake in quartz, Wark and Watson (Reference Wark and Watson2006) created a Ti-in-quartz geothermometer based on the Ti concentration in quartz. Subsequently, Huang and Audétat (Reference Huang and Audétat2012) discovered, in addition, that Ti incorporation in quartz is slightly controlled by the crystallisation pressure, and modified the geothermometer to a Ti-in-quartz geothermobarometer. The geothermobarometer is, however, very sensitive to the Ti saturation of the melt in which the quartz crystallises and thus has to be applied with caution.
The limitations in structural compatibility of Ti frequently cause exsolution phenomena at lower temperatures, such as the formation of TiO2 micro-inclusions (rutile, anatase) in quartz crystals. Ti4+ is commonly sixfold coordinated by oxygen because of its ionic radius. The substitution of fourfold coordinated Ti4+ for Si4+ in the tetrahedral position is only possible at elevated temperatures. Therefore, a straight correlation between bulk Ti contents in quartz and structural Ti measured by EPR spectroscopy is often missing (Fig. 12). However, it should also be considered that Ti can be incorporated as a diamagnetic [TiO4]0 centre that cannot be detected by EPR spectroscopy.
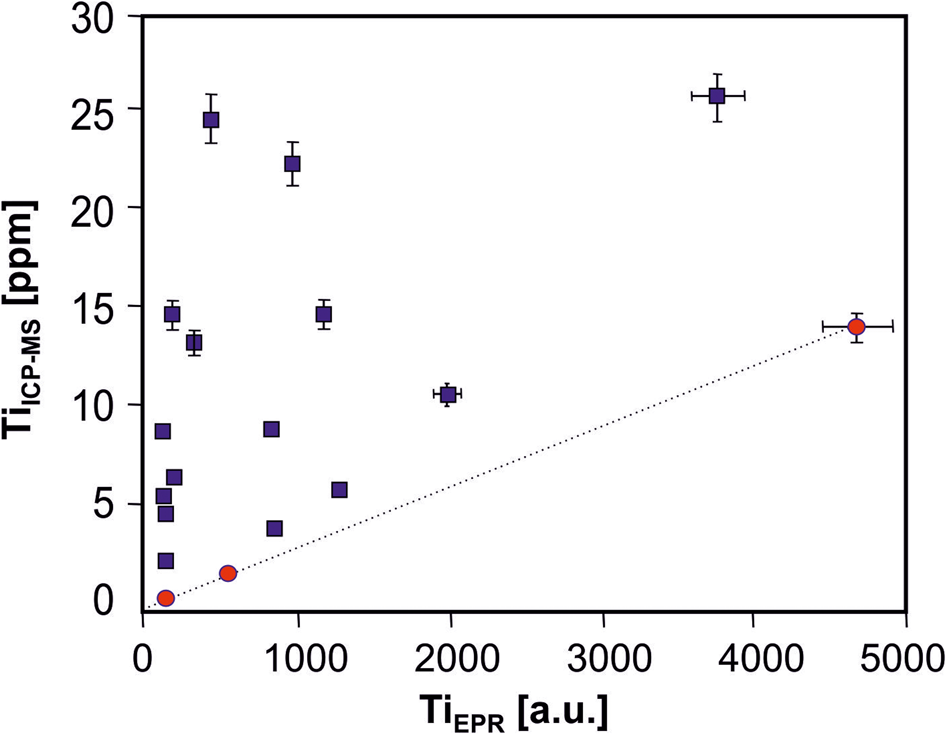
Fig. 12. Plot of Ti content in quartz measured by ICP-MS vs. concentration of structural Ti ([TiO4/Li+]0 centres) determined by EPR spectroscopy (concentrations were determined as peak to base intensity under constant analytical settings according to Moiseev, Reference Moiseev1985). Pegmatite quartz samples from the Rubicon Mine, Namibia (red circles) exhibit a linear correlation with zero intercept indicating a complete presence of Ti as structural substituent for Si; quartz samples from Norway (blue squares) are mostly far away from the correlation and show higher Ti contents; in these samples micro-inclusions of rutile were detected (data from Götze et al., Reference Götze, Plötze, Graupner, Hallbauer and Bray2004).
Germanium
Germanium shows a similar geochemical behaviour compared to Si, in addition Ge4+ has a similar ionic radius (0.53 Å). Therefore, Ge4+ can substitute isovalently for Si4+ in the SiO4 tetrahedra. However, Ge belongs to the group of elements occurring in low concentrations in the Earth's crust (Clark value 1.4 ppm) mostly resulting in low concentrations in quartz. Germanium does not partition into any particular mineral phase and is therefore enriched in residual melts or fluids. In particular the presence of halogens (e.g. fluorides) in the crystallisation medium favours the development of durable and volatile compounds (Walenczak, Reference Walenczak1969). Thermodynamic considerations suggest that the transport and accumulation of Ge as the GeF4 complex during chemical transport reactions could probably explain elevated Ge concentrations in quartz in specific geological environments (Götze et al., Reference Götze, Schrön, Möckel and Heide2012).
Germanium contents in quartz from magmatic and metamorphic rocks are mostly in the range between 0.5 and 1.5 ppm (Walenczak, Reference Walenczak1969; Blankenburg et al., Reference Blankenburg, Götze and Schulz1994). In most hydrothermal quartz, the Ge content is similar. Only some hydrothermal quartz veins in paragenesis with metalliferous deposits show elevated Ge contents up to several ppm (Blankenburg et al., Reference Blankenburg, Götze and Schulz1994; Müller et al., Reference Müller, Herklotz and Giegling2018; Breiter et al., Reference Breiter, Ďurišová and Dosbaba2020). Concentrations of >1.5 ppm up to 23 ppm Ge were measured in quartz crystallised from fractionated granitic and pegmatitic magmas (Götze et al., Reference Götze, Plötze, Graupner, Hallbauer and Bray2004; Beurlen et al., Reference Beurlen, Müller, Silva and Da Silva2011; Breiter et al., Reference Breiter, Ackerman, Ďurišová, Svojtka and Novák2014). Extraordinary Ge concentrations of partially > 90 ppm were found in micro- and macrocrystalline quartz of agates, which exceeded the average concentration of the Earth's crust and also the Ge content in the surrounding host rocks (Götze et al., Reference Götze, Möckel, Vennemann and Müller2016, Reference Götze, Möckel and Pan2020).
Phosphorus
Phosphorus can substitute as P5+ with an ionic radius of 0.38 Å for Si4+ in the quartz structure. A coupled mechanism 2 Si4+ ↔ P5+ + M3+ (M3+ = Al3+, B3+) is assumed for the structural incorporation with Al3+ as the most frequent charge compensator, confirmed by the paramagnetic [O3AlOPO3]+ centre (Maschmeyer and Lehmann, Reference Maschmeyer and Lehmann1983). However, P is generally not considered in analytical measurements. Therefore, a specified procedure for the precise determination of P in quartz was developed by Müller et al. (Reference Müller, Wiedenbeck, Flem and Schiellerup2008).
The absolute concentration of P in quartz is mostly low and rarely exceeds several ppm (e.g. Larsen et al., Reference Larsen, Henderson, Ihlen and Jacamon2004; Müller et al., Reference Müller, Wiedenbeck, Van den Kerkhof, Kronz and Simon2003, Reference Müller, Wanvik, Ihlen, Götze and Möckel2012; Beurlen, Reference Beurlen, Müller, Silva and Da Silva2011; Breiter et al., Reference Breiter, Ackerman, Svojtka and Müller2013, Reference Breiter, Ďurišová and Dosbaba2020; Sittner, Reference Sittner2019). The concentration of P is typically buffered by the presence of fractionating mineral phases that particularly incorporate it at the expense of the residual melt and quartz. Therefore its distribution in quartz seems to be erratic (Beurlen et al., Reference Beurlen, Müller, Silva and Da Silva2011). Nevertheless, it seems to be slightly enriched during the differentiation of granitic and pegmatitic systems in late crystallisation phases (Larsen et al., Reference Larsen, Henderson, Ihlen and Jacamon2004).
Iron
Iron can be incorporated structurally by substituting for Si4+ in the tetrahedra or in interstitial sites. However, the ionic radii of Fe2+ (0.78 Å) and Fe3+ (0.65 Å) are much larger than that of Si4+. Therefore, the incorporation is limited and mostly occurs in marginal parts or damaged areas of quartz crystals (Mineeva et al., Reference Mineeva, Bershov and Petrov1991; Götze and Plötze, Reference Götze and Plötze1997). Therefore, elevated contents of Fe in quartz can mostly be related to micro-inclusions of Fe-bearing minerals (e.g. hematite, goethite) or nano-clusters of amorphous Fe-compounds.
Boron
Boron mostly occurs in low concentrations (< 1 ppm) in quartz (Blankenburg et al., Reference Blankenburg, Götze and Schulz1994). Elevated contents of > 10 ppm B have been measured in quartz of pegmatites (e.g. Götze et al., Reference Götze, Plötze, Graupner, Hallbauer and Bray2004; Beurlen et al., Reference Beurlen, Müller, Silva and Da Silva2011; Müller et al., Reference Müller, Wanvik, Ihlen, Götze and Möckel2012), and remarkably high concentrations of up to 46 ppm were detected in quartz of agates from different locations (Götze et al., Reference Götze, Möckel and Pan2020). Similar to Ge, a preferred transport of boron as a volatile BF3 complex during chemical transport reactions could be responsible for the accumulation of B in quartz, if halogens were available in the participating fluids (Götze et al., Reference Götze, Schrön, Möckel and Heide2012).
The existence of nano-inclusions of tourmaline has been discussed as a possible reason for high B contents in pegmatite quartz (Müller et al., Reference Müller, Wanvik, Ihlen, Götze and Möckel2012). However, quartz commonly lacks such impurities and a structural incorporation of boron must be assumed by analogy with other silicates (Grew and Hinthorne, Reference Grew and Hinthorne1983). Because of the small ionic radius of the B3+ ion (0.27 Å), the formation of planar BO3-groups in minerals is commonly favoured (Jolland et al., Reference Jollands, Blanchard and Balan2020), however the incorporation as BO4 tetrahedra is also possible. Therefore, a coupled substitution of B3+ with pentavalent ions (P5+) in two neighbouring MO4 tetrahedra or in combination with charge-balancing cations and electron defects, respectively, has to be considered.
Gallium
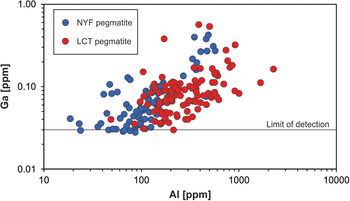
Gallium occurs at very low concentrations in natural quartz (< 0.1 ppm) and is, thus, rarely detected. Walenczak (Reference Walenczak1969) was probably the first who reported Ga concentrations of igneous, metamorphic and hydrothermal quartz. In most of the quartz investigated, Ga showed concentrations between 0.02 and 0.4 ppm and amethyst had generally high Ga up to 25 ppm. Recent publications, applying in situ micro-beam techniques with very low detection limits for trace-element determination, have not confirmed such high Ga contents in natural quartz, and only chalcedony and macrocrystalline quartz of agates had Ga contents of 1–2 ppm (Götze et al., Reference Götze, Gaft and Möckel2015a). Müller et al. (Reference Müller, Keyser, Simmons, Webber, Wise, Beurlen, Garate-Olave, Roda-Robles and Galliski2021) has shown, however that Al and Ga concentrations in quartz correlate (Fig. 13).
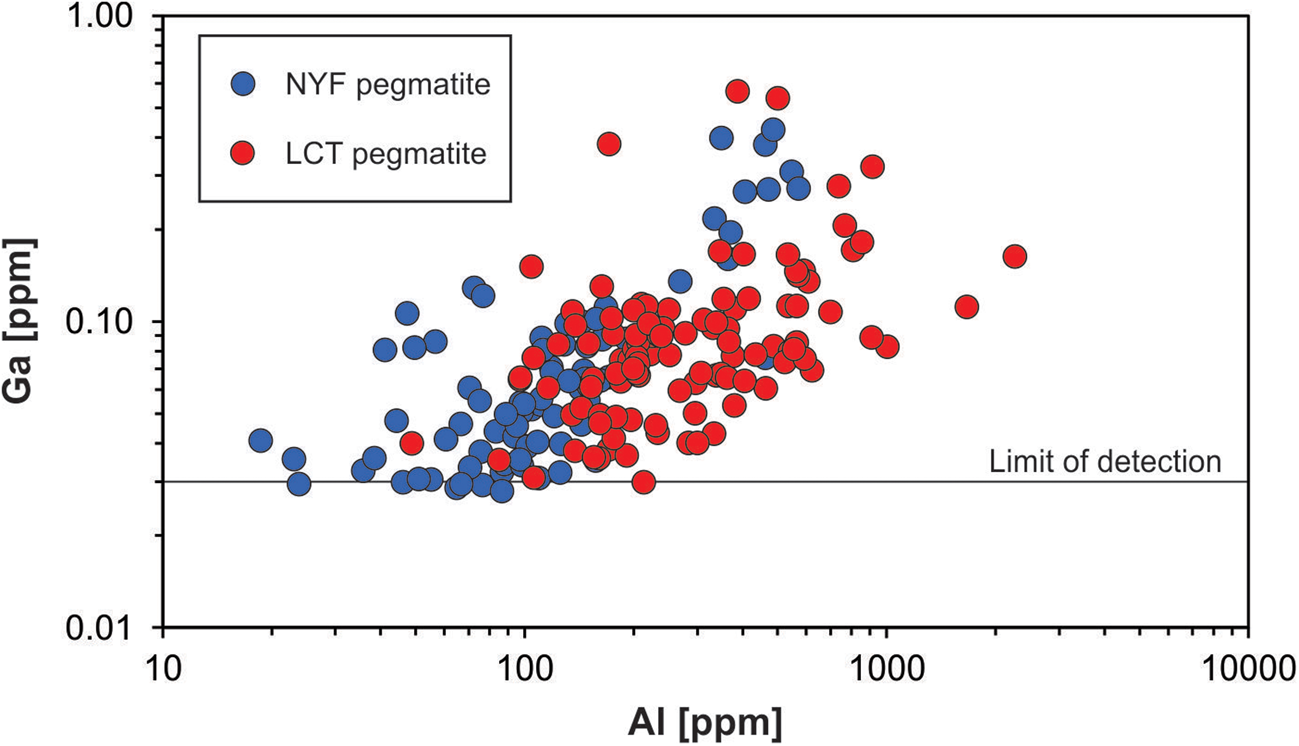
Fig. 13. Aluminium vs. Ga in pegmatite quartz of different origin (data from Müller et al., Reference Müller, Keyser, Simmons, Webber, Wise, Beurlen, Garate-Olave, Roda-Robles and Galliski2021; NYZ = Nb/Y/F-pegmatite, LCT = Li/Cs/Ta-pegmatite according to Černỳ and Ercit, Reference Černỳ and Ercit2005).
Alkali and alkali earth elements
Alkali and alkali earth elements can occur in elevated concentrations (up to >100 ppm) in quartz. In principle, cations such as Li+, Na+ or K+ can be incorporated in interstitial positions (Botis et al., Reference Botis and Pan2009), where Li+ is the most common charge-compensating ion. The lithophile character of Li probably favours its partition into silicate melts and quartz rather than in aqueous fluids. Therefore, it prefers the incorporation into structural channels for the charge compensation of Al rather than the concentration in fluid inclusions (Götze et al., Reference Götze, Plötze, Graupner, Hallbauer and Bray2004). Hence, the uptake of Li in the quartz lattice seems to be mostly limited by the amount of substitutional Al (Müller and Koch-Müller, Reference Müller, Wiedenbeck, Van den Kerkhof, Kronz and Simon2003). The availability of Li at time of quartz crystallization is thereby also controlled by the crystallization order of Li minerals and quartz in granites and granitic pegmatites.
Although Na and K were also proven to be potential charge compensators (e.g. Heaney and Davis, Reference Heaney and Davis1995; Botis et al., Reference Botis and Pan2009; Luo et al., Reference Luo, Zhou, Huang, Caulfield, Zhao, Feng and Ouyang2020), these ions are more commonly hosted by micro-inclusions of minerals and fluids or accumulated along micro-fissures (e.g. Günther et al., Reference Günther, Audétat, Frischknecht and Heinrich1998, Müller et al., Reference Müller, Wiedenbeck, Van den Kerkhof, Kronz and Simon2003; Götze et al., Reference Götze, Plötze, Graupner, Hallbauer and Bray2004, Reference Götze, Pan, Müller, Kotova and Cerin2017; Sittner, Reference Sittner2019; Ladenburger et al., Reference Ladenburger, Walter, Marks and Markl2020). For instance, K is commonly associated with Al in quartz of granitic igneous rocks and pegmatites as nano-inclusions of K-feldspar or sheet silicates (e.g. Zolensky et al., Reference Zolensky, Sylvester and Paces1988; Jacamon, 2006; Jacamon and Larsen, Reference Jacamon and Larsen2009; Seifert et al., Reference Seifert, Rhede, Thomas, Förster, Lucassen, Dulski and Wirth2011). Müller et al. (Reference Müller, Wanvik, Ihlen, Götze and Möckel2012), for instance, suggested a formation of micro-inclusions with muscovite composition due to accumulation of Al and K during deformation processes. However, the majority of K, Na, Rb, Cs, Ca, Mg and Sr seems to be bound preferentially to fluid inclusions.
In general, the trace amounts of most alkali and alkali earth elements in quartz show parallel trends because of their similar geochemical behaviour (Figs 14, 15). The data indicate that the majority of elements is bound preferentially to micro-inclusions. Chemical investigations of inclusion fluids in quartz revealed that those inclusions play a major role in hosting alkali and alkali earth elements (e.g. Rossman et al., Reference Rossman, Weis and Wasserburg1987; Gerler, Reference Gerler1990; Gerler and Schnier, 1998; Günther et al., Reference Günther, Audétat, Frischknecht and Heinrich1998; Götze et al., Reference Götze, Plötze, Graupner, Hallbauer and Bray2004; Ladenburger et al., Reference Ladenburger, Walter, Marks and Markl2020). For instance, Bottrell et al. (Reference Bottrell, Yardley and Buckley1988) reported evidence for the presence of Na, K, Mg and Ca in fluid inclusions of different quartz samples.
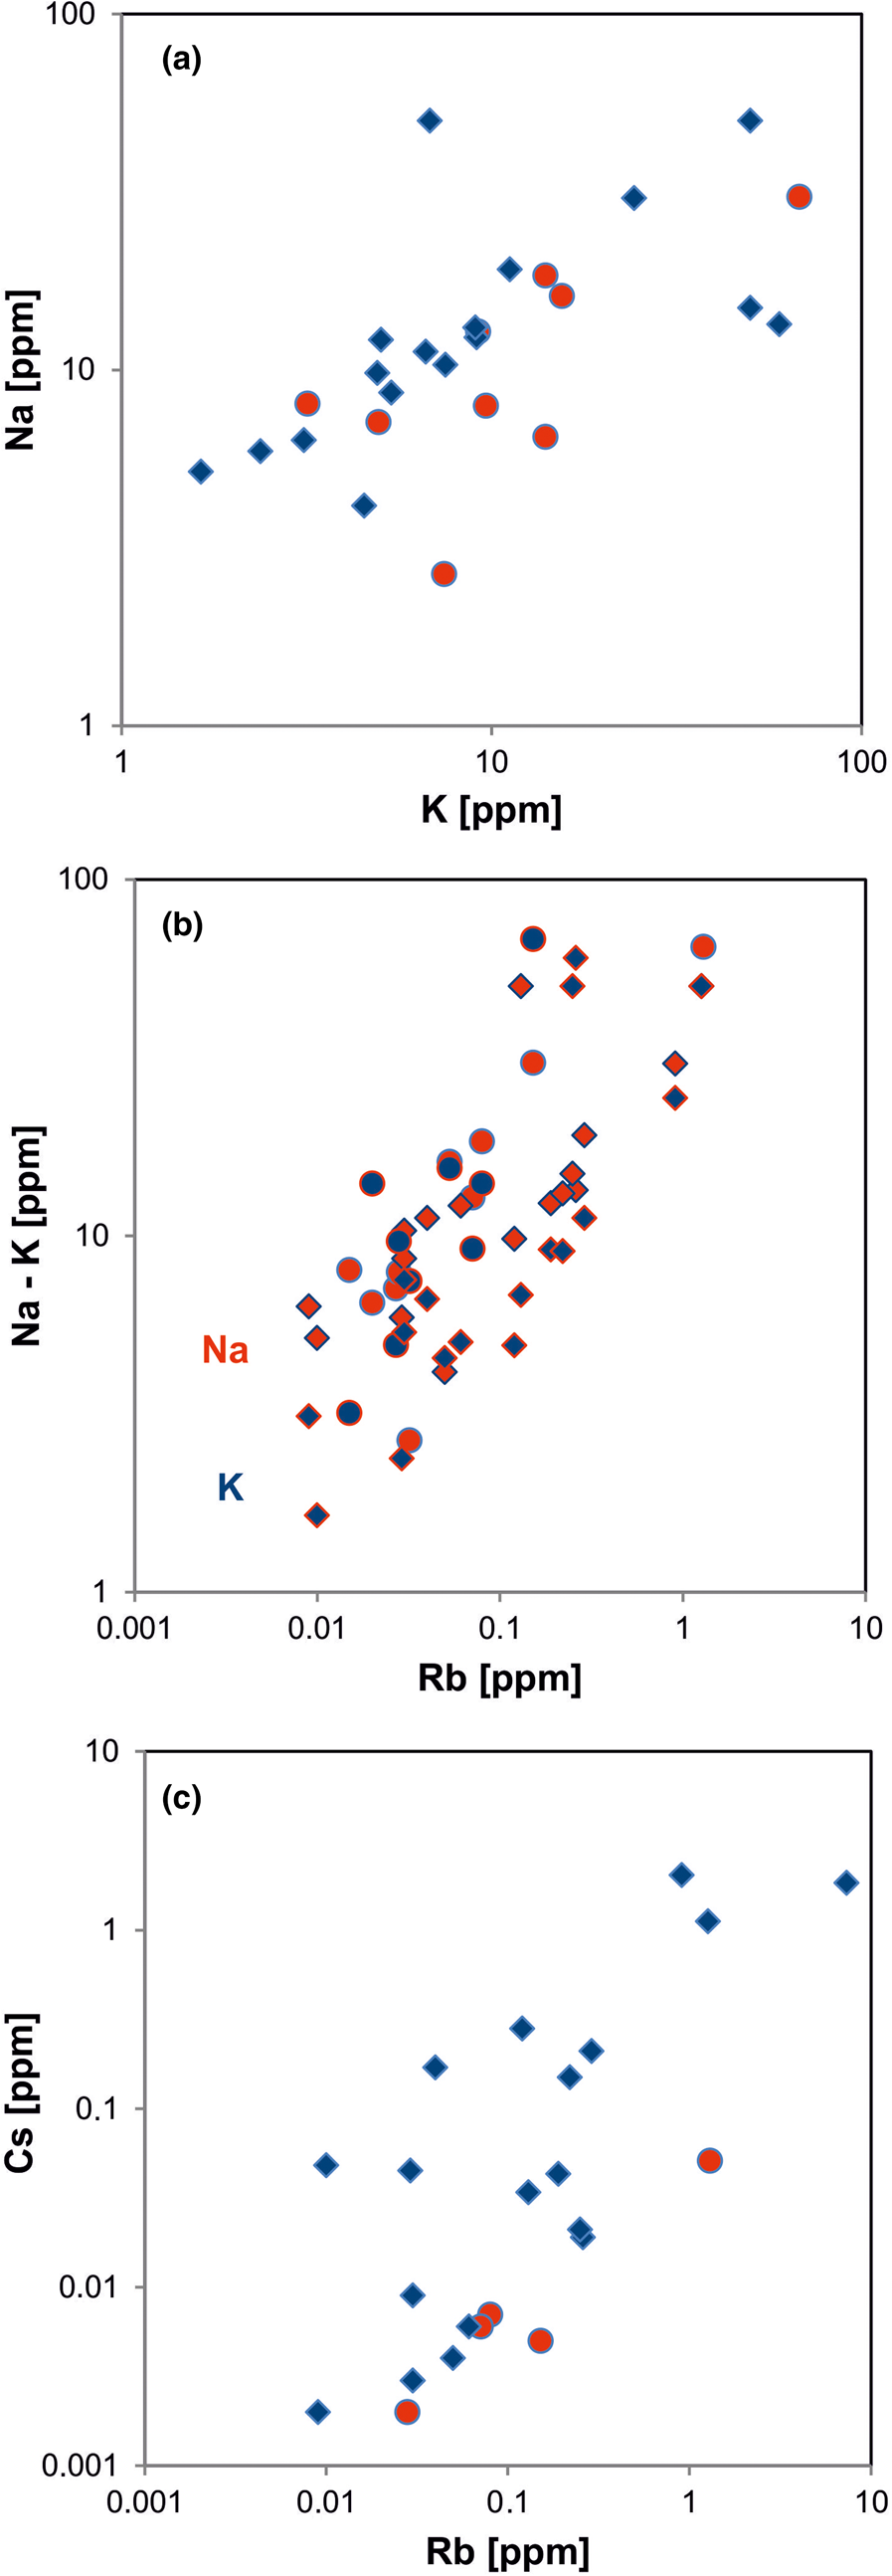
Fig. 14. Contents of alkali elements in quartz: (a) K vs. Na; (b) Rb vs. Na (red symbols) and Rb vs. K (blue symbols); (c) Rb vs. Cs. All log plots show positive trends and similar absolute concentrations of K and Na with nearly 1:1 ratio (circles = hydrothermal quartz, rhombs = pegmatite quartz; data from Götze et al. Reference Götze, Plötze, Graupner, Hallbauer and Bray2004, Reference Cerin, Götze and Pan2017).
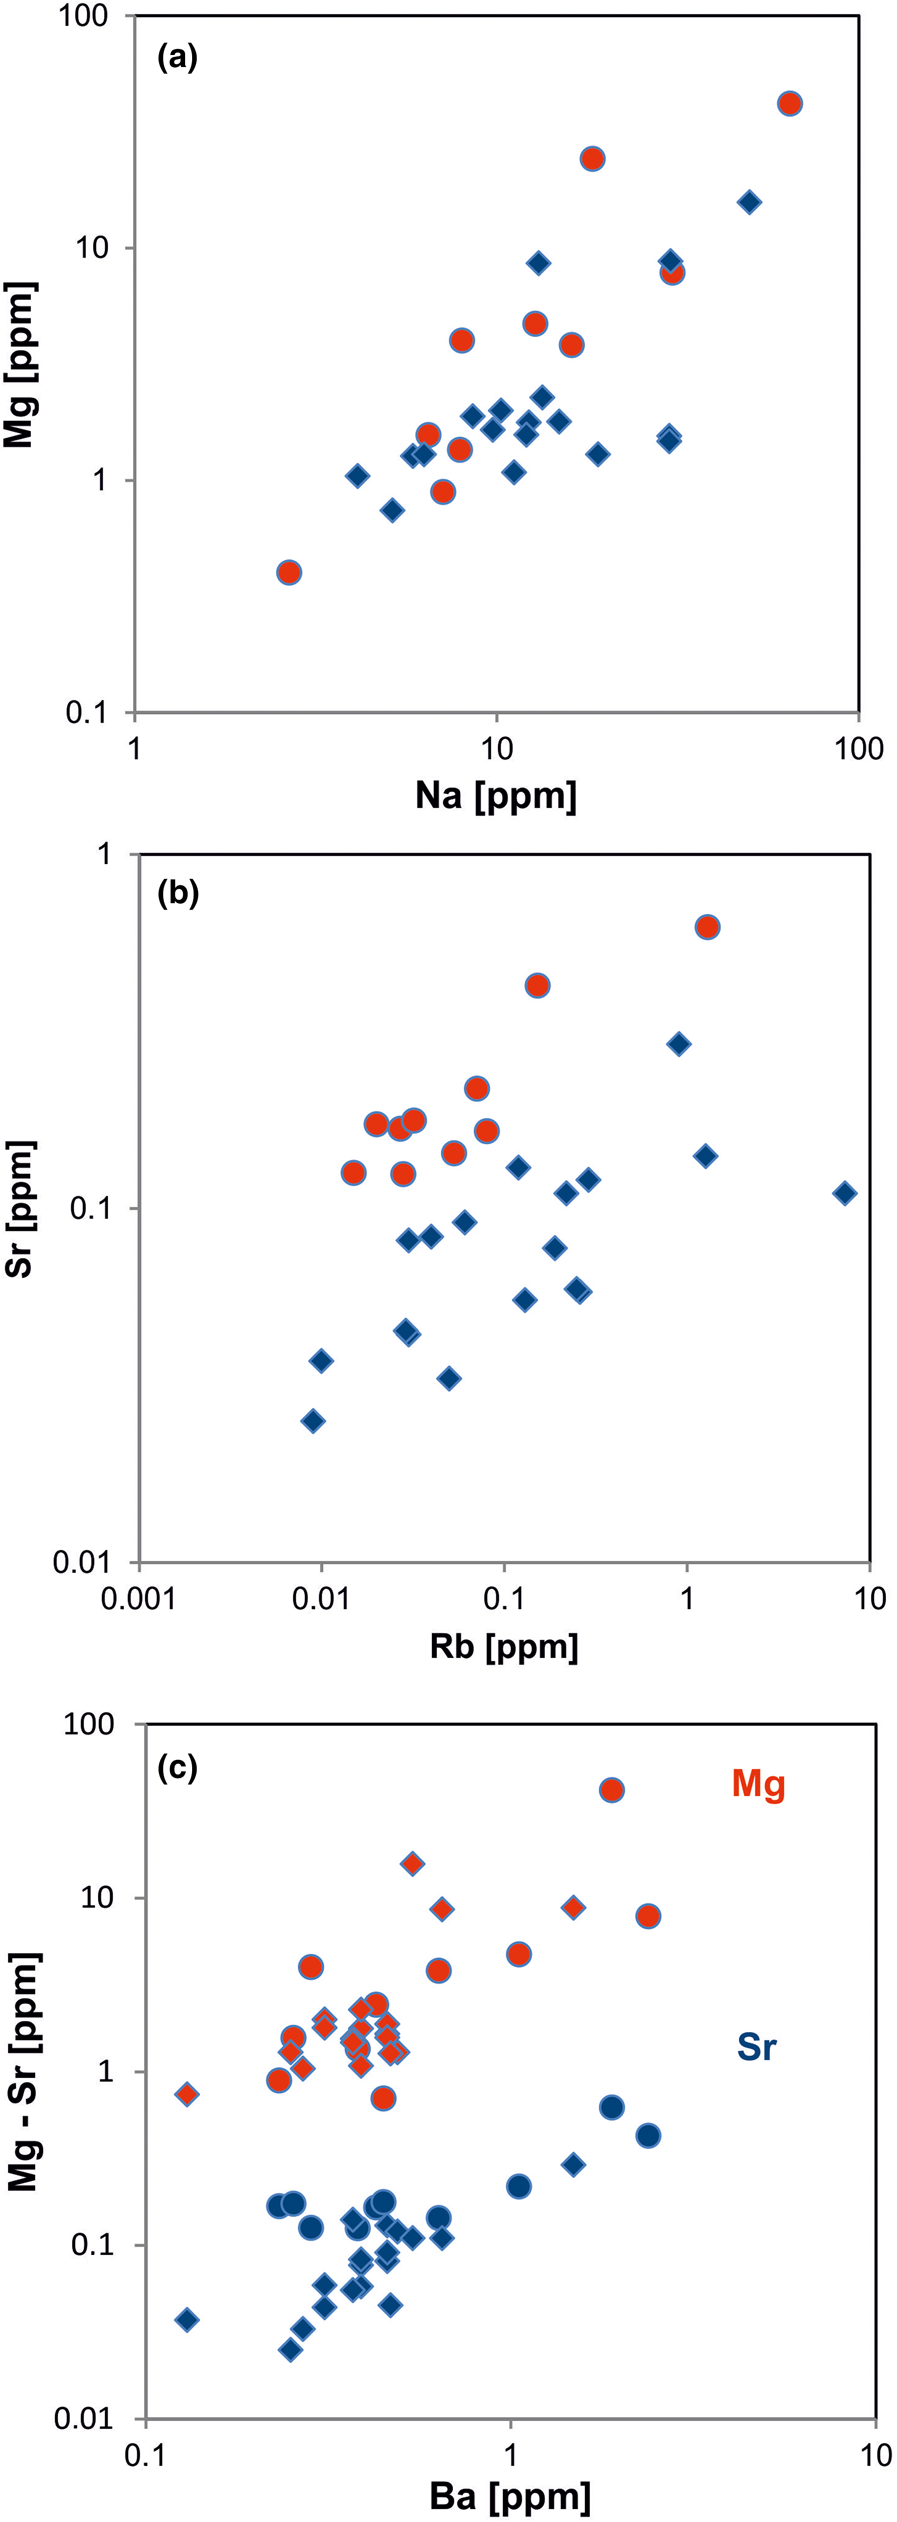
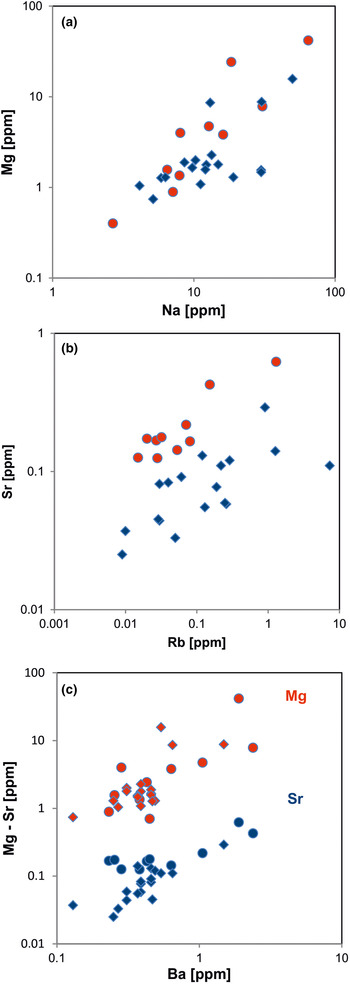
Fig. 15. Contents of alkali and alkali earth elements in quartz: (a) Na vs. Mg; (b) Rb vs. Sr; (c) Ba vs. Mg (red symbols) and Ba vs. Sr (blue symbols). All log plots show similar trends with varying absolute concentrations (Mg > Sr); note that pegmatite quartz mostly contains < 0.1 ppm Sr and hydrothermal quartz > 0.1 ppm Sr (circles = hydrothermal quartz, rhombs = pegmatite quartz; data from Götze et al. Reference Götze, Plötze, Graupner, Hallbauer and Bray2004, Reference Cerin, Götze and Pan2017).
Rare earth elements
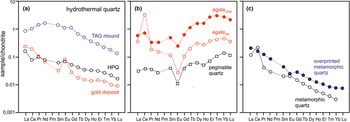
Rare earth elements (REE) generally have very low concentrations in quartz. Therefore, their absolute abundance is not typically determined. However, REE distribution patterns are commonly used for the reconstruction of mineral forming processes and thus, the distribution of REE in quartz can provide useful information about the geological environment of quartz formation (Monecke et al., Reference Monecke, Bombach, Klemm, Kempe, Götze and Wolf2000, Reference Monecke, Kempe and Götze2002; compare with Fig. 20).
Because of their crystal-chemical properties, REE cannot be incorporated into the quartz crystal structure. It is assumed that REE in quartz are hosted preferentially in fluid inclusions. Rossman et al. (Reference Rossman, Weis and Wasserburg1987), Ghazi et al. (Reference Ghazi, Vanko, Roedder and Seeley1993) and McCandless et al. (Reference McCandless, Lajack, Ruiz and Ghazi1997) reported a correlation of REE together with Rb and Sr with fluid-inclusion water indicating that these elements are mostly contained in the inclusion fluids. These results were confirmed by Götze et al. (Reference Götze, Plötze, Graupner, Hallbauer and Bray2004) for pegmatite quartz, who found a correlation of REE contents in quartz with the absolute amount of inclusion fluid (Fig. 16). On the basis of these considerations, REE may provide important fingerprints concerning the composition of mineral forming fluids.
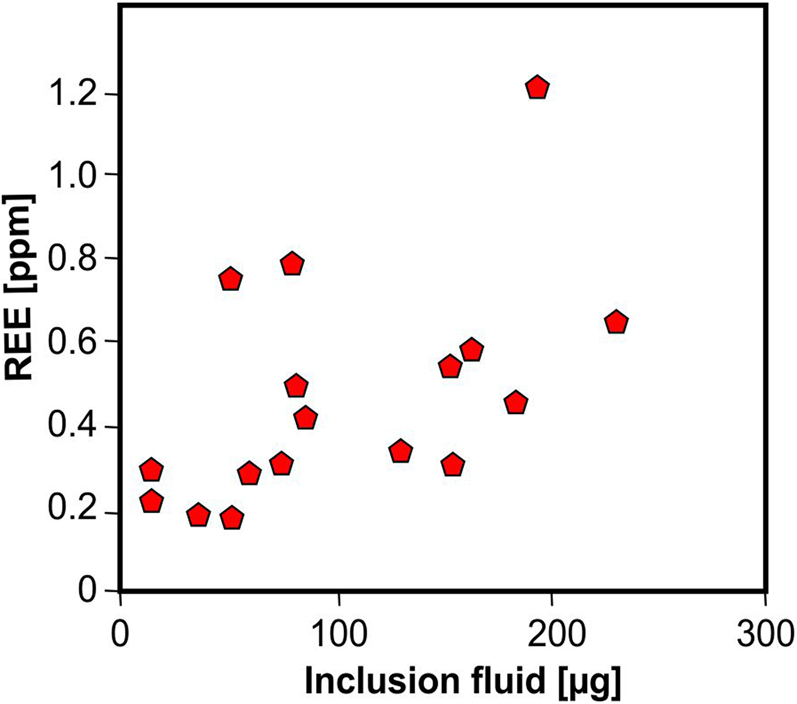
Fig. 16 Bulk REE content in pegmatite quartz plotted vs. absolute amount of inclusion fluid in the quartz samples; the correlation trend indicates the preferred accumulation of REE in fluid inclusions; the scatter can be explained by variations of their absolute concentrations in the fluid (data from Götze et al., Reference Götze, Plötze, Graupner, Hallbauer and Bray2004).
Antimony
Antimony is another trace element in quartz that can probably be related to a supply by mineralising fluids. Although the concentration of Sb in most quartz of igneous, volcanic and metamorphic rocks is far below 1 ppm (Blankenburg et al., Reference Blankenburg, Götze and Schulz1994), Rusk et al. (Reference Rusk, Koenig and Lowers2011) found detectable Sb contents in quartz of epithermal ore deposits. Antimony was measured at concentrations from <5 to ~120 ppm and concentrations fluctuated dramatically among quartz generations and growth zones. Similarly, Monnier et al. (Reference Monnier, Salvi, Pochon, Melleton, Béziat, Lach and Bailly2021) found highest Sb contents (up to 200 ppm) in quartz from stibnite-bearing veins, considerably higher than the values measured in quartz unrelated to Sb mineralisation (mainly ≤ 1 ppm). The lack of a consistent relationship between Sb and other trace elements in quartz lead to the conclusion that Sb incorporation in quartz is probably controlled by the content of Sb in the mineralising fluid (Rusk et al., Reference Rusk, Koenig and Lowers2011; Pacák et al., Reference Pacák, Zacharias and Strnad2019; Li et al., Reference Li, Hu, Xiao, Zhuo, Yan and Oyebamiji2020; Monnier et al., Reference Monnier, Salvi, Pochon, Melleton, Béziat, Lach and Bailly2021). Therefore, the Sb content in quartz might be used as a potential indicator for tracing Sb deposits.
Niobium, tantalum, uranium and thorium
For a number of elements the nature of incorporation into quartz is very difficult to determine. In particular these are elements that are present in extremely low concentrations and sometimes below the detection limit of some trace-element analytical methods (e.g. U, Th, Nb and Ta). It can be assumed that the ions are either too large to substitute for the small Si4+ ion in the quartz lattice or that they are not soluble in the mineralising fluids that accumulate in fluid inclusions. This can be observed for the immobile elements niobium and tantalum in quartz of Nb–Ta mineralisation, where the extreme low concentrations of these trace elements in associated quartz do not reflect the mineralisation and, therefore, cannot be used as petrogenetic indicators (Götze et al., Reference Götze, Plötze, Graupner, Hallbauer and Bray2004).
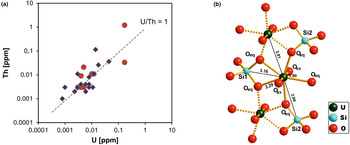
Uranium and thorium are two elements that are typically present in very low concentrations in quartz. Quartz from magmatic, metamorphic rocks and pegmatites has U and Th contents at sub-ppm levels (e.g. Gerler, Reference Gerler1990; Blankenburg et al., Reference Blankenburg, Götze and Schulz1994; Götze et al., Reference Götze, Plötze, Graupner, Hallbauer and Bray2004; Götze, Reference Götze2009). These characteristic low concentrations in quartz can be explained by the fact that the crystal-chemical properties of U and Th (in particular ion sizes) prevent a substitutional incorporation into the quartz structure. The correlation of the U and Th concentrations (Fig. 17a) indicates that traces of both elements are situated on interstitial places in the lattice or bound on submicroscopic mineral inclusions (e.g. on grain boundaries).

Fig. 17 (a) Th vs. U concentrations in quartz samples from different parent rocks and localities (data from Götze et al., Reference Götze, Plötze, Graupner, Hallbauer and Bray2004, Reference Götze, Pan, Müller, Kotova and Cerin2017; circles = hydrothermal quartz, rhombs = pegmatite quartz); (b) model of the uranyl–silicate complex in microcrystalline SiO2 with neighbouring SiO4 tetrahedra and uranyl polyhedra (modified after Pan et al., Reference Pan, Li, Feng, Wiens, Chen, Götze and Lin2021).
Unusually high U concentrations of up to >70 ppm were detected in some microcrystalline quartz and even in macrocrystalline quartz of agates from different worldwide occurrences (Götze et al., Reference Götze, Möckel, Kempe, Kapitonov and Vennemann2009, Reference Götze, Gaft and Möckel2015a). Results of CL spectroscopy indicate that U is incorporated into quartz as uranyl ions (UO22+), which are bound to the silica surface (Götze et al., Reference Götze, Gaft and Möckel2015a). The presence of uranyl ions can be confirmed easily by its characteristic green luminescence (compare Fig. 10). Recent data confirmed the binding mechanism of uranyl silicate complexes in microcrystalline SiO2 and suggested a new mechanism of uranium deposition (Fig. 17b; Pan et al., Reference Pan, Li, Feng, Wiens, Chen, Götze and Lin2021). This model involves uranyl co-precipitation during silicification without the putative reduction process and provided new aspects concerning the formation of uranium deposits.
OH
In addition to water contained in fluid or melt inclusions, quartz may incorporate different amounts of OH point defects in its structure (e.g. Kats, Reference Kats1962; Bambauer et al., Reference Bambauer, Brunner and Laves1962; Chakraborty and Lehmann, Reference Chakraborty and Lehmann1976; Stalder, Reference Stalder2021). The specific OH defects can be distinguished and quantified by Infrared (IR) spectroscopy based on their characteristic absorption bands. The most common type is the Al–OH defect followed by the Li–OH defect, whereas B–OH and hydrogarnet defects (4H) are less common. Systematic investigations of OH contents in different quartz types revealed that the incorporation of OH defects depends on the specific conditions of formation, but shows no correlation with the amount of molecular water incorporation (Baron et al., Reference Baron, Stalder, Konzett and Hauzenberger2015; Jaeger et al., Reference Jaeger, Stalder, Masago and Strasser2019; Stalder, Reference Stalder2021).
Quartz from granitic systems may show large variations in OH content with average values of ca. 20 wt. ppm (Stalder, Reference Stalder2021). It has been shown that Variscan samples with 20–35 wt. ppm OH contents have much higher values than Proterozoic samples from Scandinavia with ~3 wt. ppm (Müller and Koch-Müller, Reference Müller and Koch-Müller2009; Stalder et al., Reference Stalder, Potrafke, Billström, Skogby, Meinhold, Gögele and Berberich2017; Potrafke et al., Reference Potrafke, Breiter, Ludwig, Neuser and Stalder2020). Granitic pegmatites contain average OH contents of ca. 20 wt. ppm (Müller and Koch-Müller, Reference Müller and Koch-Müller2009). OH contents of up to 13 wt. ppm (average of 6 wt. ppm) were determined for quartz from felsic volcanic rocks. Individual phenocrysts can show strong zoning with a decrease in OH from core to rim (Tollan et al., Reference Tollan, Ellis, Troch and Neukampf2019; Jollands et al., Reference Jollands, Blanchard and Balan2020). Hydrothermal quartz crystals are also heterogeneous with respect to the OH content (0–225 wt. ppm) with the highest concentrations in the crystal centre (Kats, Reference Kats1962; Chakraborty and Lehmann, Reference Chakraborty and Lehmann1976). The lowest OH contents (mostly <5 wt. ppm) were measured in quartz from metamorphic rocks (Müller and Koch-Müller, Reference Müller and Koch-Müller2009; Stalder et al., Reference Stalder, Potrafke, Billström, Skogby, Meinhold, Gögele and Berberich2017).
A thorough review about OH defects in quartz has been given recently by Stalder (Reference Stalder2021).
Geological implications of quartz properties
Depending on the specific conditions of formation, quartz can develop characteristic chemical, physical and morphological properties (indicator properties), which range from the atomic scale (point defects) up to macroscopic appearance and crystal morphology. Knowledge about such characteristic features is indispensable for the recognition of any relationships between quartz genesis, its specific properties and possible industrial applications.
Trace elements in quartz as petrogenetic indicators
The trace-element distribution in quartz from different rock types can provide useful information about the formation history of these rocks, as they are highly sensitive to crystallisation and fractionation processes. For instance, trace elements in granites and granitic pegmatites reflect the evolution of the melt and can therefore be used as petrogenetic indicators. Elements such as K, Fe and Ti are geochemically compatible and therefore have the highest concentrations in early formed quartz. In contrast, P, Ge, Rb and Li are relatively incompatible resulting in elevated concentrations in quartz that formed in more evolved granitic melts and/or residual fluids (Schrön et al., Reference Schrön, Baumann and Rank1982, Reference Schrön, Schmädicke, Thomas and Schmidt1988; Larsen et al., Reference Larsen, Henderson, Ihlen and Jacamon2004; Beurlen et al., Reference Beurlen, Müller, Silva and Da Silva2011; Monnier et al., Reference Monnier, Lach, Salvi, Melleton, Bailly, Béziat, Monnier and Gouy2018; Müller et al., Reference Müller, Romer and Pedersen2017; Breiter et al., Reference Breiter, Ďurišová and Dosbaba2020).
Larsen et al. (Reference Larsen, Henderson, Ihlen and Jacamon2004) suggested the Ge/Ti ratio is robust during sub-solidus processes in igneous systems and concluded that it represents a strong index for the evolution of melt differentiation in granitic igneous rocks, and has potential as an igneous geothermometer (Jacomon and Larsen, Reference Jacamon and Larsen2009). The Ge/Ti ratio is a reliable melt fractionation index as Ti in quartz is a function of magma temperature and Ti melt saturation and, thus, decreases with melt differentiation, whereas Ge increases with the melt fractionation degree. A similar behaviour was proposed for the Ge/Fe ratio in quartz (Schrön, Reference Schrön, Baumann and Rank1982, Reference Schrön, Schmädicke, Thomas and Schmidt1988). However, as noted above most of the detected elevated contents of Fe in quartz are related to micro-inclusions of Fe-bearing minerals. Thus, the ratio should not be used for genetic interpretations.
Schrön et al. (Reference Schrön, Schmädicke, Thomas and Schmidt1988) noticed that elevated Ge concentrations are found in pegmatitic quartz compared to quartz from granites and rhyolites, and established the Ti ‒ Al/10 – 10Ge ternary discrimination diagram, which is still used widely. Most recently Breiter et al. (Reference Breiter, Ďurišová and Dosbaba2020) proposed that this diagram does not only enable the discrimination between pegmatitic and granitic quartz, but also permits, to some extent, discrimination between common and rare-metal, and between S- and A-type granites (Fig. 18).

Fig. 18. Triangle for discrimination of S-type granites, A-type granites and pegmatites (modified after Breiter et al., Reference Breiter, Ďurišová and Dosbaba2020); the arrows indicate evolution trends during magma fractionation.
A steady increase in the Ge/Al values in quartz during the transition from magmatic to hydrothermal stages related to rare metal mineralised systems was reported by Müller et al. (Reference Müller, Herklotz and Giegling2018) and Breiter et al. (Reference Breiter, Ďurišová and Dosbaba2020). In the case of the Zinnwald/Cinovec Sn–W–Li greisen-type deposit the value of Ge/Al = 0.008 is a discriminator between magmatic and hydrothermal quartz (Müller et al., Reference Müller, Herklotz and Giegling2018). In the case of the Panasqueira W deposit, the value of Ge/Al = 0.01 was found to discriminate most of the magmatic quartz from hydrothermal quartz (Breiter et al., Reference Breiter, Ďurišová and Dosbaba2020).
Breiter and Müller (Reference Breiter and Müller2009) also detected decreasing Ti content in granitic quartz with increasing fractionation. In contrast, Al contents in quartz increased from the early to the late population independent of the peraluminosity of the melt, resulting in a negative correlation between the Al and Ti contents. Accordingly, the Ti vs. Al diagram seems to be the most valuable indicator for the evolution of the melt from which the quartz crystallised (Müller et al., Reference Müller, Kronz and Breiter2002, Reference Müller, Wiedenbeck, Van den Kerkhof, Kronz and Simon2003, Reference Müller, Romer and Pedersen2017; Breiter and Müller, Reference Breiter and Müller2009; Jacamon and Larsen, Reference Jacamon and Larsen2009; Breiter et al., Reference Breiter, Svojtka, Ackerman and Švecová2012; Peterková and Dolejš, Reference Peterková and Dolejš2019). These general trends were also found in quartz from plutons of different geochemical character (Breiter et al., Reference Breiter, Ackerman, Svojtka and Müller2013; Hong et al., Reference Hong, Cooke, Zhang, Fox and Thompson2019). The Ge/Ti vs. Al/Ti plot shows a positive correlation reflecting the fractionation trend of granitic melts (Breiter et al., Reference Breiter, Ďurišová and Dosbaba2020).
The trace-element composition of quartz from hydrothermal environments also provides information about primary crystallisation conditions, the mineralisation regime in hydrothermal ore deposits as well as about processes of secondary hydrothermal overprint in different types of host rocks (e.g. Monecke et al., Reference Monecke, Kempe and Götze2002; Rusk et al., Reference Rusk, Lowers and Reed2008, 2012; Jourdan et al., Reference Jourdan, Vennemann, Mullis, Ramseyer and Spiers2009; Luo et al., Reference Luo, Zhou, Huang, Caulfield, Zhao, Feng and Ouyang2020). For instance, Jourdan et al. (Reference Jourdan, Vennemann, Mullis, Ramseyer and Spiers2009) reported Al and Li concentrations of more than several hundreds of ppm for distinct growth zones within hydrothermal quartz crystals formed at temperatures of about 300°C or less. These quartz crystals also displayed patterns of cyclic growth under CL. In contrast, quartz crystals formed at temperatures closer to 400°C and without visible cyclic growth have low concentrations of Al, Li and other trace elements.
Such variations were also reported in different quartz generations of ore mineralisation (Rusk et al., Reference Rusk, Reed, Dilles and Kent2006, Reference Rusk, Lowers and Reed2008, Reference Rusk, Koenig and Lowers2011; Luo et al., Reference Luo, Zhou, Huang, Caulfield, Zhao, Feng and Ouyang2020). The variations of trace elements such as Ti, Al, Li, K or Na might be related to variations in the pressure and temperature regime, but can also result from fluctuations of the pH and composition of the mineralising solutions or crystallisation rate rather than changes in temperature. Rusk (Reference Rusk, Götze and Möckel2012) investigated quartz from almost 30 hydrothermal ore deposits including porphyry-type (Cu–Mo–Au) deposits, orogenic Au deposits, and epithermal deposits and concluded that each of these ore types can be distinguished from one another on the basis of Al and Ti concentrations alone. The temperature dependence of Ti incorporation was used to establish an Al versus Ti discrimination diagram of quartz based on the observation that the Ti content, and to the same extent the Al content, vary systematically among these ore deposit types (Fig. 19).
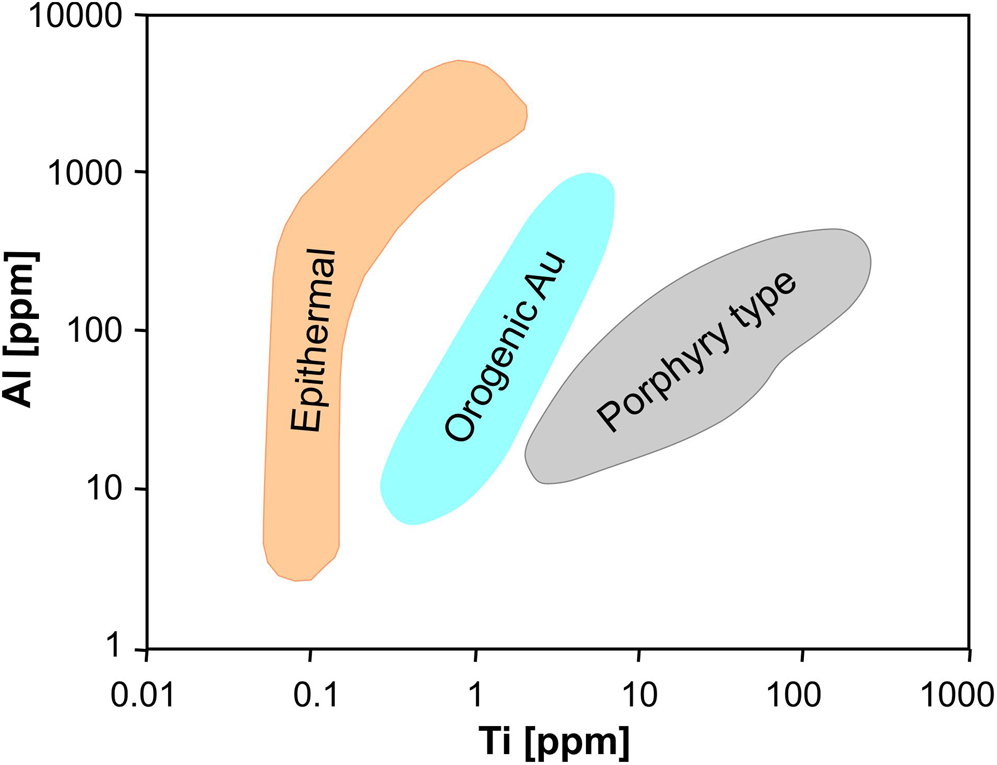
Fig. 19. Log plot of Ti vs. Al contents in quartz for the discrimination of hydrothermal quartz originating from epithermal, orogenic Au and porphyry type deposits (modified after Rusk, Reference Rusk, Götze and Möckel2012).
Most porphyry-type quartz contains 1–200 ppm Ti and 50–500 ppm Al showing a linear correlation with an Al/Ti ratio between 1 and 10. In contrast, quartz from epithermal ore deposits always contains < 3 ppm Ti with a wide scatter of Al between 20 and 4000 ppm (Al/Ti ratios 100–10,000), whereas quartz from orogenic Au deposits mostly has 100–1000 ppm Al and 1–10 ppm Ti (Al/Ti ratio 10–100; Rusk, Reference Rusk, Götze and Möckel2012). These systematic variations in trace-element concentration reflect the different physical and chemical conditions during quartz formation.
Concentrations of REE in quartz can also be used as valuable indicators for geological and/or geochemical processes, as they can reflect the evolution of mineralising fluid and melt compositions. Thus, REE distribution patterns contain important information concerning the primary conditions of quartz formation and also information about secondary effects (Fig. 20). The general shape of the REE distribution and the relationships between light, middle and heavy REE indicate the source of the silica-bearing fluids and the influence of the complexation of the REE during transport (Lipin and McKay, Reference Lipin and McKay1986). Moreover, negative and positive anomalies of Ce and Eu can reflect adopted properties from the mineralising fluids and/or variations in redox conditions resulting in a change of the valence state of the ions (Fig. 20).
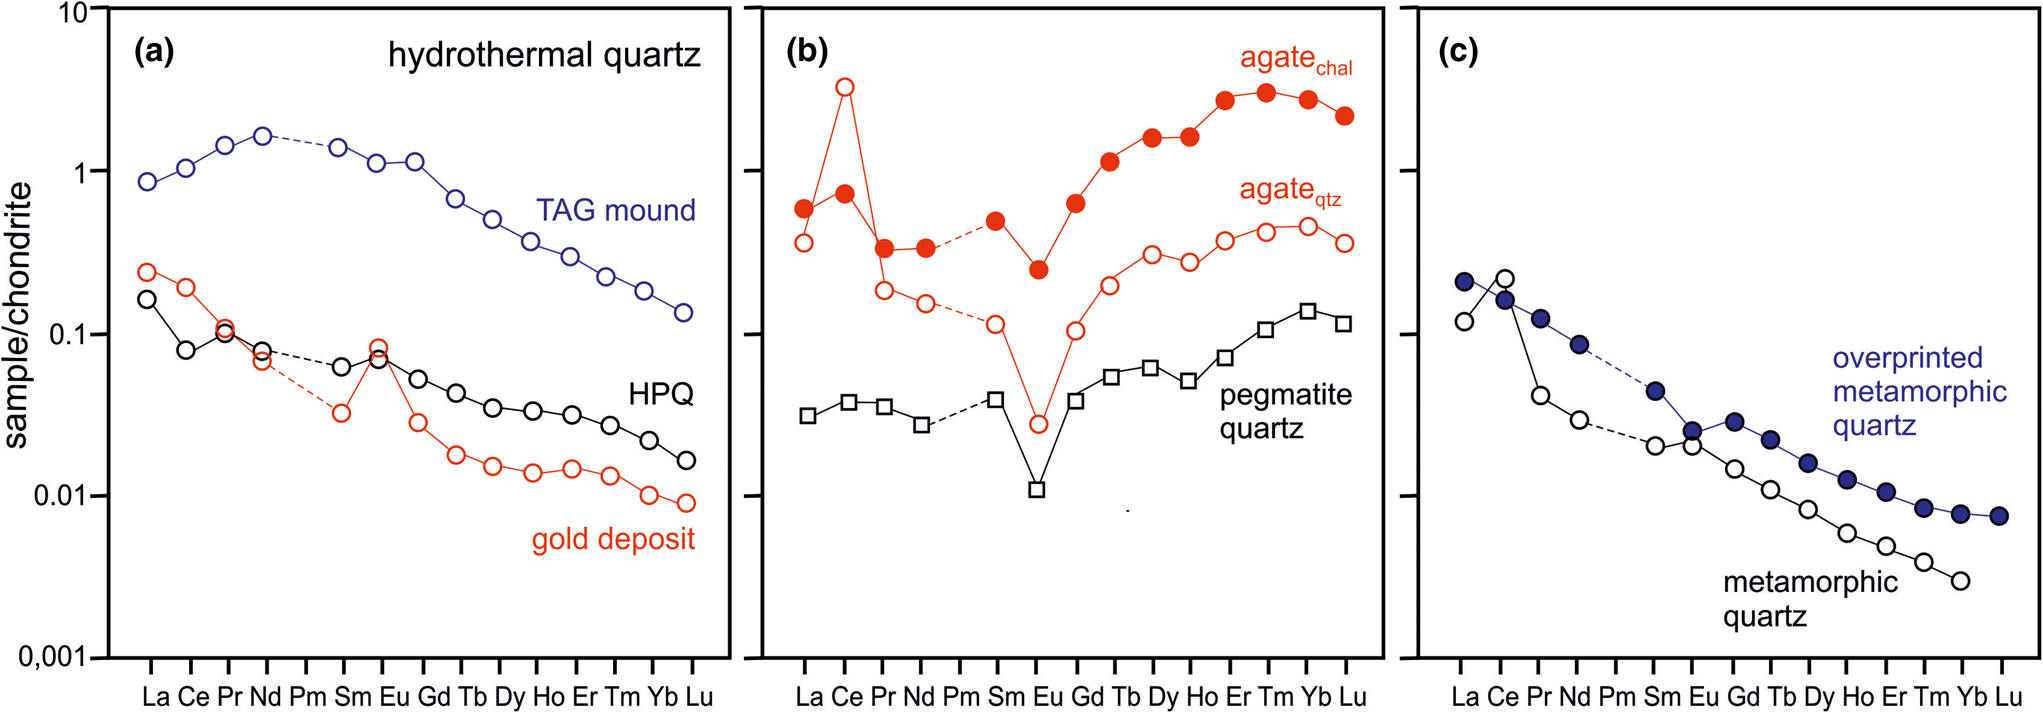
Fig. 20. Chondrite-normalised REE distribution patterns of quartz from different geological environments: (a) hydrothermal quartz from the TAG mound (Mid-Atlantic Ridge), high-purity quartz (HPQ) from Vjazovka (Ural region, Russia) and from the gold deposit Muruntau/Myutenbai (Uzbekistan); (b) pegmatite quartz from Hittero (Norway) and macrocrystalline (agateqtz) as well as chalcedony (agatechal) of an agate from Hohenstein-Ernstthal (Saxony, Germany) both showing positive Ce-anomalies, negative Eu-anomalies and tetrad effects; (c) metamorphic quartz from the Middle Erzgebirge (Germany) and overprinted counterpart from the area of tin mineralisation; (data from Monecke et al., Reference Monecke, Bombach, Klemm, Kempe, Götze and Wolf2000, Reference Monecke, Kempe and Götze2002; Götze et al., Reference Götze, Plötze, Graupner, Hallbauer and Bray2004, Reference Götze, Möckel, Vennemann and Müller2016, Reference Cerin, Götze and Pan2017).
The hydrothermal quartz samples in Fig. 20a represent different hydrothermal systems and accordingly display characteristic REE distribution patterns. The chondrite-normalised REE distribution pattern of the hydrothermal quartz from the Trans-Atlantic Geotraverse (TAG) mound in the Mid-Atlantic Ridge (Fig. 20a) is bell-shaped with no significant Ce or Eu anomaly. This REE distribution can be related to the origin and evolution of the fluids within the hydrothermal system that is related to an actively forming sulfide deposit (Monecke et al., Reference Monecke, Kempe, Petersen, Götze, Herzig, Wolf and Stanley1999). In contrast, the high-purity quartz from Vjazovka (Ural region, Russia) and the quartz from the hydrothermal gold deposit show typical crustal signatures with a smooth chondrite-normalised REE pattern with decreasing REE concentrations from La to Lu. The negative Ce- and positive Eu-anomalies, result from the evolution of the hydrothermal fluids in the deposits and their interactions with the surrounding wall rocks.
Unusual REE fractionation and the development of tetrad effects (Fig. 20b) can be related to fluid immiscibility and preferential partitioning of the REE between the vapour and coexisting liquid (Monecke et al., Reference Monecke, Dulski and Kempe2007). Tetrad effects were observed both in quartz of pegmatites (Götze et al., Reference Götze, Plötze, Graupner, Hallbauer and Bray2004) and quartz of agates in acidic volcanic rocks (Götze et al., Reference Götze, Möckel, Vennemann and Müller2016) and probably reflect the participation of volatiles during SiO2 accumulation and crystallisation. The marked increase of heavy REE indicates the complexation of REE by fluorine or carbonate complexes (Wood, Reference Wood1990).
The hydrothermal overprint of crystalline host rocks in the vicinity of ore deposits can also result in a change of the REE distribution pattern. An example from quartz in unaltered metamorphic host rocks located distal to the alteration halo within a tin deposit is shown in Fig. 20c. The hydrothermally overprinted quartz shows REE signatures that deviate significantly from the unaltered equivalent. These differences are interpreted to result from the interaction of the pre-existing quartz with the hydrothermal fluids (Monecke et al., 2004).
Several studies have shown that the trace-element composition of quartz can be used to fingerprint the source of detrital quartz grains in clastic sediments (Götze and Zimmerle, Reference Götze and Zimmerle2000). Quartz can retain chemical signatures of the source rocks because of its common occurrence and relative mechanical and chemical stability during sedimentary processes. These geochemical signatures can be used to reveal the origin and provenance of individual quartz grains within sediments. Differences in the distribution of selected trace elements and/or trace-element ratios may be related to inherent characteristics of the source and can be used as discriminating tools (e.g. Dennen, Reference Dennen1967; Hallbauer, Reference Hallbauer1992; Götze and Lewis, Reference Götze and Lewis1994; Müller and Knies, Reference Müller and Knies2013; Ackerson et al., Reference Ackerson, Tailby and Watson2015; Stalder et al., Reference Stalder, von Eynatten, Costamoling, Potrafke, Dunkl and Meinhold2019).
Another common feature in sedimentary and diagenetic environments is secondary quartz neomorphism as quartz overgrowth cements in sandstones or isolated euhedral quartz crystals in various sedimentary host rock. Authigenic quartz cements play a major role in controlling the hydraulic properties and quality of reservoir sandstones (McBride, Reference McBride1989). The combination of trace-element studies with other analytical methods (e.g. CL, fluid inclusion and isotope studies) can provide important information about timing of quartz cementation and the burial history of sandstones or concerning temperature and salinity of fluids during precipitation (e.g. Burley et al., Reference Burley, Mullis and Matter1989; Kelly et al., Reference Kelly, Fu, Kita and Valley2007; Lehmann et al., Reference Lehmann, Pettke and Ramseyer2011).
Moreover, some investigations have used complex geochemical and mineralogical studies for the reconstruction of silica sources and diagenetic conditions during the formation of euhedral authigenic quartz crystals in soil, limestones and carbonates, sulfate and salt deposits as well as bituminous coal and lignite (e.g. Füchtbauer, Reference Füchtbauer1961; Grimm, Reference Grimm1962; Fabricius, Reference Fabricius1987; Richter, Reference Richter1971; Friedman and Shukla, Reference Friedman and Shukla1980; Ruppert et al., 1985; Soong and Blattner, Reference Soong and Blattner1986; Götze, Reference Götze, Götze and Möckel2012b). The resulting mineralogical and geochemical characteristics show that the authigenic quartz from the various sedimentary environments differs clearly from quartz of crystalline rocks and a distinction between quartz from different sedimentary environments is possible.
Interpretation of CL and trace-element data
In general, quartz commonly shows growth zoning in CL, reflecting either variations of the composition of the crystallisation medium (melt or fluid) or changing physicochemical conditions (temperature, Eh, pH). Therefore, combined CL and trace-element studies have significant potential for the reconstruction of crystallisation sequences in magmatic and hydrothermal systems (e.g. Kempe et al., Reference Kempe, Götze, Dandar and Habermann1999; Landtwing and Pettke, Reference Landtwing and Pettke2005; Müller et al., Reference Müller, Breiter, Seltmann and Pécskay2005, 2010; Jourdan et al., Reference Jourdan, Vennemann, Mullis, Ramseyer and Spiers2009; Götte et al., Reference Götte, Pettke, Ramseyer, Koch-Müller and Mullis2011; Audétat, Reference Audétat2013; Mao et al., Reference Mao, Rusk, Yang and Zhang2017; Wertich et al., Reference Wertich, Leichmann, Dosbaba and Götze2018; Wang et al., Reference Wang, Liu, Carranza, Zhai, Wang, Zhen, Wang, Wang, Liu and Zhang2019; Luo et al., Reference Luo, Zhou, Huang, Caulfield, Zhao, Feng and Ouyang2020; Lan et al., Reference Lan, Lin, Fu and Luo2021).
Although a correlation of the CL response and the concentration of trace elements has been noted by several authors (e.g. Watt et al., Reference Watt, Wright, Galloway and McLean1997; Müller et al., Reference Müller, Wiedenbeck, Van den Kerkhof, Kronz and Simon2003; Rusk et al., Reference Rusk, Reed, Dilles and Kent2006, Reference Rusk, Lowers and Reed2008, Reference Rusk, Koenig and Lowers2011; Lehmann et al., Reference Lehmann, Pettke and Ramseyer2011; Leeman et al., Reference Leeman, McRae, Wilson, Torpy, Lee, Student, Thomas and Vicenzi2012), CL zoning (in particular in panchromatic CL images) in quartz cannot be related solely to variations in the trace-element concentration. For instance, Watt et al. (Reference Watt, Wright, Galloway and McLean1997) analysed volcanic quartz phenocrysts and xenocrysts by ion microprobe (SIMS) and found higher Al contents in areas of bright CL emission, though they suggested that other factors (e.g. the effect of growth rate on defect density) may also play a major role in controlling CL intensity. Several important aspects limit the possible correlation between the abundance of specific trace elements and visible CL colours or CL zoning.
In summary, it must be emphasised that most of the CL emissions in quartz are related to intrinsic lattice defects and not to trace elements. Therefore, a correlation of CL response to trace elements is often very equivocal. Among the detectable trace elements in quartz only a few of them act as activators for CL emission (compare Table 1). Only Al, Ti and charge compensating alkali ions in hydrothermal and pegmatite quartz sometimes show relations to visible CL behaviour. Most of the inherited trace elements in quartz have no influence on the CL behaviour. To attempt to correlate the concentration of selected trace elements with the visible CL is not reasonable. Spectral CL measurements are necessary and it is only possible to compare trace-element variations with specific individual CL emission bands. In most cases, the bulk CL emission consists of different emission bands and thus, represents a mixture of point defects responsible for the CL signal. Therefore, correlative relations between the CL and single trace elements are very difficult or impossible. In addition, the complexity of the luminescence process and analytical conditions hamper a clear quantitative evaluation of the CL spectra (Habermann, Reference Habermann2002; Götze, Reference Götze2012a).
The example in Fig. 21 illustrates these complex relationships and demonstrates possible misinterpretations. The hydrothermal quartz crystal exhibits marked zoning in panchromatic CL (Fig. 21a), visible by variations in the intensity of the bulk (cumulative) CL signal (bright and dark zones). Local measurements of the Al content show the dark zones have the highest concentrations (300 ppm) and the bright zones have low (<50 ppm) and not detectable Al concentrations. Attempting to correlate the Al concentration with the panchromatic CL intensity would result in the conclusion that Al correlates negatively with the CL intensity (brightness). However, the corresponding true colour CL image (Fig. 21b) demonstrates that the dark zones exhibit blue CL, whereas bright areas are dominated by yellow CL. Related CL spectra of these zones (Fig. 21c) reveal that the dark areas (transient blue CL) are caused by activation due to Al defects ([AlO4/M+] centres), whereas the bright areas (yellow CL) have no relation to trace elements and are exclusively due to structural defects (e.g. STE). In conclusion, the visible zoning in brightness in panchromatic CL (Fig. 21a) is caused mainly by lattice defects and is essentially not related to trace-element variations. This interpretation was only possible by the application of CL spectroscopy.
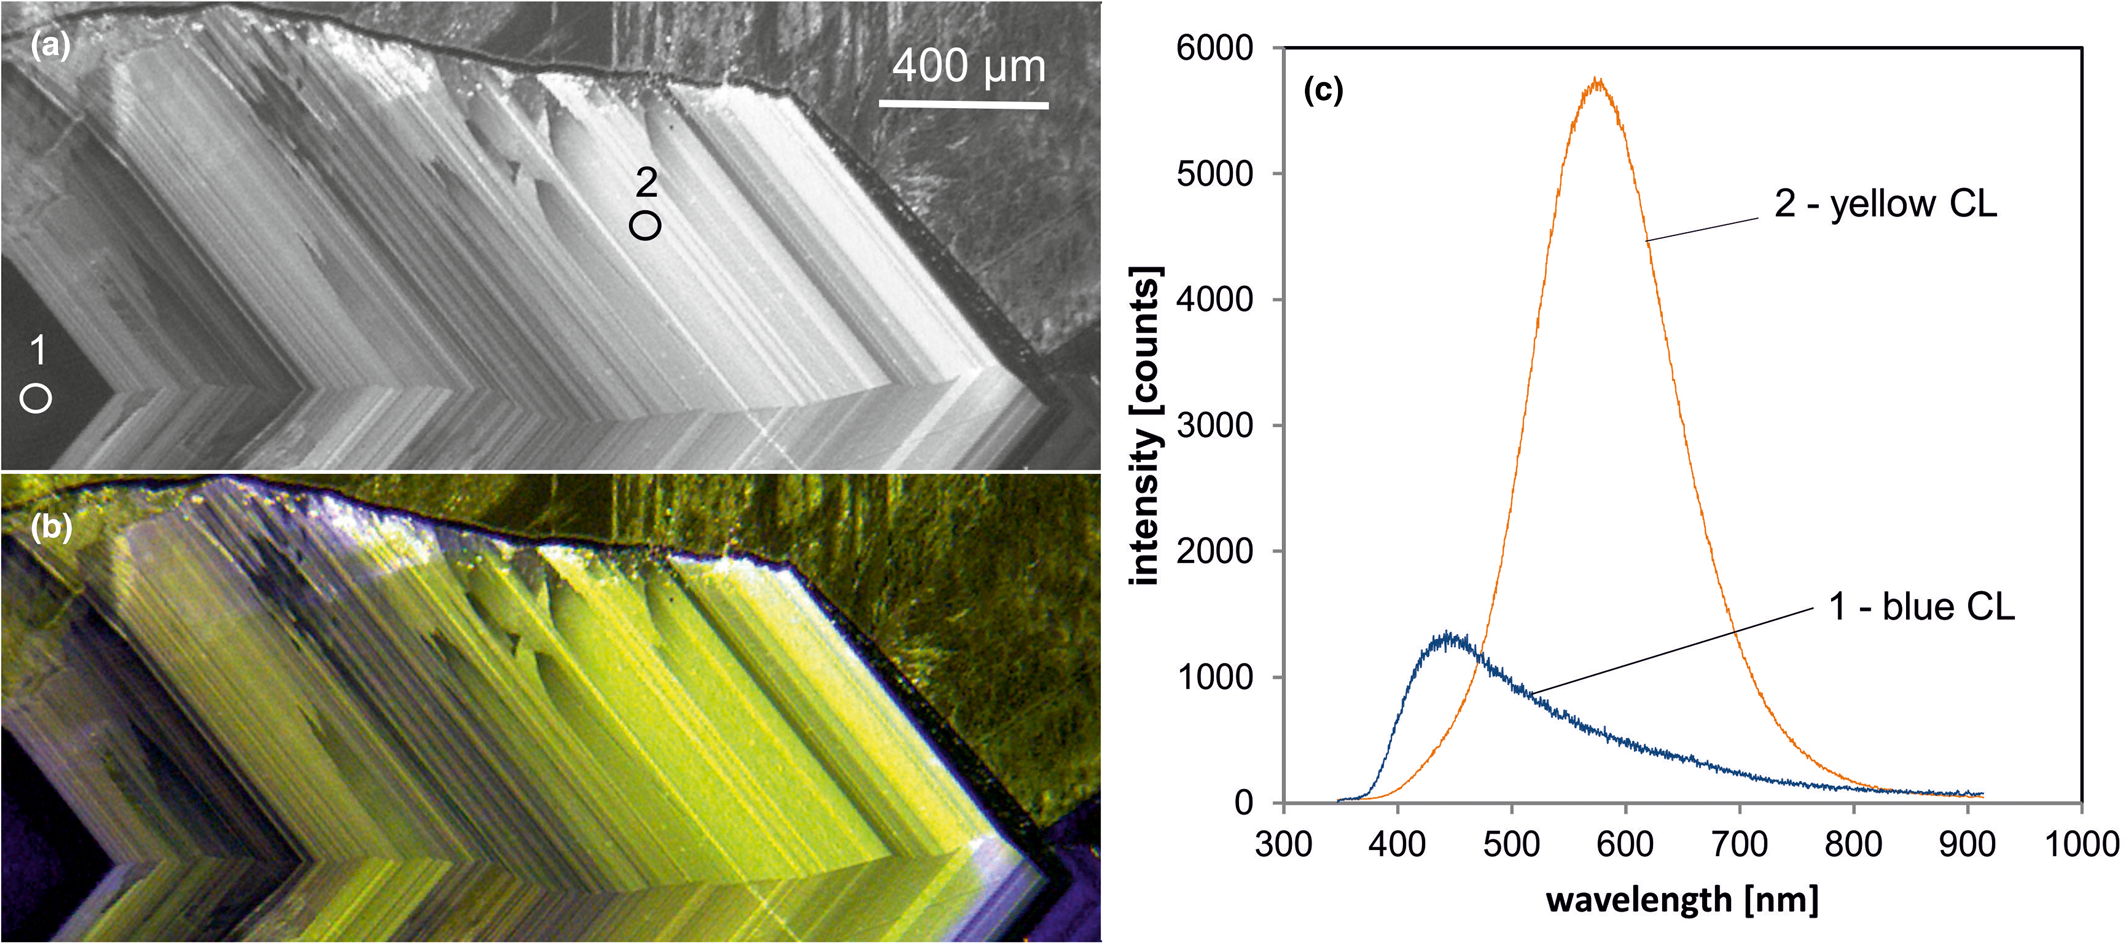
Fig. 21 Photomicrographs of intensely zoned hydrothermal quartz from Chemnitz (Saxony, Germany) in panchromatic CL (a) and true colour optical microscopy–cathodluminescence image (b); the dark luminescent zones in panchromatic CL (blue CL zones in b) have elevated Al concentrations up to 300 ppm, whereas the bright zones in panchromatic CL (yellow in b) have mostly low (< 50 ppm) or no detectable Al contents; Ti concentrations are generally < 10 ppm. (c) The spectra reveal that the blue CL (1) is caused by the incorporation of structural Al ([AlO4/M+] centre), the yellow CL (2) is related mainly to structural defects (e.g. STE) and not to trace elements; the circles in (a) mark the positions of spectral CL analyses.
This example shows the essential problems with CL data, in particular for the interpretation of panchromatic CL images. Even the combination of CL spectroscopy with local trace-element analysis never provides a quantitative relationship between trace elements and the intensity of specific emission bands. For instance, Götte et al. (Reference Götte, Pettke, Ramseyer, Koch-Müller and Mullis2011) demonstrated the correspondence of Li abundances with [AlO4|Li+]– defects and the transient CL emission at 395 nm in hydrothermal quartz, however they found inconsistencies with a simple causal relationship between Al-Li centres and the 395 nm emission band. They assumed that the conversion of [AlO4|Li+] centres to [AlO4]0 centres by natural irradiation and/or the existence of intrinsic defects such as oxygen deficiency centres can affect the luminescence properties. Similar results were reported by Sittner (Reference Sittner2019) for the CL of pegmatite quartz. The 500 nm emission band could clearly be ascribed to structurally incorporated Li, but a clear quantitative correlation between Li concentration and intensity of the 500 nm emission band was missing. The incorporation of other monovalent cations and the charge-compensation of Al3+ by electron defects were discussed as possible explanations.
Another problem is the ongoing discussion about the role of Ti as an activator of CL in quartz. Observations about correlations between the Ti content in quartz and the CL intensity resulted in the conclusion that the blue CL emission band at 450 nm might be activated by Ti (e.g. Müller et al., Reference Müller, Kronz and Breiter2002, Reference Müller, Wiedenbeck, Van den Kerkhof, Kronz and Simon2003; Van den Kerkhof et al. Reference Van den Kerkhof, Kronz, Simon and Scherer2004; Rusk et al., Reference Rusk, Lowers and Reed2008; Drivenes et al., Reference Drivenes, Larsen, Müller and Sørensen2016). First attempts have been made to quantify the Ti concentration in quartz by using the intensity of the 450 nm emission band (Leeman et al., Reference Leeman, McRae, Wilson, Torpy, Lee, Student, Thomas and Vicenzi2012). These assumptions are in sharp contrast to previous investigations, which have provided evidence by spectroscopic methods that the blue 450 nm emission can be related to oxygen deficiency centres (ODC) (e.g. Stevens-Kalceff and Phillips, Reference Stevens-Kalceff and Phillips1995; Skuja, Reference Skuja1998; Stevens-Kalceff, Reference Stevens-Kalceff2009).
Recent studies on quartz of different origin and containing different concentrations of Ti revealed that structural defects not related to trace elements (self-trapped exciton – STE) and also incorporation of Ti into the quartz structure can both activate a blue CL emission at the same position (450 nm, 2.75 eV; unpublished data). The STE-activated CL emission is unstable under the electron beam and in particular detectable in quartz with low Ti contents (e.g. high-purity hydrothermal quartz), whereas high Ti concentrations (e.g. in quartz phenocrysts of rhyolites) result in a stable CL emission (Fig. 22). In conclusion, even in the case of Ti activation of the 450 nm luminescence emission in quartz, the superposition with the STE emission at the same position would prevent any serious quantitative evaluation of the CL signal. A reliable distinction of the two different CL emissions at 450 nm is only possible by time-resolved CL spectroscopy combined with EPR spectroscopy and trace-element analysis of the Ti concentration. This example emphasises that the correlation of CL and trace-element data has to be done with caution.
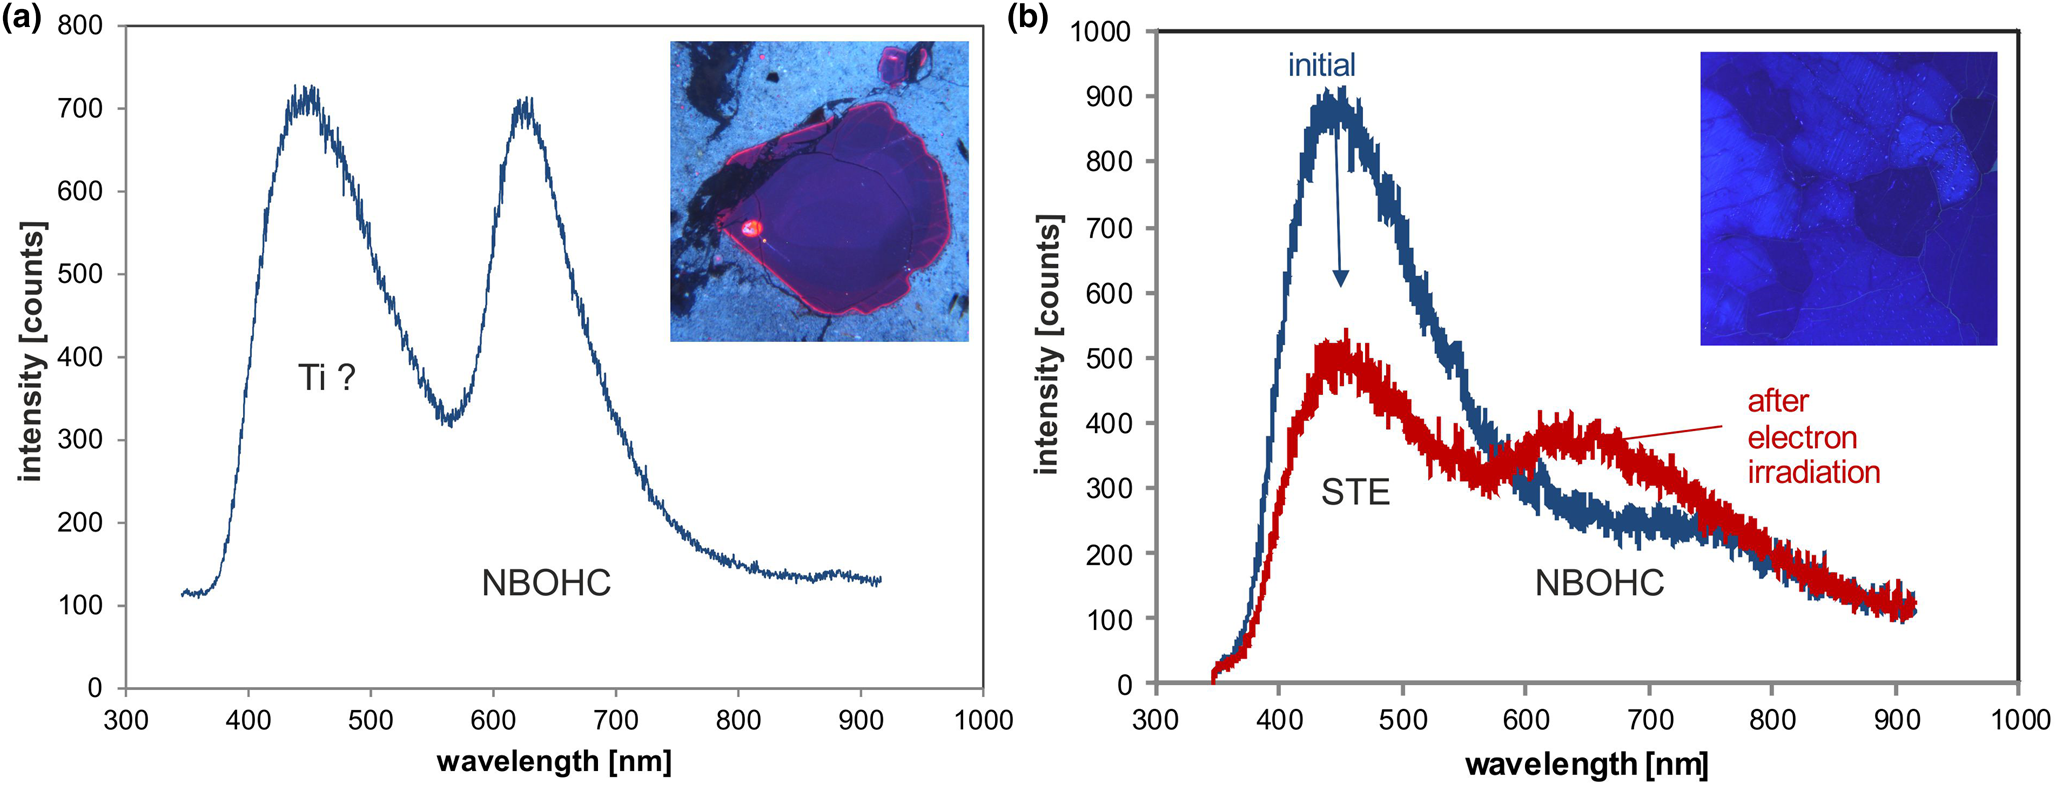
Fig. 22. CL emission spectra of (a) a quartz phenocryst in the Leisnig porphyry (Saxony, Germany) and (b) high-purity quartz from Kuznechikhinsk (Ural, Russia). Both quartz samples exhibit a blue CL (see insets) with a dominant emission band at 450 nm. The blue CL emission band of the Ti-rich quartz phenocryst (up to 80 ppm Ti and paramagnetic [TiO4/M+]– centres) is stable during electron irradiation and can probably be related to the activation by substitutional Ti. In contrast, the intensity of the STE-activated 450 nm emission band of the HPQ quartz (4.52 ppm Ti, no detectable Ti-centres) shows a strong decrease due to electron bombardment.
Conclusions
Quartz is one of the most common minerals in the Earth crust and occurs ubiquitously in magmatic, metamorphic and sedimentary rocks. This common occurrence makes it an important pathfinder mineral for the reconstruction of geological processes and palaeoclimatic conditions as well as the exploration of mineral deposits and other natural resources.
Although quartz has a simple composition and represents a very pure mineral with low abundances of defects and impurities, it develops significant indicator properties depending on its formation history and the influence of secondary processes. Analytical techniques with low detection limits and/or high spatial resolution can provide a wealth of data concerning the real structure and chemistry of natural and synthetic quartz. The analytical combination of CL microscopy and spectroscopy, EPR spectroscopy, as well as spatially resolved trace-element analysis has been demonstrated to characterise the type and abundance of structural defects and trace elements in quartz, and permit reconstruction of processes responsible for their formation and secondary effects. Each of these analytical techniques can provide specific information about the point defects and trace-element uptake in quartz.
It has been shown that quartz from different geological settings might have different trace-element composition related to the different supply and mechanisms of incorporation of certain elements. Therefore, trace elements in quartz are important petrogenetic indicators in geosciences. In addition, intrinsic types of point defects detected by EPR can provide valuable genetic information. Cathodoluminescence can help to visualise the real structure of quartz and to relate internal textures to possible formation processes.
However, interpretation of analytical data might be limited by the ability of quartz to regenerate during secondary alteration processes occurring under metamorphic or hydrothermal conditions. Therefore, primary genetic information concerning the real structure or trace-element composition might be obliterated during quartz alteration or regeneration (Kempe et al., Reference Kempe, Götze, Enchbat, Monecke, Poutivtsev, Götze and Möckel2012). In these cases care has to be taken when interpreting the genetic information encoded. Distinction of features related to primary growth or secondary alteration of quartz is not simple and requires application of complementary analytical techniques.
Acknowledgements
We are grateful for analytical help and productive discussions from Jonathan Sittner, Axel Renno and Ulf Kempe (Freiberg, Germany), Rudolf Mashkovtsev (Novosibirsk, Russia) as well as Marion Stevens-Kalceff (Sidney, Australia). We acknowledge comprehensive reviews by Rune B. Larsen, K. Breiter and an anonymous reviewer, which improved the quality of the manuscript significantly.
Supplementary material
To view supplementary material for this article, please visit https://doi.org/10.1180/mgm.2021.72