


Introduction
The quality of a fluorescence microscopy image from a fluorophore in the sample depends on the careful selection and control of the camera, light source, and optical filters. The configuration of optical filters can often be overlooked, yet an optimized setup can deliver significant improvements to image quality, revealing features that may have otherwise been missed. As laboratories swap out their traditional mercury and metal halide systems for the latest LED light sources, attention must turn to filter configuration. But first let us briefly explain the basis for this change in light source technology.
LED advantages and disadvantages
The LED light source has a number of advantages over traditional sources [Reference Young1]. First, an LED is stable over long periods, whereas the intensity of a mercury bulb declines over time (Figure 1). Secondly, the operator has more control over an LED source. It can be switched on and off with precise millisecond timing, which removes the need for a mechanical shutter and improves the temporal resolution of experiments. The LED intensity can also be modulated electronically, removing the need for neutral density filters. Third, LED lifetimes are much longer than mercury bulbs. Also, the alignment required after frequently replacing bulbs is tricky, but LEDs can be factory-aligned for immediate fitting to the microscope. Fourth, LEDs are cost-efficient, not just because of their long life, but because there is no need for special disposal of spent bulbs containing hazardous mercury. The up-front cost may be higher than replacing a bulb, but systems soon pay for themselves [2]. Finally, LEDs are more energy-efficient and emit much less heat.
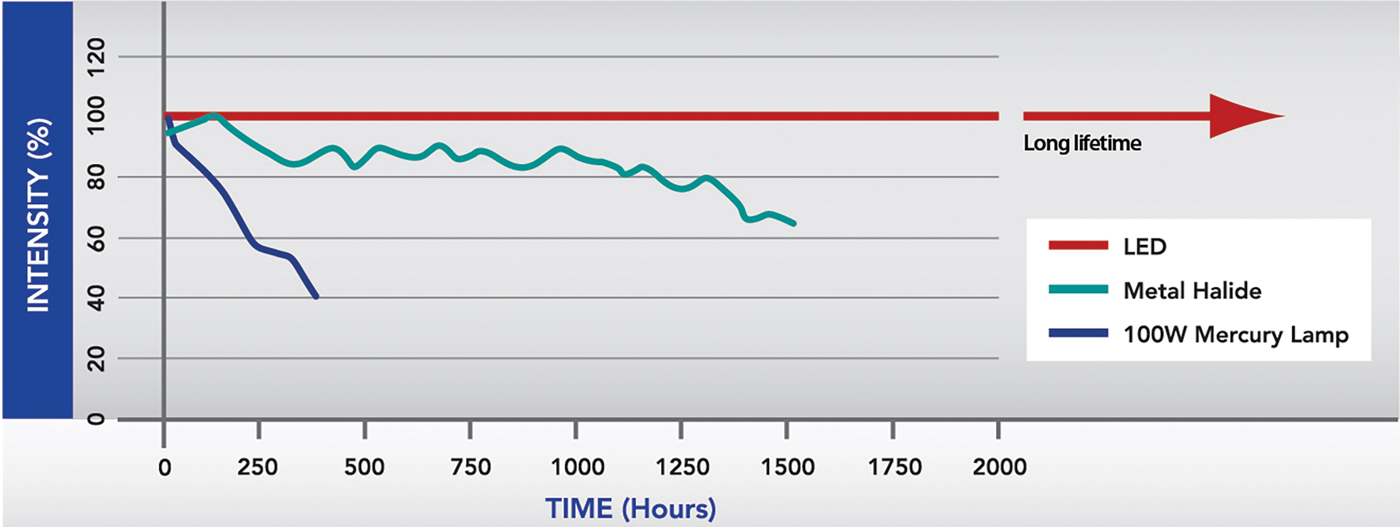
Figure 1: Graphical representation of intensity of various light sources across their life-span. One of the main benefits of LEDs over traditional illumination systems is their long life-span and their ability to remain at a stable intensity.
When this technology was first introduced for fluorescence microscopy in 2006, shortcomings included low intensity and a limited selection of wavelengths. The technology has evolved to overcome these problems for wide-field fluorescence microscopy (Figure 2), although intensity improvements are still ongoing in the green-yellow-red (GYR) region. Known as the “green gap,” this relates to a lack of semiconductor material which efficiently generates green light, and this issue is a key focus of current research and development efforts. It should also be noted that for confocal microscopy, LEDs are not yet a viable alternative to lasers. Another challenge surrounds the need for researchers to understand how to ensure the LED illumination system fully complements the microscopy setup to produce the best results possible, for example, by using the correct optical filters.
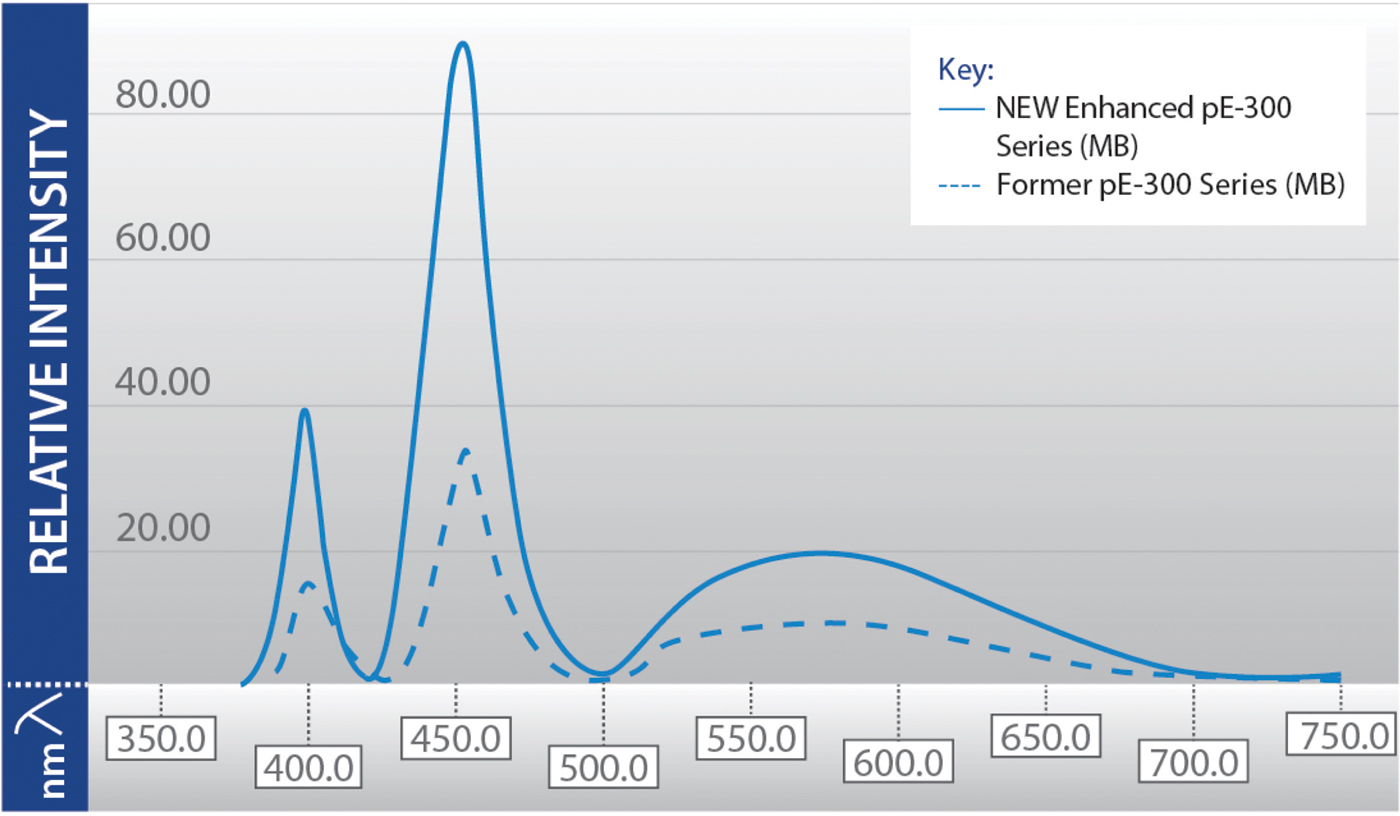
Figure 2: Previous limitations of LED technology (lower intensity and limited wavelength selection) are being overcome as shown in this spectral output of the CoolLED pE-300 Series, which includes one UV LED (365 nm or 400 nm), a blue (460 nm), and a broad GYR LED. Modern LED light sources often have multiple LED wavelengths, which can be individually controlled significantly faster than traditional light sources, increasing the temporal resolution of experiments and allowing the capture of high-speed events.
Handling the spectrum
Traditional mercury and metal halide bulb light sources for fluorescence microscopy are broadband, white light sources, with multiple peaks of high-intensity radiation from the ultraviolet (UV) through the visible spectrum to the near infrared (IR). When fluorescence molecular probes were initially developed, they were designed with these intensity peaks in mind to generate maximum levels of fluorescence signal from the sample, and thus filters were designed around those peaks.
The LED light source provides a narrow bandwidth of illumination, and a variety of powerful LEDs now cover the full visible spectrum, from the UV across the visible range and into the IR. Interestingly, this has allowed the development of new fluorophores which no longer depend on the emission spectrum of a mercury bulb. The fact that many LEDs illuminate in narrow bandwidths offers flexibility when choosing a light source. Many solutions are available, from single-wavelength light sources to sources combining multiple LEDs, covering the full visible spectrum. Matching filters with LEDs and fluorophores enables researchers to gain the greatest advantage from LED illumination systems, and this is where the technology really comes into its own.
Materials and Methods
Excitation filter
Let us consider the most basic example, where only one fluorophore is to be imaged, such as green fluorescent protein (GFP). Typically, an excitation light beam of short wavelength excites the GFP, and the GFP emits fluorescent light of a longer wavelength. Figure 3 illustrates this sequence, showing the emission of the 470 nm LED alongside the excitation/emission spectra of GFP. In this case, the dichroic mirror reflects all light below 495 nm. It is important to note that the dichroic does not provide a perfect block, and some wavelengths over 495 nm will be reflected toward the sample. As Figure 3 shows, this crosses over into the emission spectra of the fluorophore, and if not blocked can be reflected back to the detector and contribute to background noise. Therefore, although LEDs do emit at more discrete wavelengths compared to bulbs, an excitation filter placed in the microscope filter cube is still required to prevent this background. This bandpass excitation filter, matched to the fluorophore's excitation spectra, will ensure that only the desired wavelengths reach the dichroic and are reflected toward the sample.
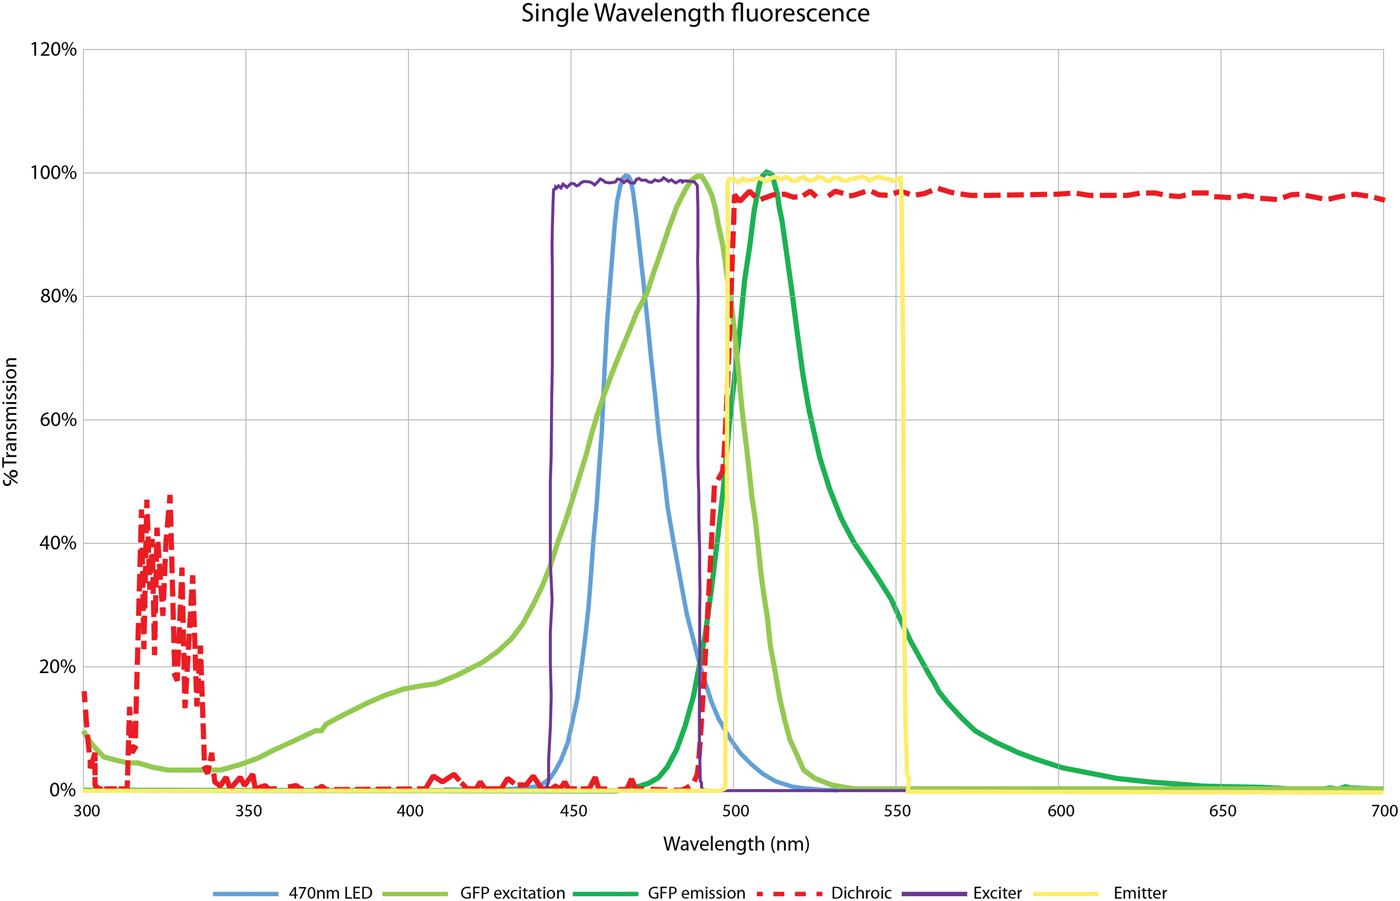
Figure 3: Filter requirements for single-wavelength imaging of GFP, using CoolLED pE-100 470 nm. This spectral plot shows the 470 nm LED wavelength (blue), which is used to excite GFP along its excitation spectrum (light green). This absorbed energy is then released as fluorescence along the GFP emission (dark green). The dichroic mirror (red) reflects all excitation light below 495 nm from the light source onto the sample and allows all light above this to pass from the sample (in this case the GFP emission) to the detector. To ensure a high signal-to-noise ratio, an excitation filter (purple) blocks the LED tail above 495 nm since this light would otherwise pass through the dichroic mirror and contribute to background noise. An emission filter (yellow) also sits over the emission peak of GFP to further block any light from outside this range.
Emission filter
An emission filter also ensures that only the wavelengths emitted by the fluorophore reach the detector. This will stop autofluorescence, stray light from the room, or reflected LED light from reaching the detector. Without the emission filter, these sources will add additional background noise to the image, reducing image quality and making it harder to see the fluorescence signal. In the case of single-fluorophore imaging, the emission filter can be placed in the filter cube of the microscope. This can be a bandpass filter, tailored to the emission of the fluorophore or a long-pass emission filter, letting through any light over a certain wavelength. Here a compromise is made between maximizing fluorescence signal and minimizing background noise.
Crossover prevention
While it is important to select filters to maximize fluorescence signal, careful attention must also be paid to the steepness of the filter edge and any crossover between the excitation filter and the emission filter. For example, steeper filter cutoffs increase the specificity of light either hitting the sample plane to excite the fluorophore or being emitted from the fluorophore and hitting the sensor. This is ideal for single-color imaging, especially in cases of autofluorescence. However, in multi-channel imaging this may come at the cost of reduced intensity. Any crossover between excitation and emission filters would lead to photons from the excitation beam being reflected off the sample plane and passing directly through to the sensor. This would result in a lower signal-to-noise ratio and therefore reduced contrast. To ensure that there is sufficient separation of the two filters and that excitation light does not pass through the emission filter, filter manufacturers provide data on all filters, making it possible to plot the optical density (OD) of the spectra and show in detail the wavelengths of light reflected or allowed to pass. For optimal separation with minimal crossover and background noise, the filters should have an OD of six or higher, which means that 1 × 10⁻⁶ or only one-millionth of the light will pass through the emission filter. Anything more than this would be detrimental to image contrast, and therefore quality.
Imaging multiple fluorophores
To image multiple fluorophores using an LED light source (either in the same sample or in separate experiments), there are a variety of solutions and methods available. A light source that emits over a range of wavelengths is necessary, and LED light sources with a number of individual chips are available (Figure 2). With a basic white LED light source, all three LEDs will illuminate at the same time. For this reason, excitation filters are particularly important because they will block wavelengths that will not excite the fluorophore. Not only is this important for reducing background noise, but it will have the added benefit of reducing sample photo-damage since the sample is then not being hit by unrequired excess light.
Filter cube switching
For experiments requiring single-wavelength imaging, or multicolor experiments that do not require high-speed imaging, individual filter cubes for each fluorophore can be placed in the microscope and selected manually as required, or through use of a motorized filter turret. While single band filter sets are commonly used in fluorescence microscopy, this switching between filter cubes can cause pixel shift. This occurs when slight differences in alignment of the dichroics in each filter cube cause misalignment when the digitally combined images are overlapped. Shift of a single pixel or more can lead to aberrations in the final multi-fluorophore image and incorrect scientific interpretation of the results. Switching between filter cubes is also slow and unsuitable for recording high-speed cellular events.
Multiband filters – a compromise
Multiband filter sets overcome the issue of pixel shift by including an excitation filter, dichroic, and emission filter that work for multiple fluorophores simultaneously. They work by blocking and transmitting specific wavelength bands, allowing the simultaneous acquisition of a multicolor image or rapid sequential imaging without the need to move filter cubes. While fluorophores can be imaged simultaneously with a color camera, this means that some of the more advanced monochrome technology cannot be used. Monochrome cameras provide the advantage of higher temporal and spatial resolution and have increased sensitivity. Combining multiple wavelengths into one filter set will also reduce optical separation, which can lead to bleed-through, and the narrow bands of excitation and emission may generate weaker fluorescence signals. While necessary for some applications, this is not always the optimal solution.
High-speed imaging
The use of excitation and emission filter wheels can improve image quality for multi-wavelength imaging. With a multiband dichroic mirror mounted in a stationary position within the microscope, it is possible to switch through excitation and emission filters much faster than between individual filter cubes. These filter sets are often known as “Sedat.” Sequential images can then be acquired at high speed and combined using computer software. While this is a good solution that minimizes bleed-through, there is still temporal separation between the images, which can result in image artifacts or simply missing high-speed cellular events. Light source manufacturers took note of this problem and have developed LED sources that allow the insertion of excitation filters directly in front of individual LEDs. Since many white light sources are constructed of multiple LEDs (Figure 2), it is possible to switch on and filter each LED individually. This means that no mechanical parts need to move when switching between wavelengths since they can be controlled electronically. When this is used in combination with a multiband dichroic mirror and emission filter, the speed of the experiment is limited only by the speed of the camera. High-speed, high-contrast sequential images then can be acquired and digitally combined without suffering from pixel shift. This approach provides the optimal solution for high-speed live cell multicolor imaging, providing high contrast without the need to purchase multiple emission filters or filter wheels. Filter manufacturers have introduced specialist “Pinkel” multiband filter sets, designed specifically for this application, which are suitable for the most common combinations of fluorophores.
Results
Filter cube switching
Figure 4 shows the result when a user selects the cube containing the mCherry filter set for image acquisition and then moves the cube in the filter turret to the Cy5 filter set to acquire a Cy5 image. Once acquired, these images can be digitally combined to give a multicolor image.
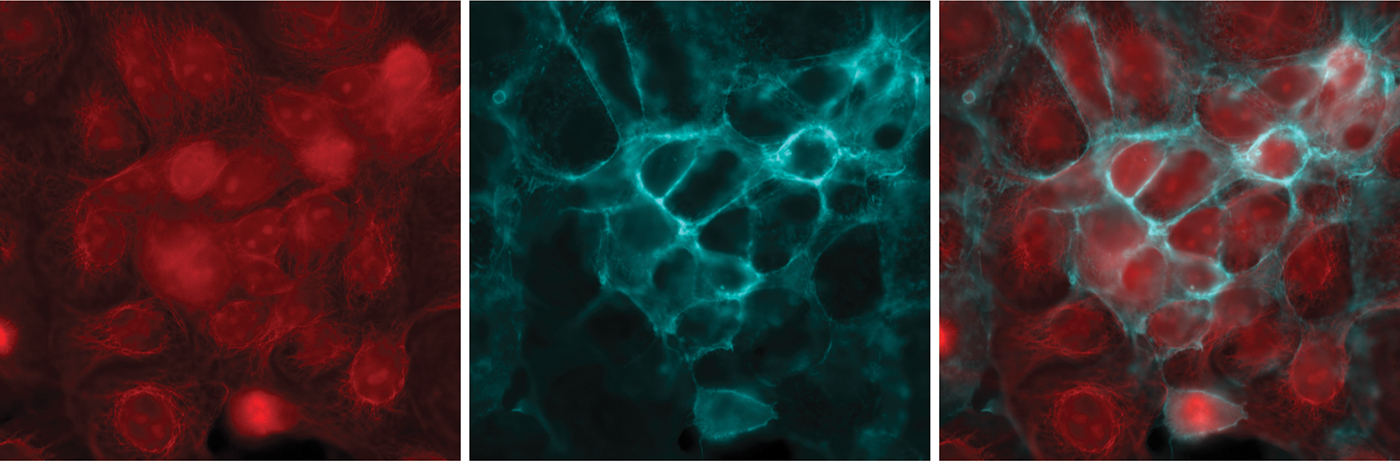
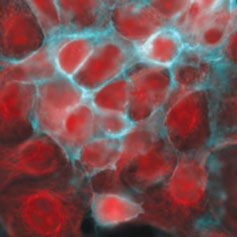
Figure 4: Imaging multiple fluorophores in Cos-7 cells. (Left) mCherry, (middle) Cy5, and (right) composite of mCherry and Cy5. A variety of filter setups allow researchers to image multiple fluorophores, such as using single band filter cubes for mCherry and Cy5, and combining the images.
New filters for LEDs
The next step in filter optimization is to design the optical filters themselves to match individual fluorophores and LED wavelengths. Many standard filter sets are designed around mercury rather than LED peaks, which can lead to sub-optimal experimental conditions, low-quality images, and inaccurate results. Filters are becoming available that are perfectly matched to the spectra of LED wavelengths and common fluorophores such as mCherry, right across the spectrum. For example, new excitation bandwidths now harvest maximum power from LED peaks to increase intensity for single-color imaging (Figure 5), and emission filters reduce bleed-through during multicolor imaging.
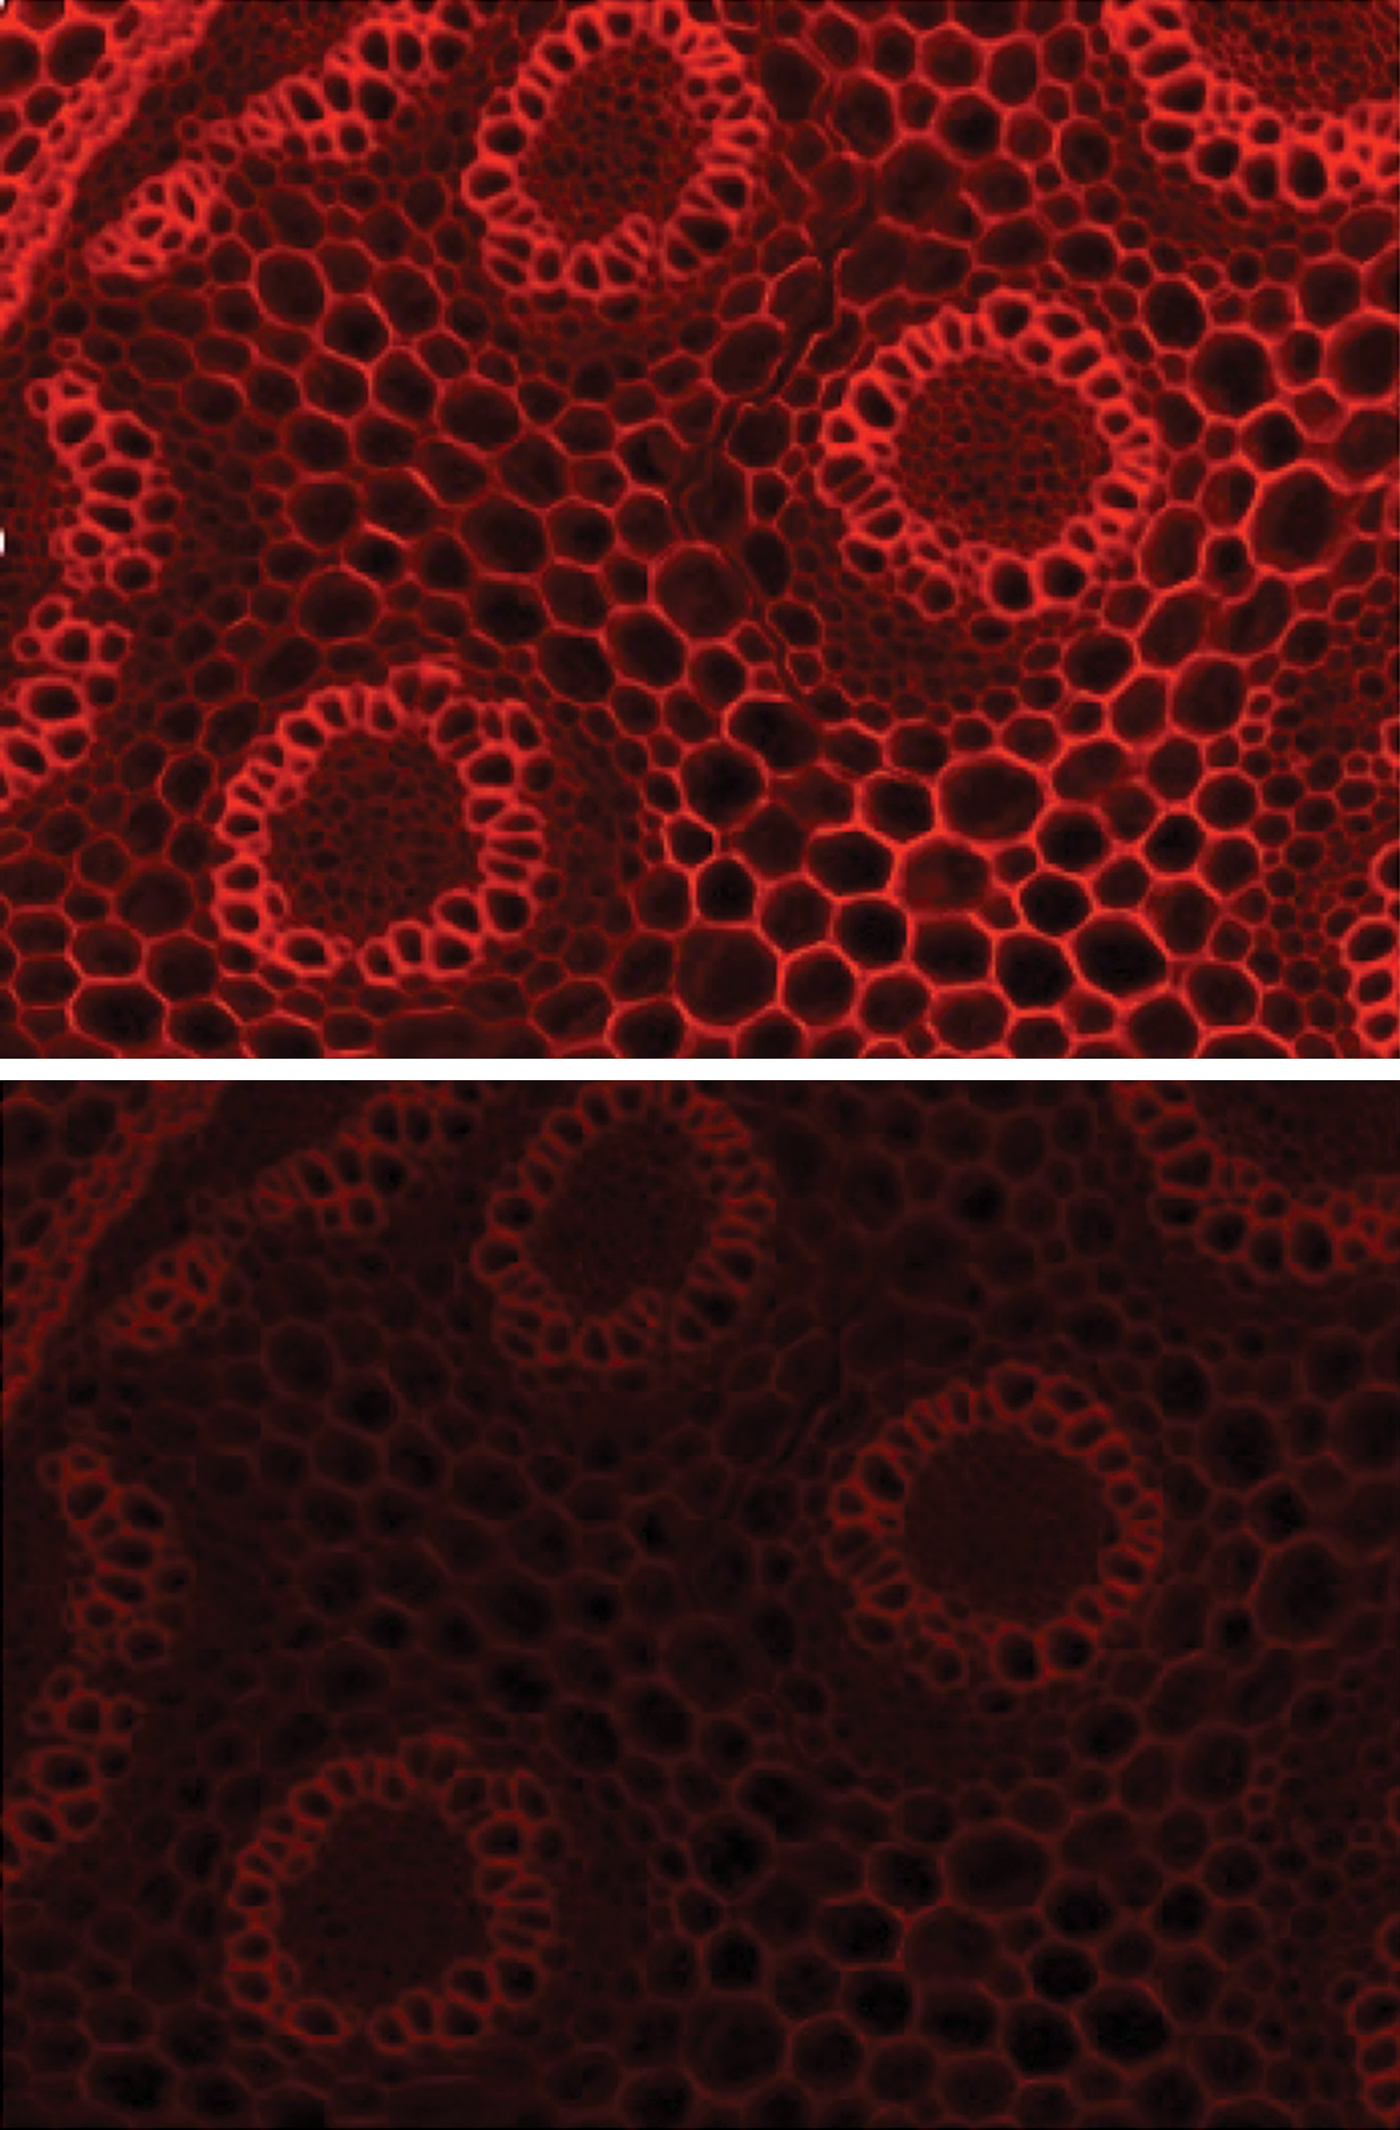
Figure 5: Single band filter set for mCherry optimized for LED peaks used to image Convallaria (top). This filter set broadens the excitation filter to harvest more light from the GYR LED, resulting in a brighter image compared to standard filters (bottom).
Conclusion
LEDs have come a long way in just a few years, and they now provide superior illumination for fluorescence imaging, with many advantages over traditional light sources. As LEDs become more powerful and LED-optimized filters become available, understanding how best to optimize the experimental setup will become more important. Even now a filter setup can be optimized to achieve high-contrast, high-speed, and multicolor imaging, while at the same time delivering accurate results and minimal light exposure to the sample.


