Introduction
An emerging soil improvement technique, microbial-induced calcite precipitation (MICP), can bond soil grains together and improve the engineering properties of soil [Reference DeJong1]. A biological reaction network requiring the presence of ureolytic bacteria (or urease), urea, and calcium-rich solution can develop cementation between soil particles and improve soil mechanical properties. The strength improvement of MICP-treated sand mainly relies on bonding formed by calcium carbonate precipitation. Bacteria producing the urease enzyme can catalyze urea to carbonate and, in the presence of Ca2+ at elevated pH, result in CaCO3 precipitation. The formation of calcium carbonate precipitation around the bacteria limits the availability of oxygen and nutrients for the bacteria, thus reducing the efficiency of bacteria in producing urease enzyme. Moreover, the MICP process faces the challenges of non-uniformity of calcite precipitation and limited penetration depth in the treated soil, which may limit the application of this innovative soil improvement technology [Reference Martinez2,Reference Burbank3].
Qabany et al. [Reference Qabany4] found that when the cementation media concentration was as high as 1 M Ca, the calcium carbonate precipitation was less uniform and contained larger crystal sizes, whereas the use of lower Ca concentrations over a larger number of injections resulted in a more homogeneous calcium carbonate precipitation. In addition, Zhao et al. [Reference Zhao5] developed full contact flexible molds for the MICP process and achieved more uniform specimens.
The MICP process relies on molecular-level chemical and biological processes that must be better understood for large-scale implementation. Crystal size and shape were found to influence the particle-bond failure mechanism in the form of either a sand-particle-bond interface failure or an internal failure of the carbonate crystals along a suture [Reference Dyer6]. The strength improvement of MICP-treated sand mainly relies on the precipitation bond, and the unconfined compression strength of MICP-treated samples increases with increasing CaCO3 content [Reference Zhao5].
Scanning electron microscopy (SEM) has proven to be one of the most useful tools for analysis of these materials, providing the ability to non-invasively visualize, differentiate, and quantify the various components. This method has been used to examine the formation of MICP and biofilms on the surface of the soil matrix [Reference Zhao5–Reference Chou7]. Focused-ion-beam (FIB) milling has been used by a number of researchers to serially section and visualize subsurface microstructure. This technique provides a tremendous advance in our ability to view the true 3D microstructure of materials that have complex microstructural morphology and crystallography [Reference Groeber8]. However, there is limited research on the formation and failure of calcium carbonate precipitation bonding in MICP treatment at the scale of the pores between sand particles. This article provides a description of mineral formation in the interior of MICP-treated sandy soil as revealed by focused ion beam/scanning electron microscopy (FIB/SEM).
Materials and Methods
Materials
Uniform, clean, Ottawa silica sand was used in the experiments. The average particle diameter of the sand (D50) was 0.54 mm, and no fines were included. Bacteria Sporosarcina Pasteurii was used because of its highly active urease enzyme. A cementation medium was used to provide chemicals that induce calcium carbonate precipitation: urea (30 g/L), CaCl2·H2O (73.5 g/L), NH4Cl (10 g/L), NaHCO3 (2.12 g/L), and nutrient broth (3 g/L). The urea-Ca2+ molar ratio was fixed at 1:1.
Batch preparation
The specimens were prepared in full-contact flexible molds as described in Zhao et al. [Reference Zhao5]. These molds were made of non-woven geotextile. The fibrous structure of the geotextile mold increased the penetration of chemicals into sand pores and maintained suitable precipitation, which caused the MICP-treated soil samples to be more homogeneous. All samples were prepared in a continuously stirred tank reactor, as shown in Figure 1a. With a bacteria concentration (OD600) of 0.6 and a cementation medium containing 0.5 M Ca, each treatment in the reactor lasted for 7 days. Up to four MICP treatment cycles were conducted on each sample to increase calcium carbonate precipitation and to improve the strength of MICP-treated sample. For each MICP treatment cycle, the specimen was taken out from the old flexible molds and mixed with new bacteria in a new geotextile mold to treat for another 7 days with new cementation media. Figure 1b shows an example of MICP-treated soil specimens after 7 days of reaction.
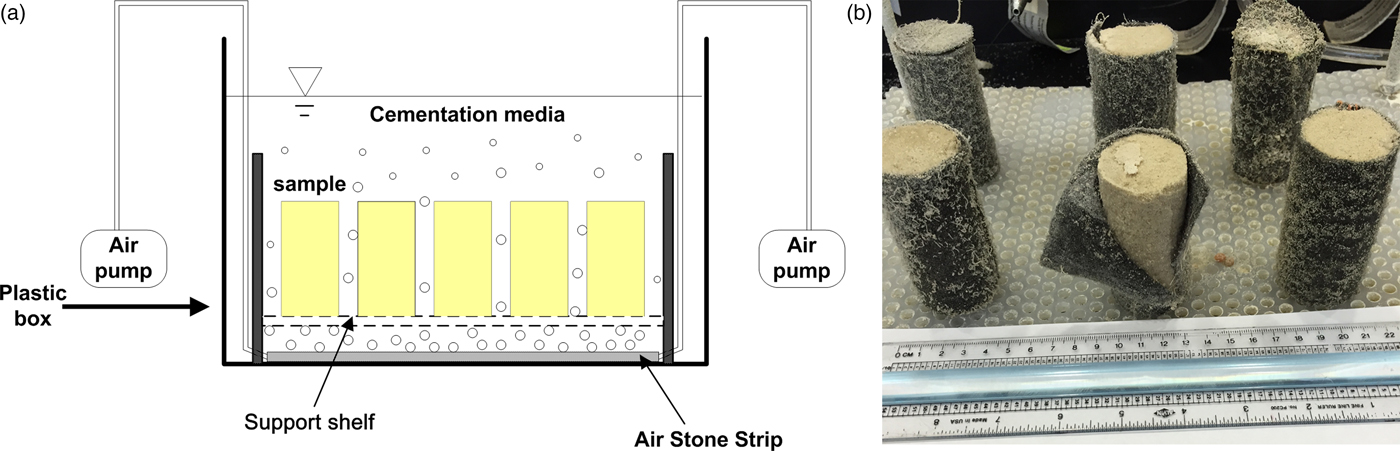
Figure 1: (a) Schematic drawing of the batch reactor and (b) image of specimens after the reactions but before strength testing.
Unconfined compression strength tests
Mechanical compression tests were conducted on unconfined cylinder-shaped specimens with a 2H:1D ratio (Figure 1b) to determine the unconfined compression strength (UCS). The tests were conducted under strain-controlled conditions at a uniform loading rate of 1.5%/min in accordance with ASTM D2166.
SEM specimen preparation
MICP-treated samples were removed from the reactor tank for UCS testing to failure. Failed specimens were prepared for microscopy by oven-drying overnight at 105 °C before mounting on SEM stubs with adhesive carbon-conductive tabs. The fracture surfaces were sputter-coated with gold for SEM analysis and FIB/SEM analysis.
SEM instrumentation
Specimens were imaged and ion-beam-milled in a TESCAN LYRA3 FIB/SEM. Secondary electron images were acquired at 5 kV. Certain fracture surfaces were milled with a Ga+ ion beam current of 10 nA at 30 keV to expose cross sections of sand particle bonding. The cross-section surface was then polished with a low ion beam current of 100 pA at 25 keV for 1 hour prior to SEM imaging. Elemental analysis was obtained with a Thermo Scientific NORAN (System 7) energy-dispersive spectrometer (EDS).
Results
Compression tests
The unconfined compression strength (UCS) tests were carried out to investigate the mechanical performance of MICP treated samples. Table 1 shows the UCS and dry density results for MICP-treated samples over different numbers of treatment cycles. The UCS and dry density of MICP-treated samples increases with treatment cycles, indicating that more calcium carbonate precipitation was generated through repeated treatment cycles. The UCS of a MICP double-treated sample is more than twice that of a MICP single-treated sample, which indicates that the increase in treatment cycles not only induces more calcium carbonate precipitation but also increases the effective bonding. However, the relative increase in UCS was less for triple- and quadruple-treated samples. This was due to the reduction in void space with each treatment, which would reduce the surface area available for bonding.
Table 1: Unconfined compression strength (UCS) of MICP-treated samples over different numbers of treatment cycles for a cementation media concentration of 0.5 M Ca.

Carbonate bonding of sand particles
Figure 2a shows an SEM image of untreated Ottawa sand with individual sand particles exhibiting smooth surfaces. After each unconfined compression strength test, the fracture surface of a crushed MICP-treated sample was observed by SEM to analyze the microstructure of CaCO3. Figure 2b shows sand particles bonded by calcium carbonate precipitation after a single MICP treatment. There were many dome-like calcium carbonate precipitates attached to the surface of sand particles that did not participate in bonding. However, Table 1 shows that the strength and density of multiply MICP-treated sand increased with each treatment. Non-treated samples (loose sand) have little strength and are not shown in Table 1.
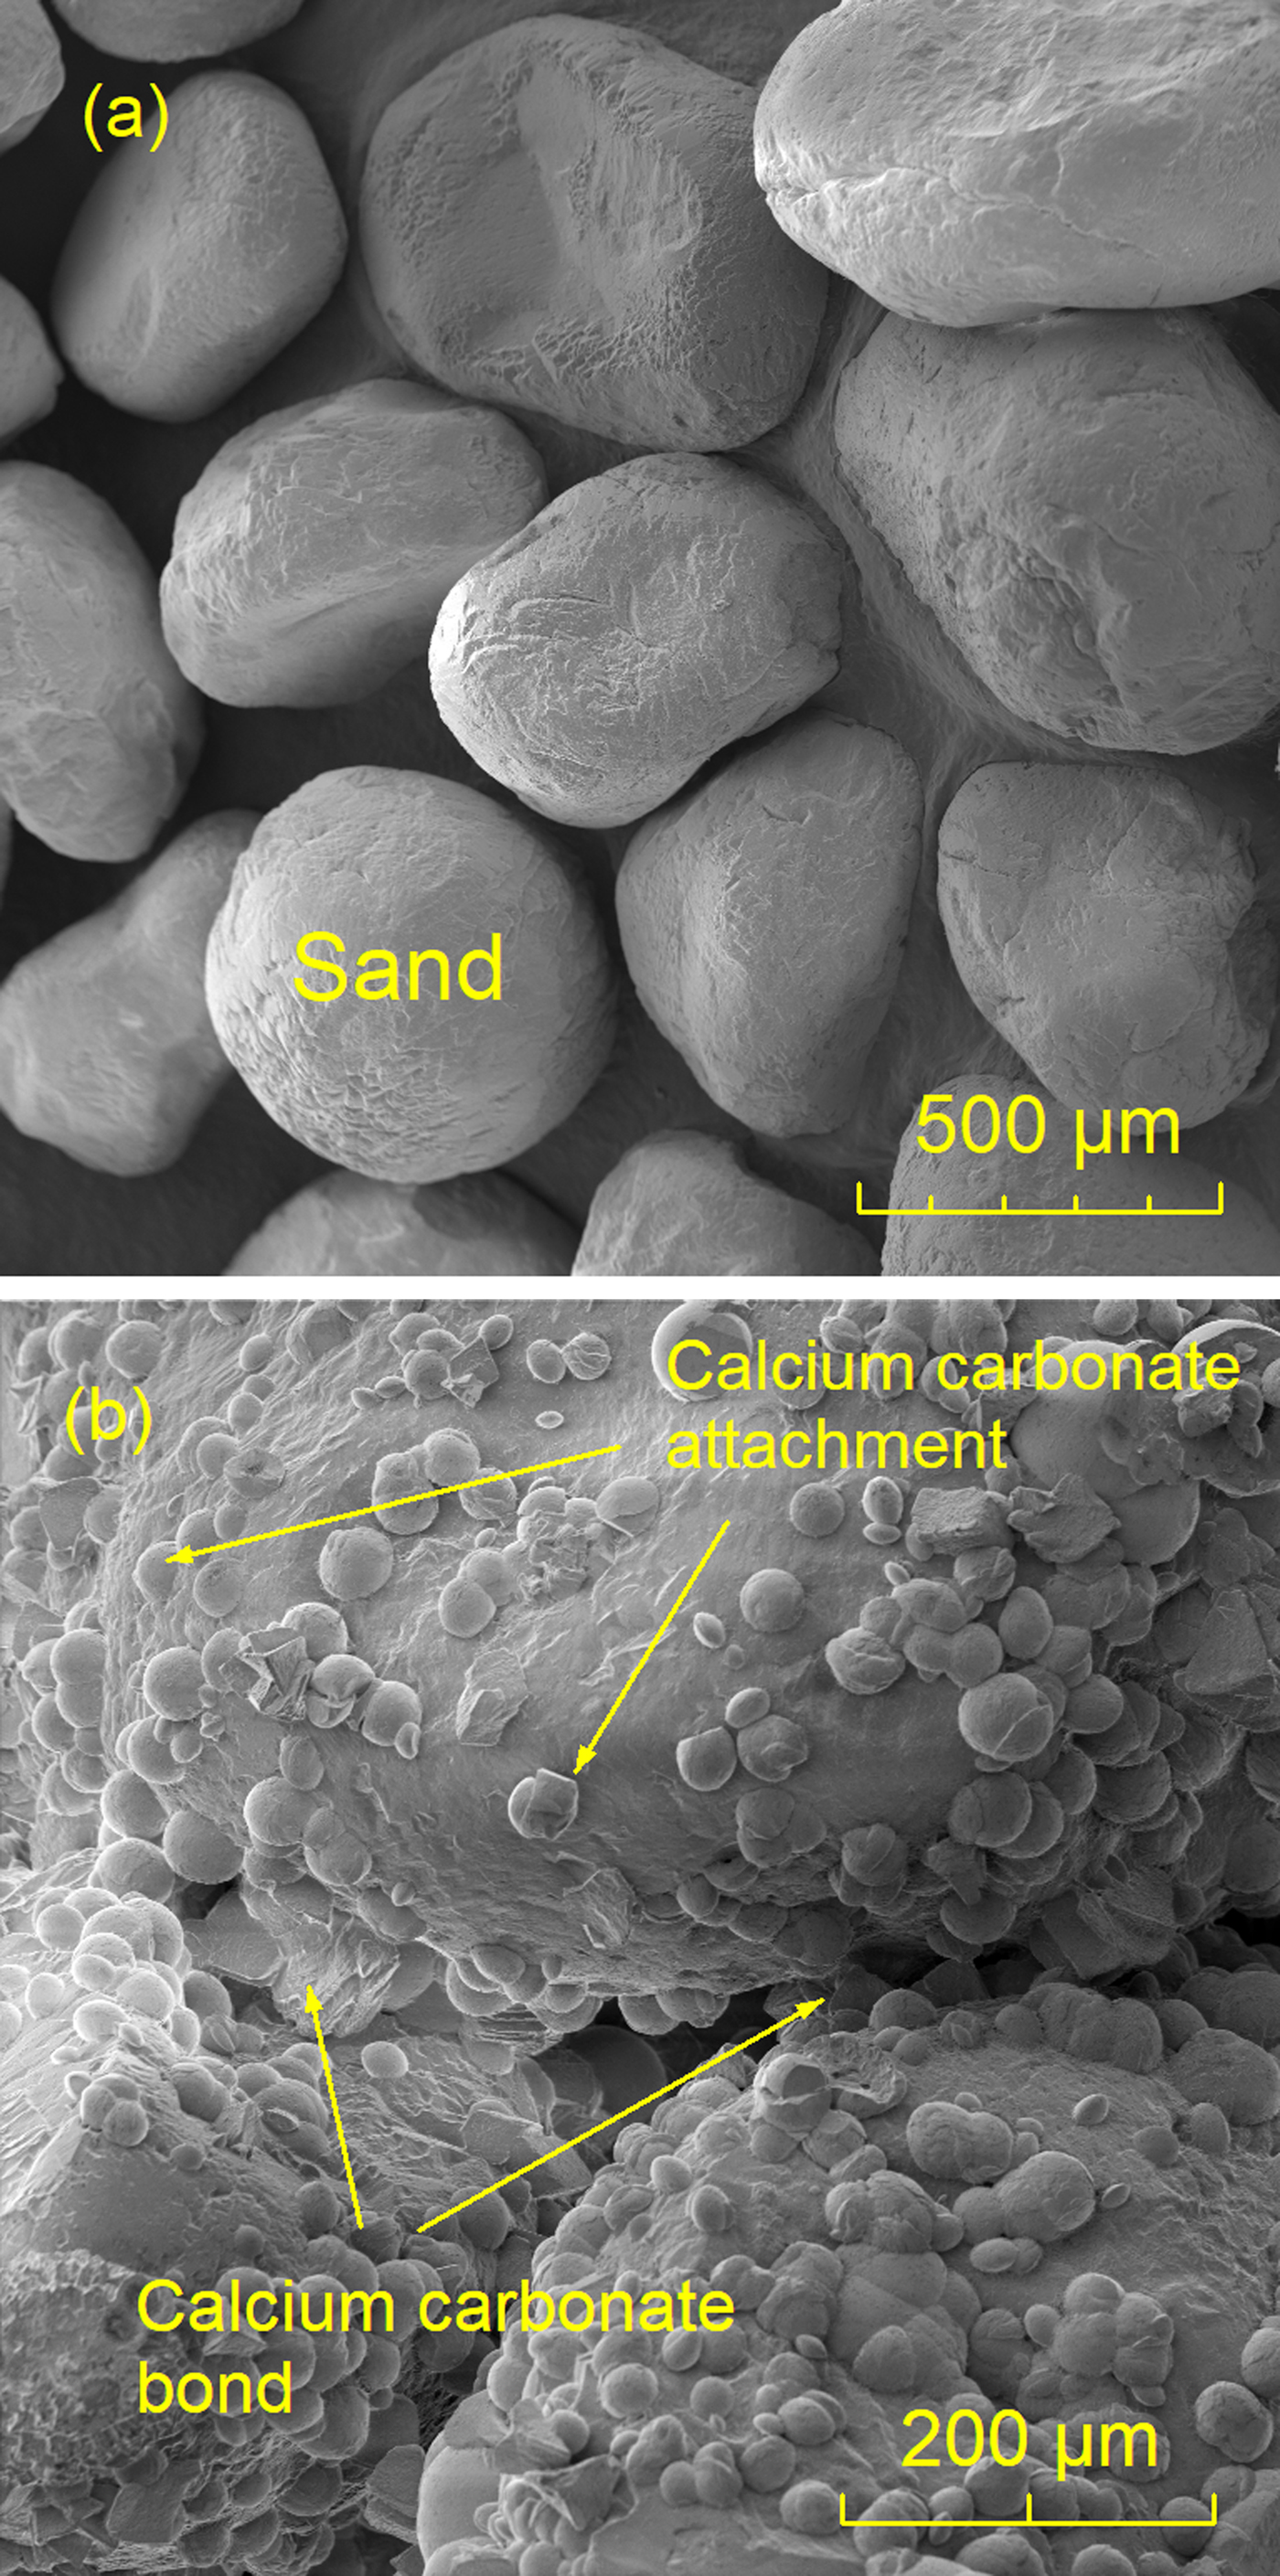
Figure 2: SEM image of (a) untreated Ottawa sand and (b) fracture surface of processed Ottawa sand after single treatment of MICP.
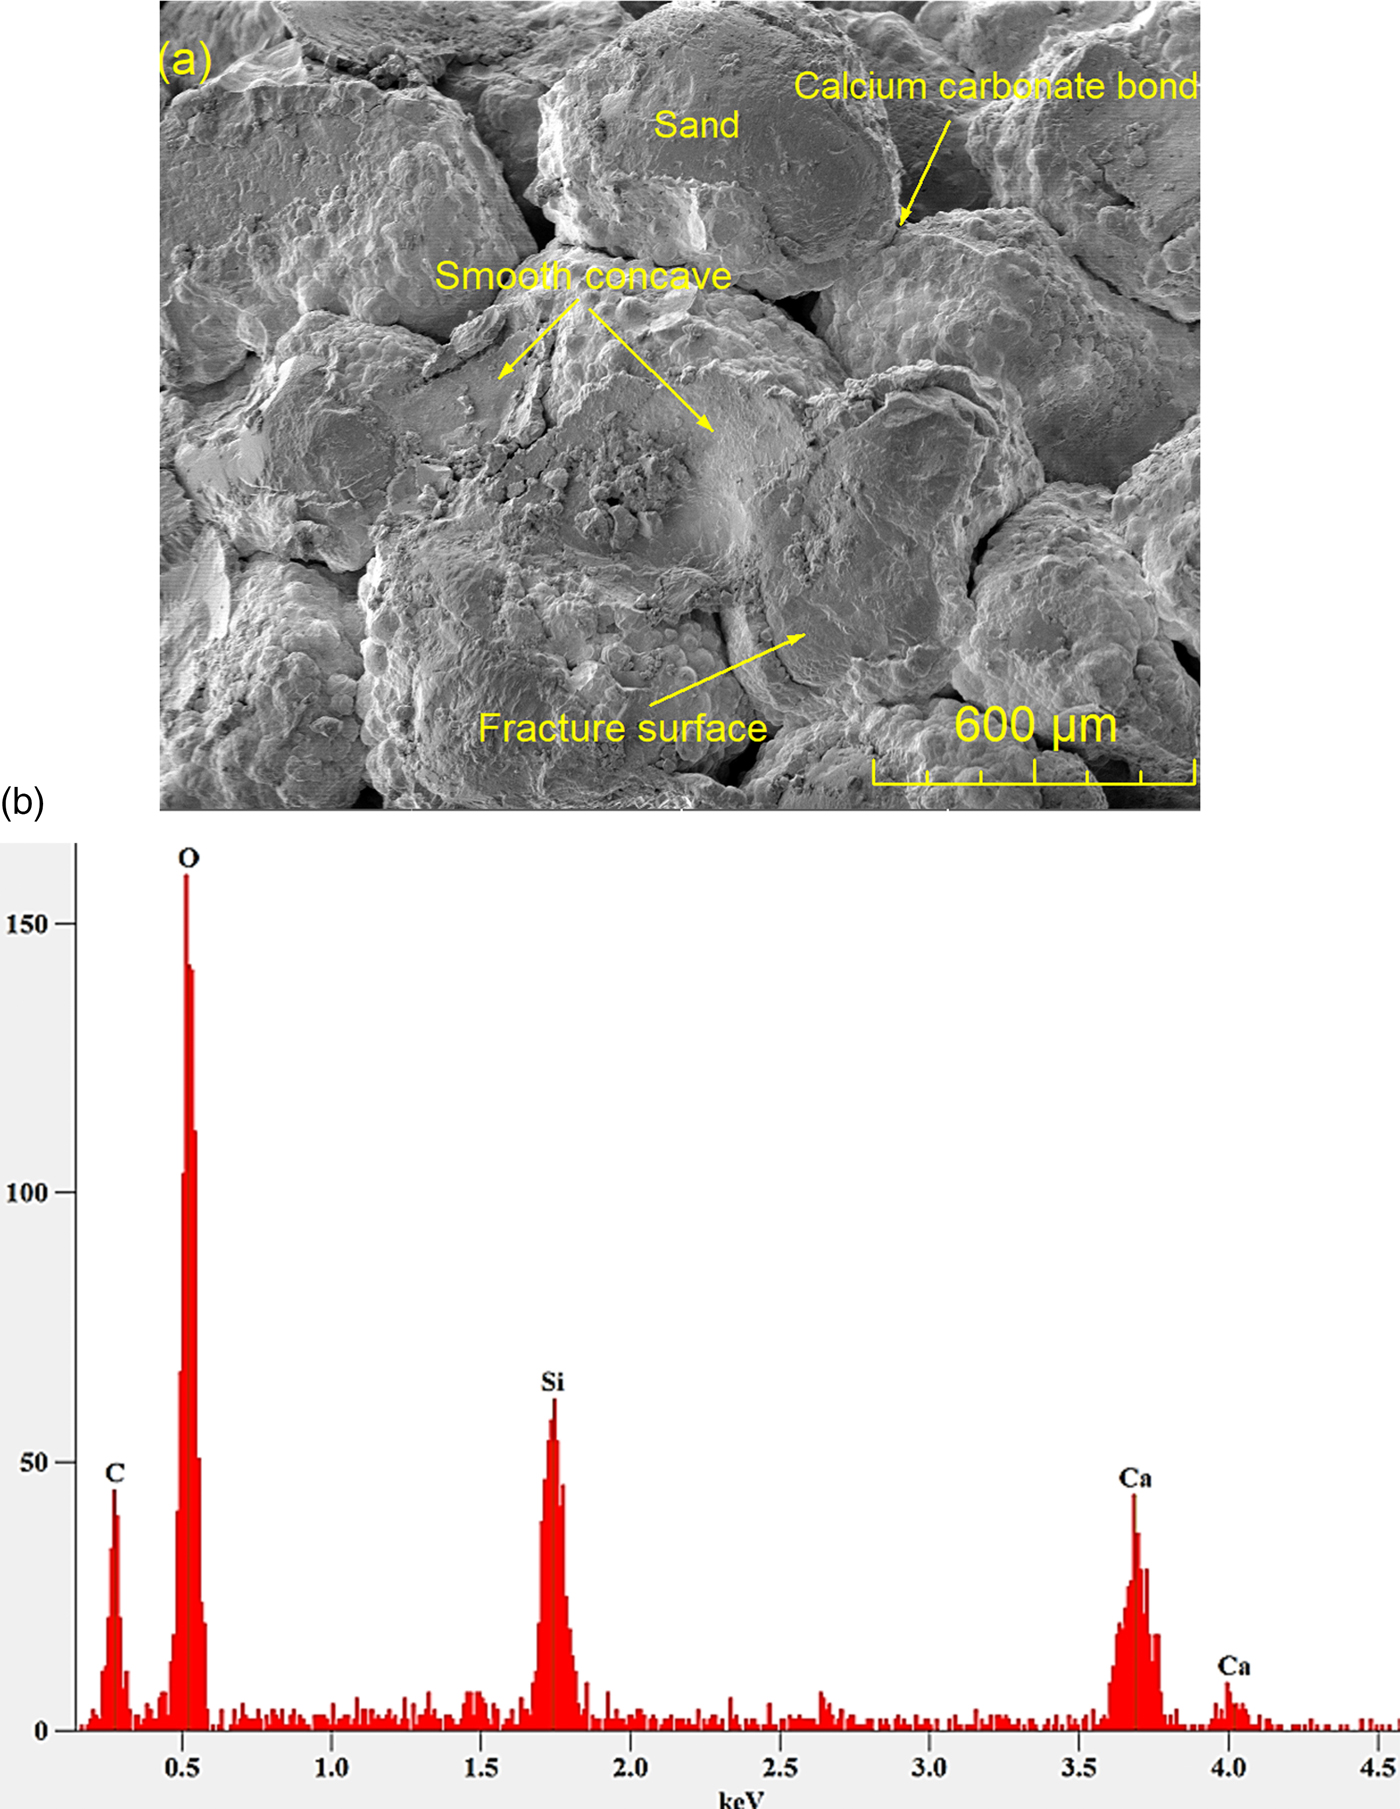
Multiple treatments increase calcium carbonate precipitation and increase the bond area between sand particles, thereby increasing the strength. Figure 3a shows that after four processing treatments, the calcium carbonate precipitation wrapped around sand particles so that the sand particles could be better bonded together. The failure mode of the MICP-treated sand was bond-particle failure. Figure 3a shows that some sand grains were detached from the calcium carbonate bond, leaving smooth concave regions, which were impressions of missing sand grains.

Figure 3: (a) Fracture surface of of processed Ottawa sand after four MICP treatments. (b) Energy-dispersive spectrometry X-ray spectrum of specimen region scanned in (a).
X-ray emission spectrometry
An EDS X-ray spectrum, acquired while scanning the entire image frame shown in Figure 3a, is shown in Figure 3b. The EDS analysis confirms the presence of carbon, oxygen, and calcium, the elements that made up CaCO3 in the MICP-treated sand. The silicon peak and part of the oxygen peak in the spectrum originated from the Ottawa sand itself (known to be 98% SiO2).
MICP-treated four times
Fracture surfaces were observed after samples were MICP-treated four times. Figure 4 shows the fracture surface in a quadruply treated sample and captures the exposed surface of a CaCO3 bond-particle failure. There were several interface lines between the CaCO3 and sand exposed on the fracture surface that illustrate the evolution of CaCO3 during multiple treatments, particularly in Figure 4b. The CaCO3 precipitated on the surface of sand particles first, and carbonate formed in the next treatment attached to prior carbonate. After four treatments, the CaCO3 layer expanded and converged to a shell-like precipitation that wrapped around the sand particles.
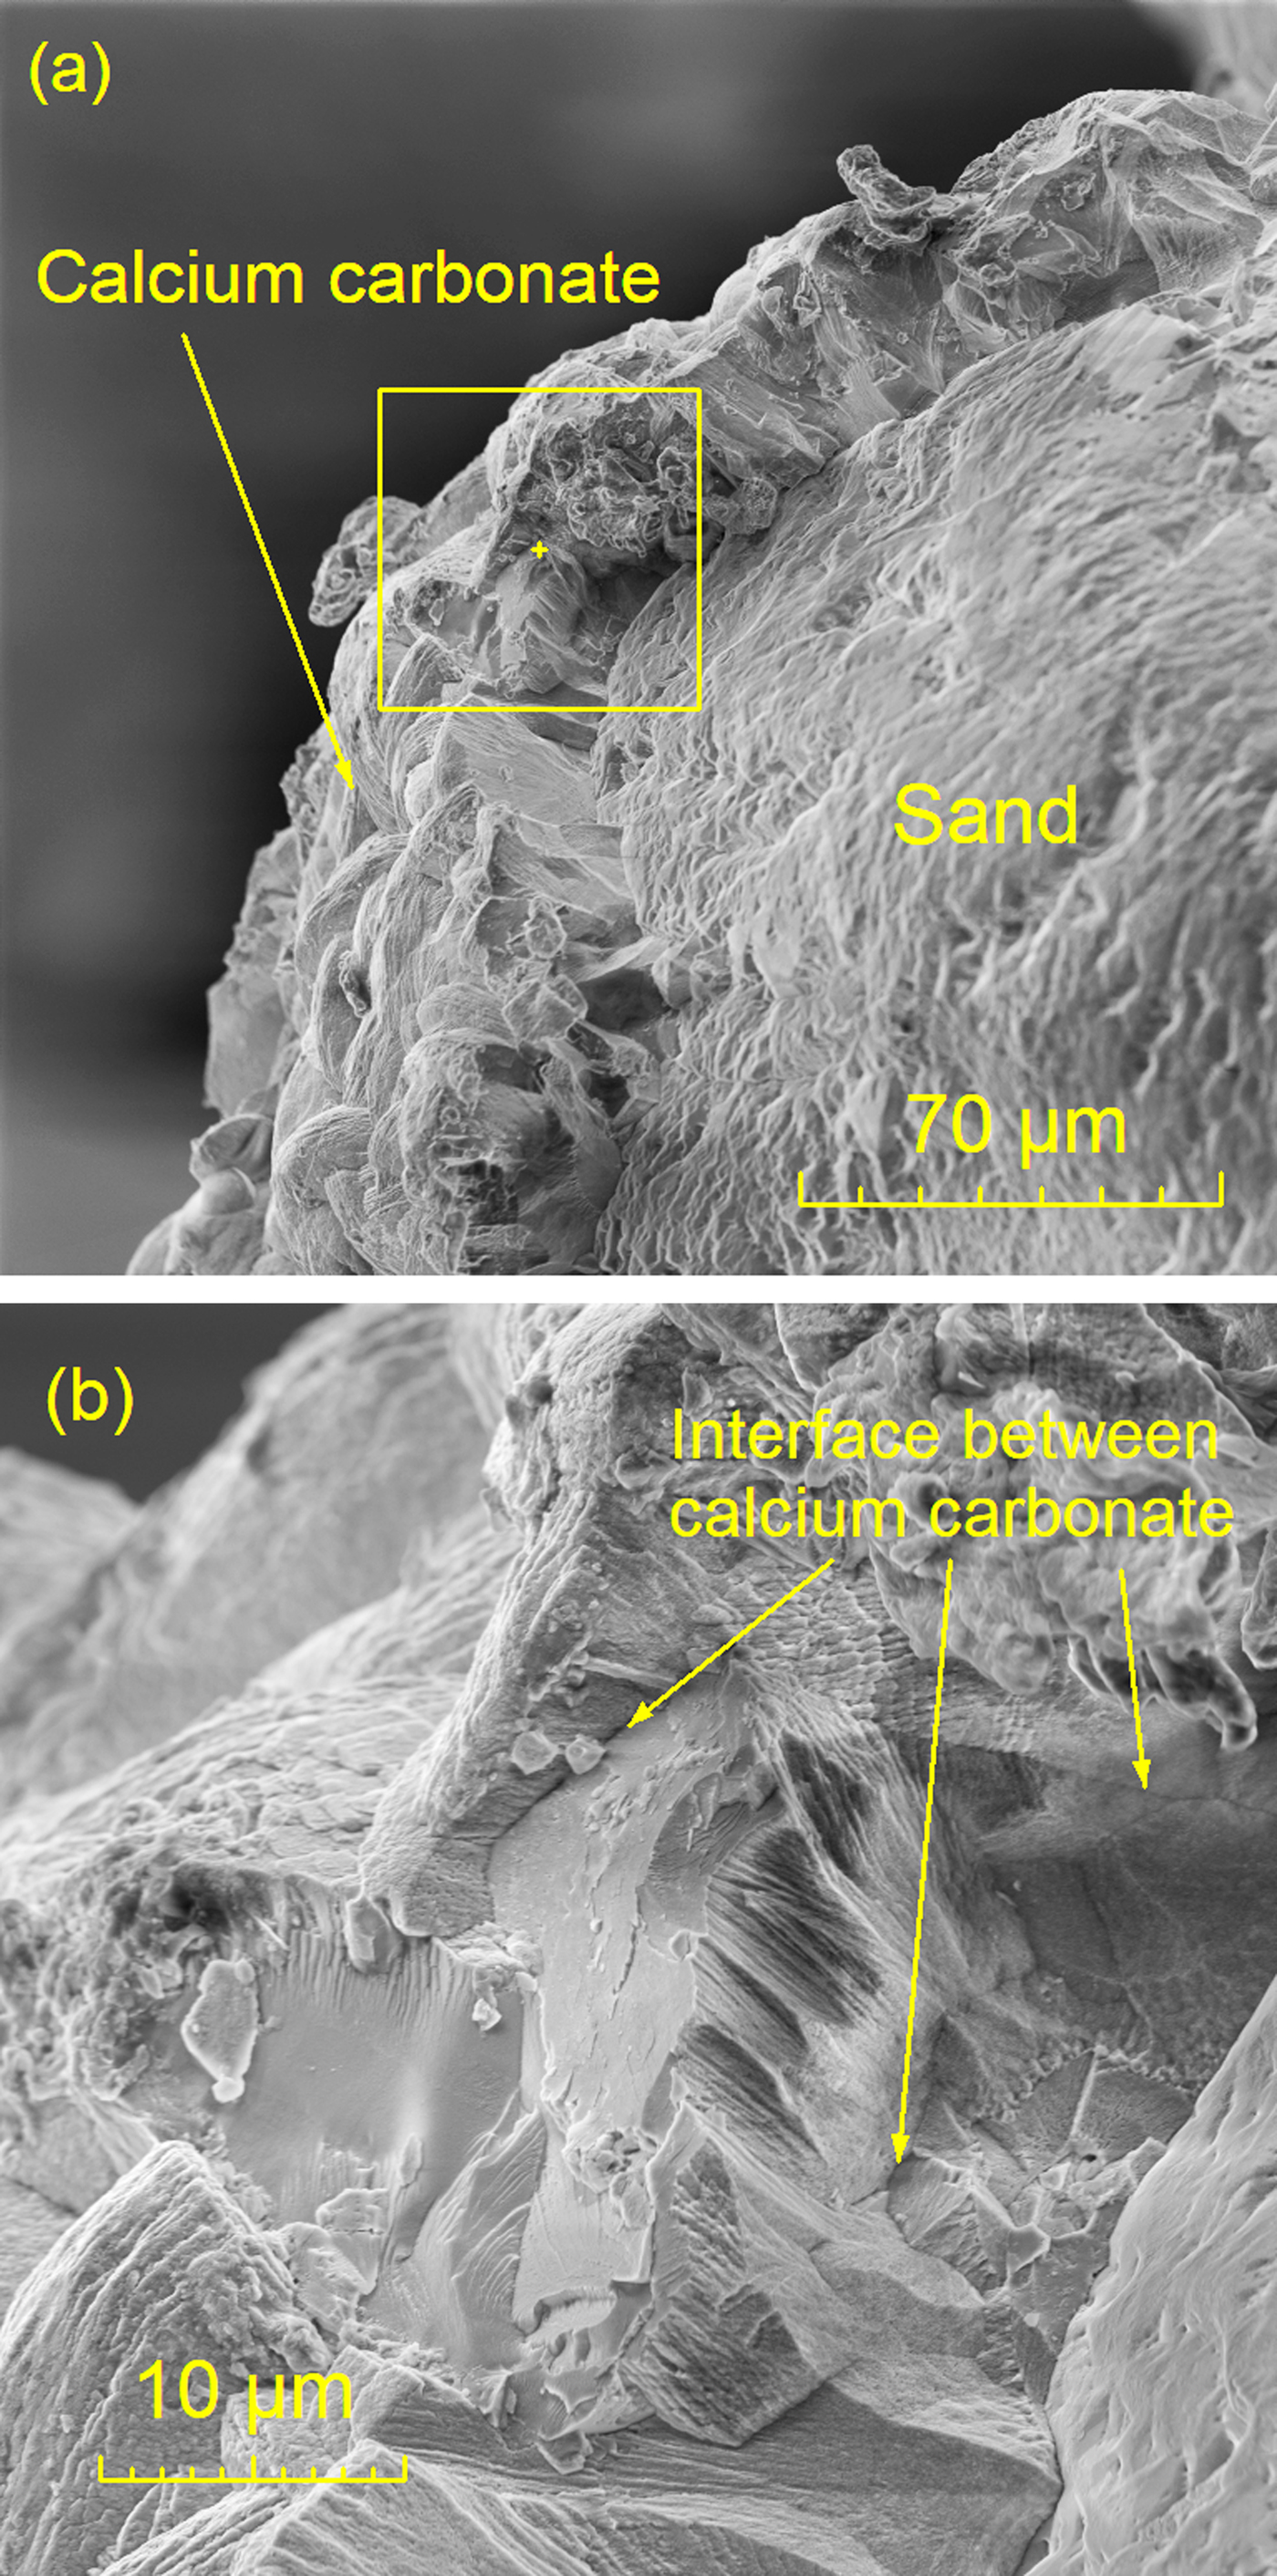
Figure 4: (a) Fracture surface of processed Ottawa sand after four MICP treatments, and (b) the same specimen at a higher magnification.
Cross sections of bonding
Figure 5 shows an SEM image of the ion-beam sectioned inner core of a region of the quadruply treated sand specimen. The left side of Figure 5a shows part of a bare sand particle, whereas the right side shows a portion of the CaCO3 layer on top of the sand particle. The cross section through the CaCO3 layer was ion-beam milled to about a 30 µm depth (yellow box). Figure 5b shows the milled region and an interface line between a sand particle and the calcium carbonate. It also shows three interfaces in the CaCO3 (arrows) indicating that the CaCO3 precipitation was accumulated layer-by-layer with multiple treatments, with the final layer forming the precipitation shell that wraps around the sand particles. Thus, the CaCO3 contact surface area expanded, and the bonding of the sand particles became stronger.
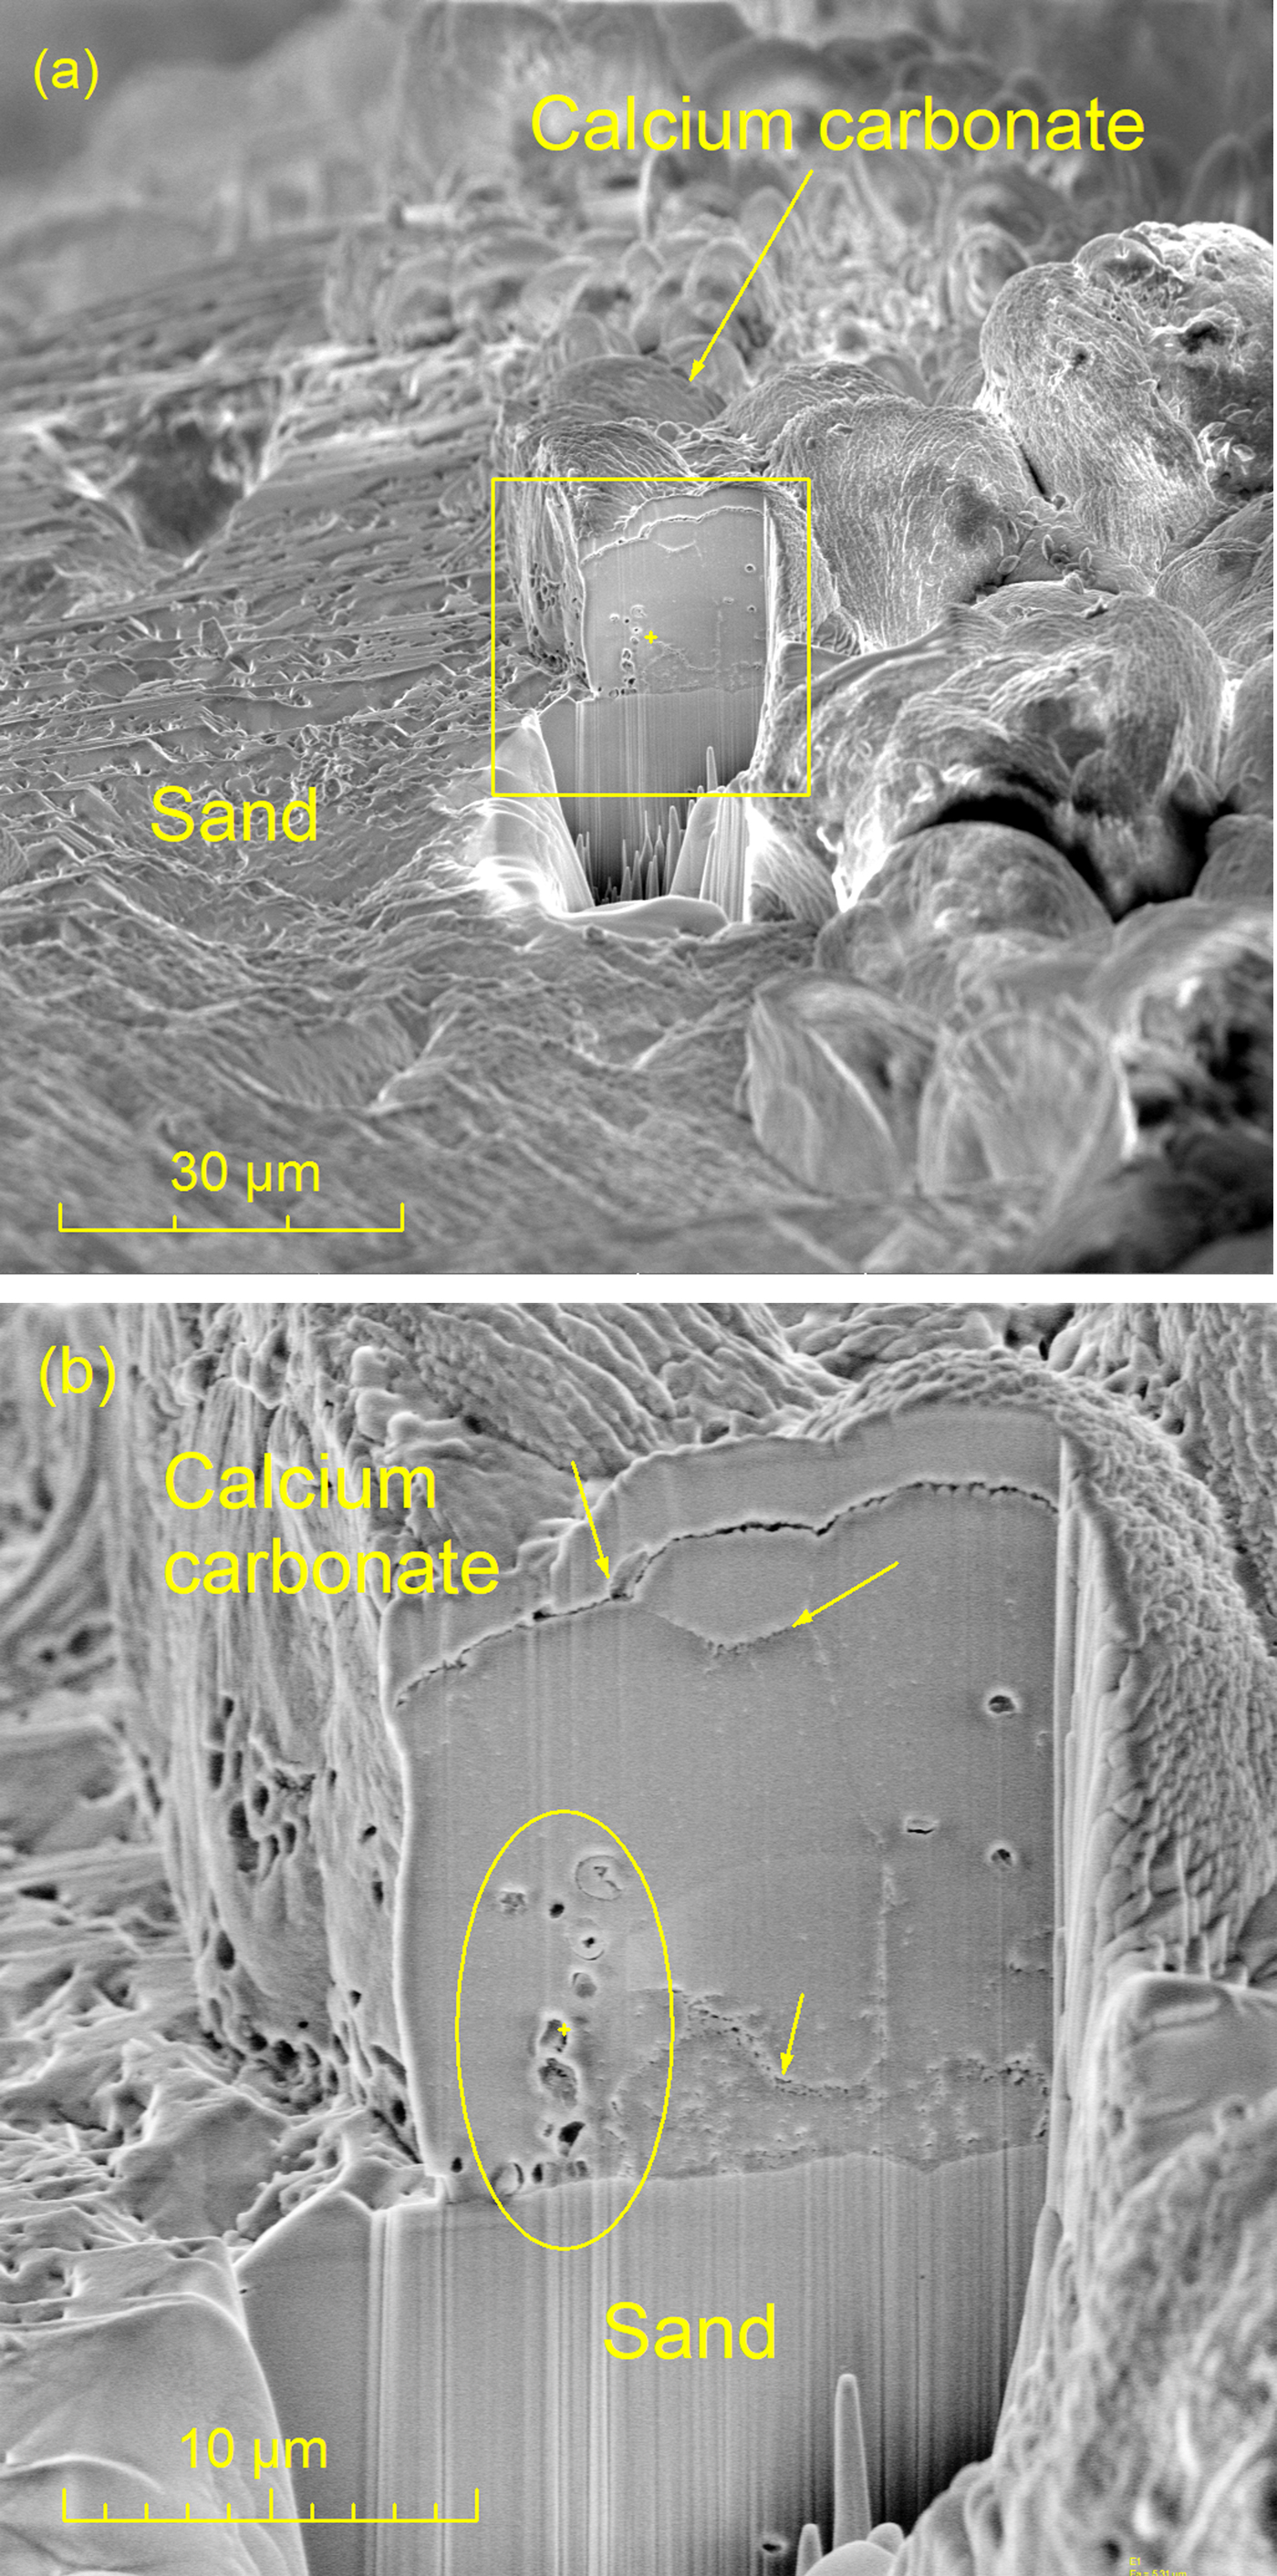
Figure 5: Cross-sectional analysis of calcite-sand boundary. (a) SEM image of internal boundaries exposed by ion-beam milling after four MICP treatments, and (b) the same region of specimen at higher magnification.
Remnant bacteria
In each layer, there were some inactive bacteria surrounded by CaCO3 (see circled region in Figure 5b). Images from other areas of the fracture surface provided insight into the remnant bacteria between the sand particles. Figure 6a shows inactive bacteria attached to the surface of the precipitation. After FIB milling to 30 µm, the SEM image of the exposed section provided a much clearer image of inactive bacteria inside the CaCO3 (Figure 6b). Bacteria with negative surface charge were attracted to Ca2+ and were trapped by the CaCO3 precipitation.
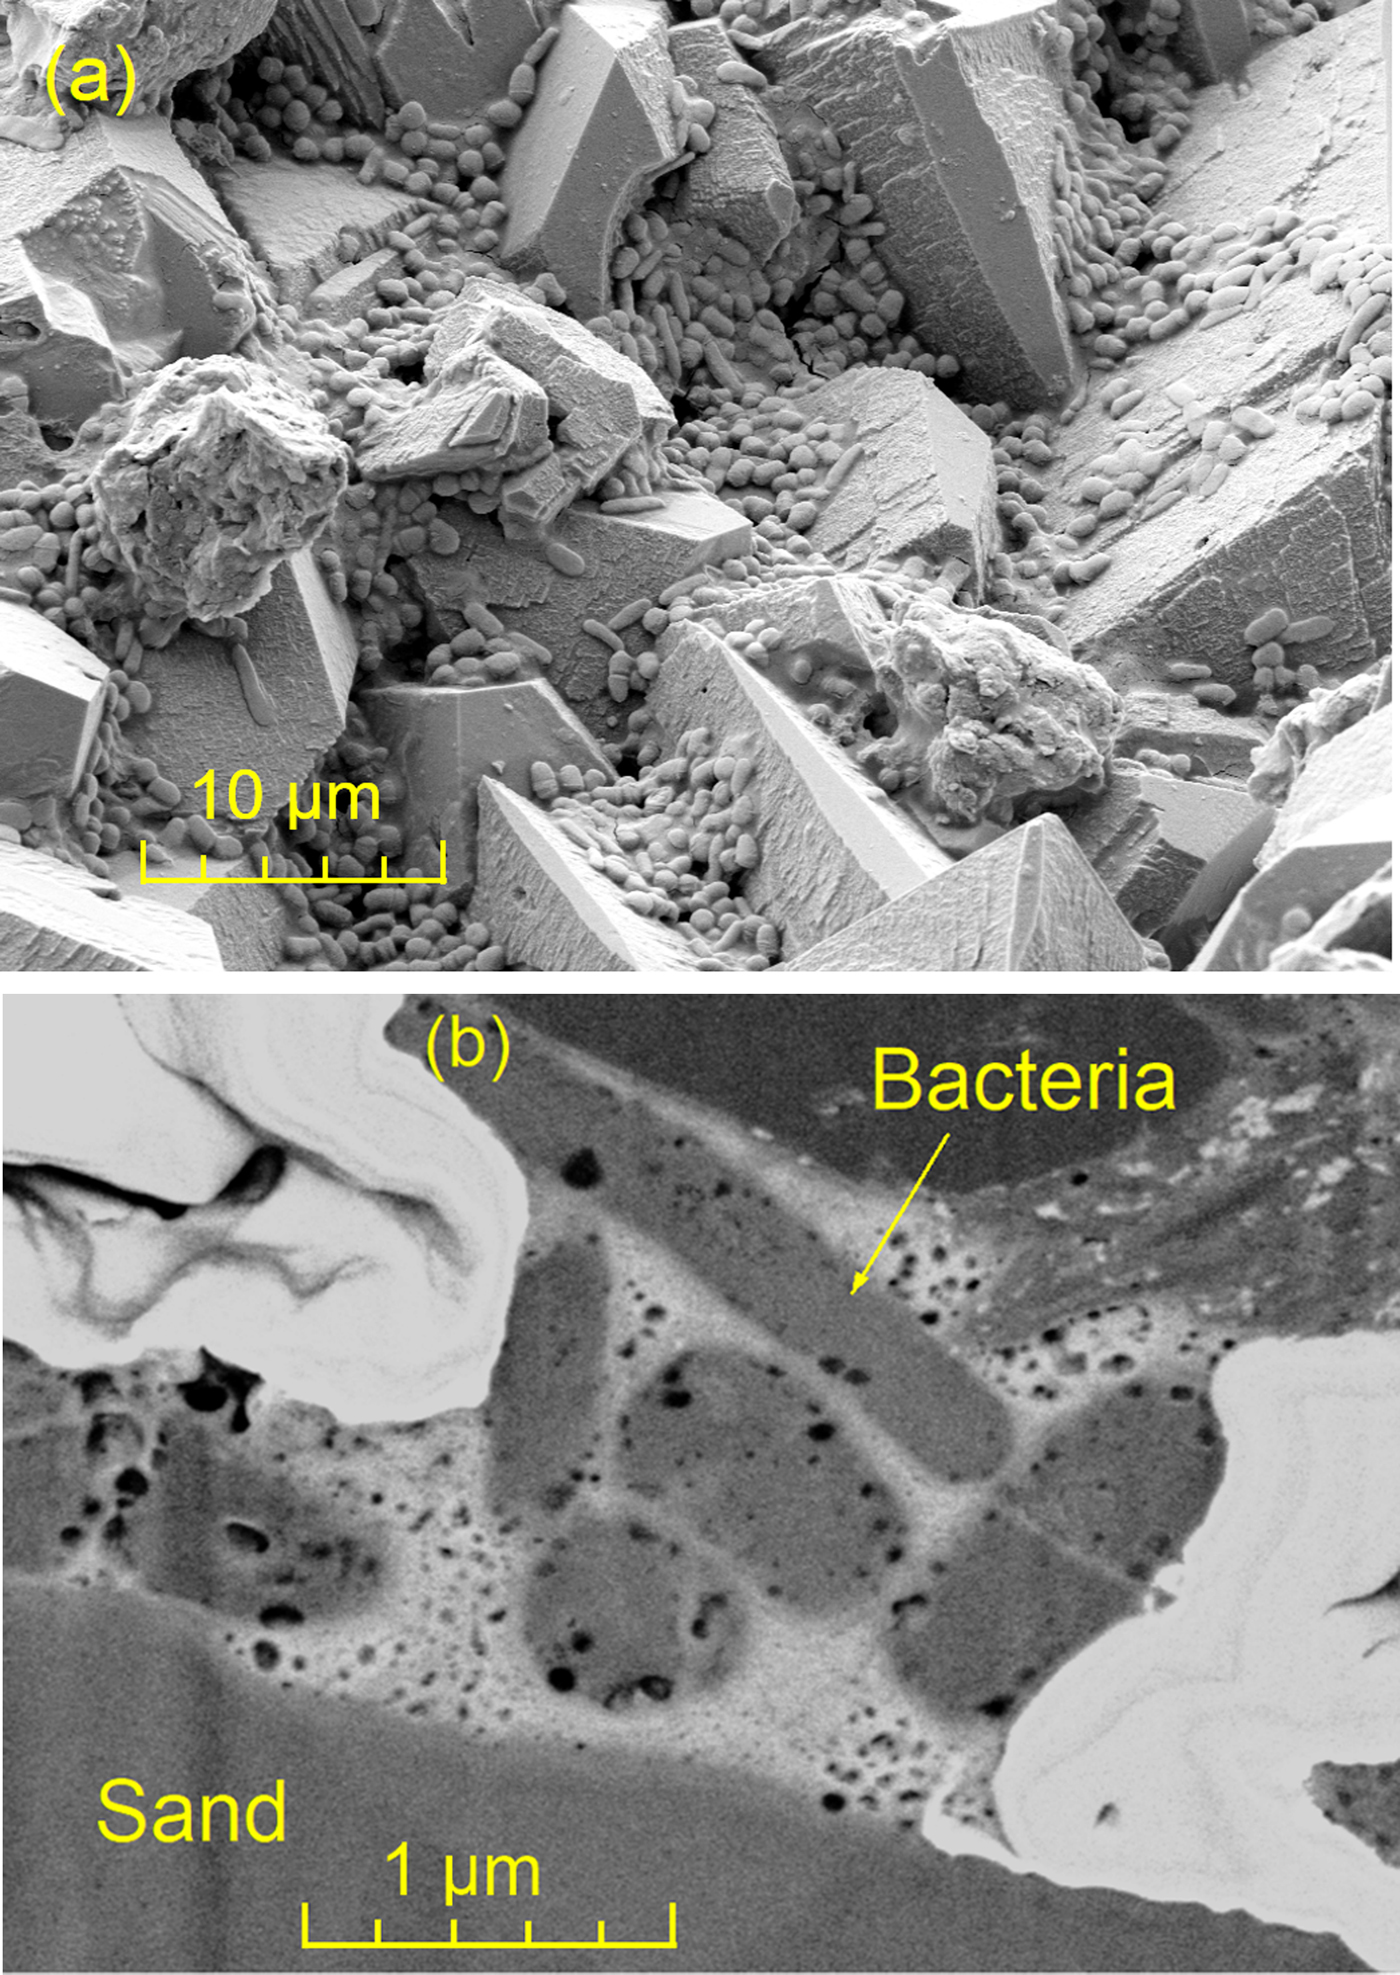
Figure 6: Inactive bacteria (a) on the surface of the fracture surface and (b) enclosed within the precipitation product.
Discussion
After a single MICP treatment, many CaCO3 hemispheres were found on the surface of the sand particles, reducing the possible bonding area of the calcium carbonate to the sand particles (Figure 2b). Multiple treatments increased the CaCO3 content and enhanced the CaCO3 bonding (Figure 4). Conventional SEM can only analyze the surface of the sample. After ion-beam milling a small cross section at the surface, SEM imaging could reveal deeper layers of carbonate (Figure 5). An automated milling process along with simultaneous SEM observation allowed study of the interior structure of MICP-treated soil specimen. More CaCO3 precipitated after each additional treatment cycle, and the milling function of the FIB exposed a cross section that showed the layer-by-layer deposition of CaCO3 (Figure 5b). Careful imaging at the fracture surface and the milled surface allowed imaging of remnant bacteria.
Conclusion
Conventional SEM and FIB/SEM have been used to investigate mineral bond formation in sandy soil treated by the process of microbial-induced calcite precipitation. SEM images show calcium carbonate (CaCO3) formation on the fracture surface of sample. Sand particles were uniformly covered by CaCO3 layers after four treatments, allowing sand grains to bond with each other. The milling function of the FIB produced a cross section revealing the interior structure of the carbonate-sand bonding. The ability to image and analyze μm-scale structures of the bio-mediated soil materials was essential for the study of this bio-geo material.
Acknowledgements
This article is based on work supported by the National Science Foundation Grant No. 1531382.