


Introduction
Most users of an optical microscope encounter a common question when preparing to view a specimen—which objective lens will allow for best observation? A low-magnification objective lens makes it possible to view a large area, albeit at poor resolution. Viewing a large area is helpful for rapidly identifying macroscopic areas of interest, such as clusters of important cells. However, higher resolution is often required to observe specific features, such as subcellular structures that indicate cell condition. To image at higher resolution and observe such fine features, one must “zoom in” using a high-magnification lens. Zooming in significantly limits the observable specimen area and thus the overall viewing context, which can often cause one to lose what they were searching for. Ideally, one would like an imaging system that simultaneously offers high resolution and a large field-of-view (FOV) (Figure 1).
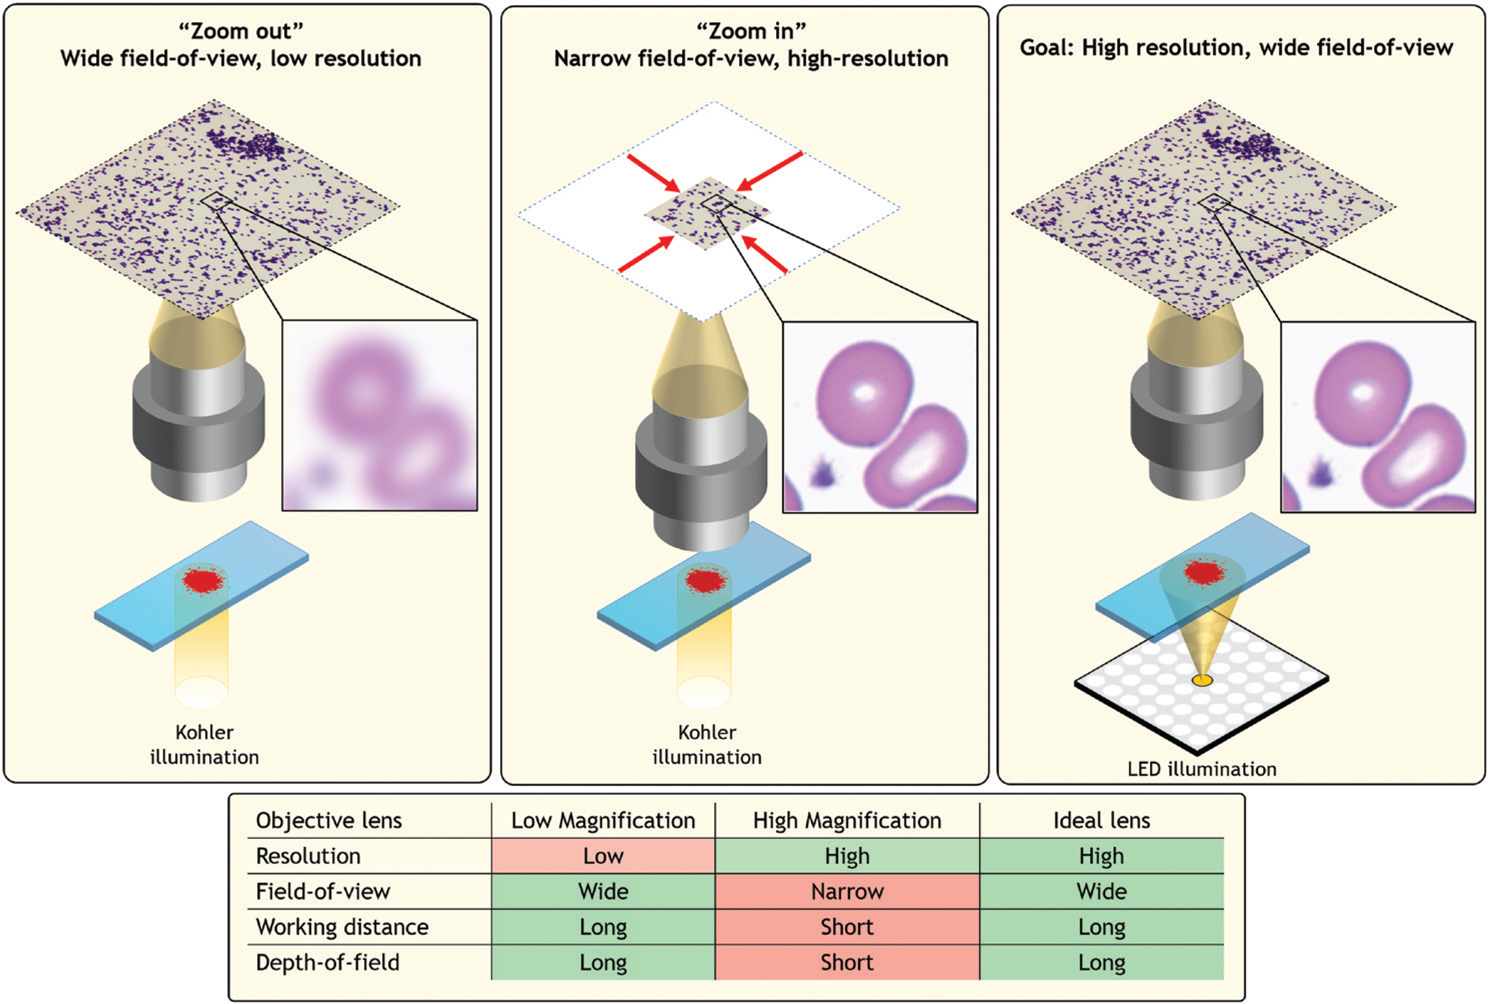
Figure 1: A standard optical microscope images a specimen across a FOV that is defined by the microscope objective lens. Left, a large FOV results in a low-resolution image. Middle, zooming in sharpens the resolution but significantly restricts the FOV. Right, an ideal microscope would offer both, which is the goal of Fourier ptychography.
The trade-off between viewing a larger sample area, versus zooming in to observe finer specimen detail, is common to all microscopes—and all imaging systems in general. Within the modern digital optical microscope, the primary cause of this trade-off is not the size or pixel count of today's digital image sensors. These can now reach into the hundreds of megapixels. Instead, it is typically caused by limits imposed by microscope objective lens design. All lenses have a finite “space-bandwidth product,” or number of optically resolved spots across a given FOV. Optical aberrations limit the ability to focus light to a tight spot across a large area, which in turn limits the ability to form sharp images without “zooming in,” especially in the peripheral regions of the FOV.
Many high-end digital microscopes include an automated X-Y translation stage to help address the trade-off between resolution and FOV. After capturing multiple X-Y images during step-and-repeat scanning, large image composites are then digitally tiled together for subsequent observation and analysis. There are several practical limitations to such scanning approaches, including lengthy acquisition times, setup complexity, cost, and stitching inaccuracies, to name a few. In 2013, a novel imaging method to address the large-area, high-resolution imaging problem was developed, termed “Fourier ptychography” (with a silent “p”) [Reference Zheng1,Reference Zheng2]. Fourier ptychography uses programmable illumination and computational reconstruction algorithms to create gigapixel-scale images that provide high-resolution imagery over a large area without requiring a mechanical stage or any moving parts.
Over the past several years, Fourier ptychography has grown into a mature method that now offers a variety of unique benefits [Reference Zheng3,Reference Konda4]. It is now also being pursued in several commercial applications. This short article is the first in a three-part series that will aim to explain the basics of how Fourier ptychography works to a non-specialist.
Basic Operation of Fourier Ptychography
To understand the basic operation of Fourier ptychography, let's first consider the simplified microscope diagrammed in Figure 2a. Here, a small point-like source of light is placed at a large distance beneath the specimen of interest. In this diagram the specimen is a resolution target. The simplified microscope above forms an image of the resolution target. Although the point-like source emits light in all directions as a spherical-like wave, the relatively small specimen located several centimeters away “sees” approximately a planar wave, or in other words a parallel set of light rays, reaching its bottom surface.
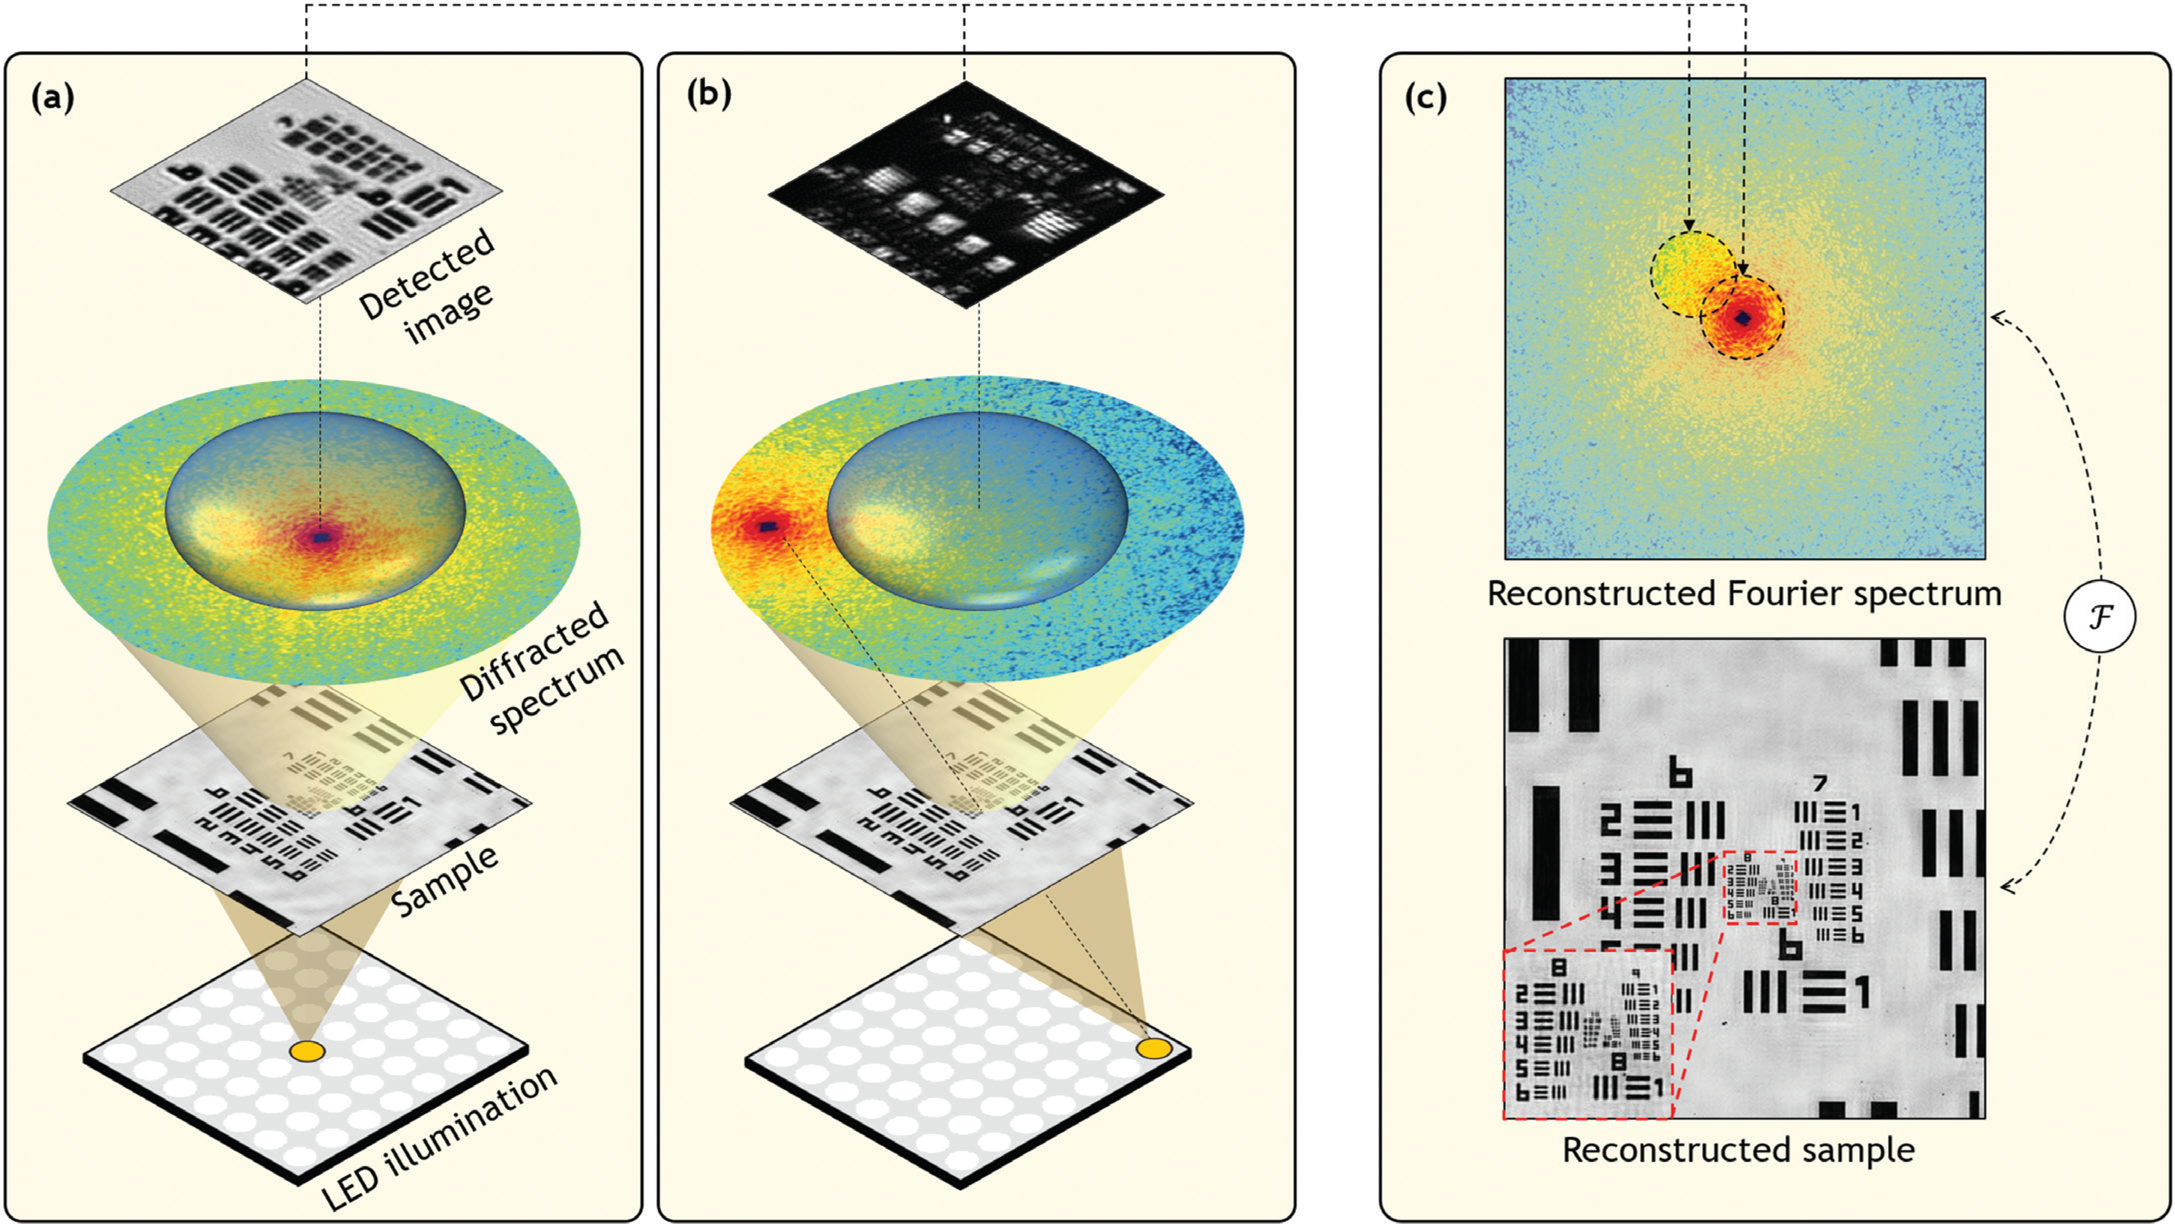
Figure 2: (a) Simplified microscope diagram with an LED array illuminating a sample from below. Scattered light is imaged by a lens of finite width and projected to an image detector. Diffracted light from the sample, represented as the sample's Fourier spectrum, does not fully pass through the lens aperture, limiting the detected image's resolution. (b) Illuminating the specimen from an angle, using an off-center LED, shifts the sample's spectrum to cause a new spectrum segment to pass through the lens and contribute to image formation. (c) Fourier ptychography collects many uniquely illuminated images and combines them in the Fourier domain to synthesize a more complete spectrum, in turn leading to an image reconstruction with higher resolution.
Specimens one might be interested in examining under a microscope contain features of various sizes, including some that approach the wavelength of light. When light interacts with such features, it diffracts or spreads in many directions—the smaller the feature, the larger the angle of diffraction. This interaction typically results in a large cone of diffracted light emerging from the specimen's surface. To best understand the specimen, it would be ideal for the microscope objective lens to collect as much of this diffracted light as possible. In practice, the objective lens can only capture light over a limited angular range (see Figure 2). It turns out that the spatial resolution with which one can examine a specimen of interest is inversely proportional to the collectable size of the diffracted light cone. If a lens can collect all of the diffracted radiation, then an image can be formed that resolves features down to the wavelength scale. However, if a lens situated far away (or with a small diameter) only captures a narrow cone, then the resulting image resolution is significantly worse.
Not surprisingly, an objective lens situated far away from the specimen can observe across a larger area, which leads to the inherent trade-off between the resolution and FOV of images mentioned above. Fourier ptychography applies a simple insight to overcome this trade-off, as diagrammed in Figure 2b. If the thin specimen is illuminated with a plane wave at an angle, then the diffracted light cone will rotate (but otherwise not change), allowing a new segment of the cone to enter the imaging lens and pass onto the digital image sensor. If the specimen is illuminated at a relatively large angle, then regions of the light cone that would not have originally entered the lens at all will now be able to pass through it and onto the image sensor.
Accordingly, Fourier ptychography uses an objective lens, situated far away from the specimen, that forms images over a large FOV and illuminates the specimen with a planar light wave from a series of angles. For each unique illumination angle, Fourier ptychography captures a low-resolution image of the specimen of interest. There are, of course, many possible ways to tilt an incident illumination beam to provide multi-angle illumination. Programmable light emitting diode (LED) arrays, which are inexpensive, readily available, and contain hundreds to thousands of individually addressable light sources in a small package, provide an extremely simple and effective means to achieve multi-angle illumination without any moving parts. Thus, an LED array often comprises the only hardware required to turn a standard digital microscope into a Fourier ptychographic microscope.
Fourier Transform Operations within the Microscope
The key to understanding Fourier ptychography, as the name suggests, is the Fourier transform. From a purely signal-processing perspective, the Fourier transform decomposes an arbitrary function into a sum of sinusoidal waves, where low-frequency waves correspond to slow variations within the function and high-frequency waves correspond to its rapid variations. By describing the optical properties of a specimen across space with a function, one can connect its resulting Fourier transform's lower frequencies to large and slowly varying spatial features, while its higher frequencies naturally define the specimen's fine details.
To understand the connection between the Fourier transform and the microscope, it is illustrative to think of a plane wave interacting with a diffraction grating (Figure 3). The higher the groove frequency of the grating, the larger the resulting diffraction angle of light, relative to its incident angle. Similarly, as the groove frequency approaches 0, the diffraction angle approaches 0. There is thus a one-to-one relationship between the groove frequency of the grating and its resulting diffraction angle. If a microscope lens is positioned above the grating to capture and focus the diffracting light, it will focus light to one or more points at specific locations, whose distance from the optical axis is proportional to the groove frequency. It is also clear that the lens can capture the diffracted light from the grating only if its acceptance angle (that is, the lens numerical aperture [NA]) is large enough. If light is diffracted at a high angle and cannot enter the lens, it is possible to rotate the incident plane wave to an oblique angle to cause some of the resulting diffracted light to pass through.
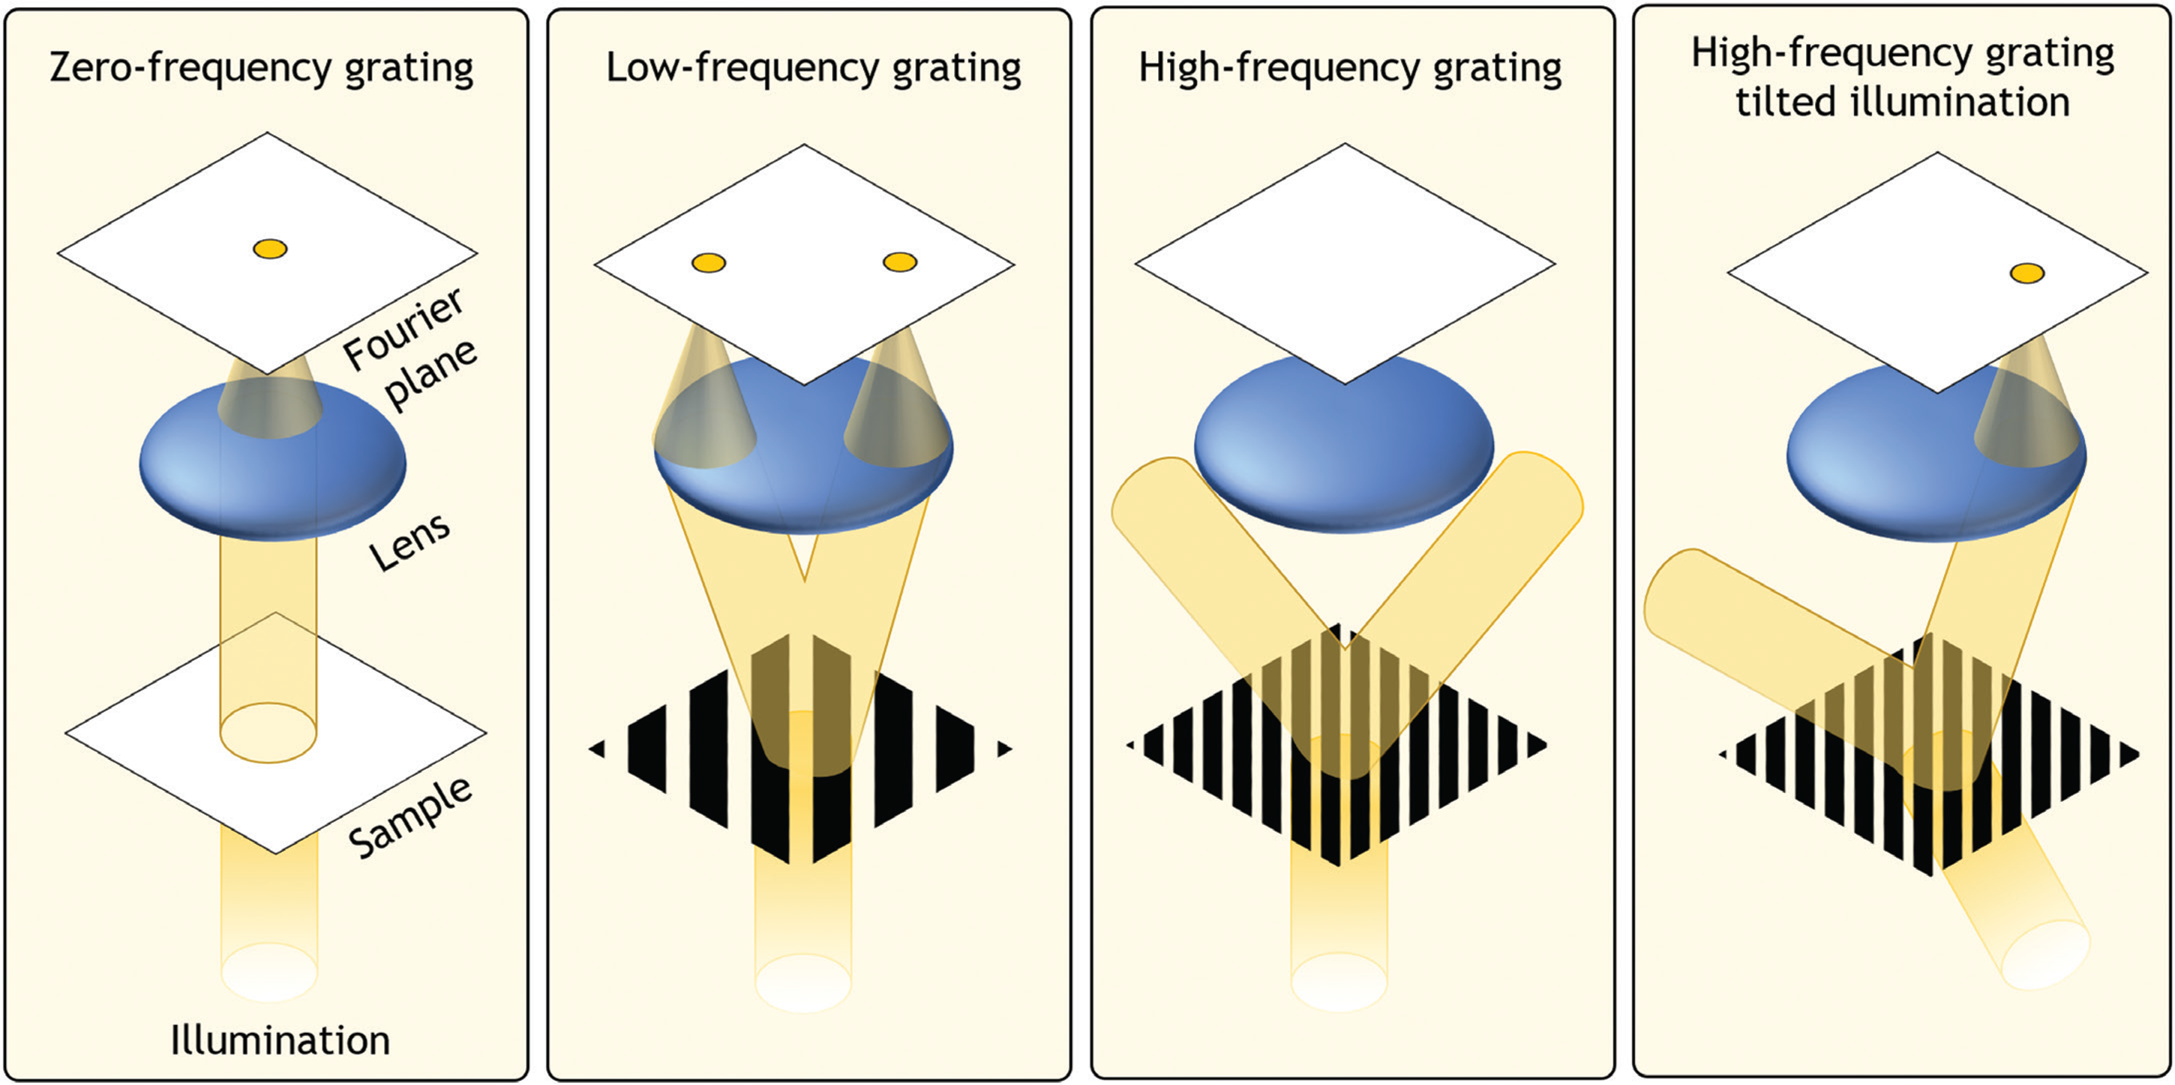
Figure 3: When a parallel beam of light illuminates an object, unique patterns of light are formed by a lens placed one focal length away. At this “Fourier plane,” the resulting spatial distribution of light is proportional to the Fourier transform of the object and is typically referred to as the object's Fourier spectrum. If the object contains fine details, the resulting diffracted light may not enter and pass through the lens, resulting in lost information. The same diffracted light can be partially transferred when the incident light beam is tilted.
From a Fourier transform perspective, the diffraction grating can be thought of as a very simple sample that contains only one dominant sinusoidal oscillation across space (that is, spatial frequency). A biological sample typically contains many low and high spatial frequencies, each of which has a one-to-one relationship with a diffraction angle. An arbitrary sample can thus be modeled as a superposition of various gratings composed of different spatial frequencies, and light that diffracts from it may be accurately described by the specimen's spatial Fourier transform at a particular plane (the Fourier plane). A key goal of high-resolution microscope design is to create a large Fourier space that passes a wide range of spatial frequencies. While the traditional method of achieving this is to increase the NA of the microscope objective, Fourier ptychography achieves this via a strategy that relies on tilted illumination and computation.
Putting the “Fourier” in Fourier Ptychography
With the above insights in place, we can now develop a mathematical picture for Fourier ptychography. Following from the information above, if a thin sample is illuminated with a perpendicular plane wave, then the beauty of physics specifies that the resulting spatial pattern of light, formed at a particular plane behind a lens, is described by the sample's Fourier transform. Due to the limited size of the microscope objective lens, only a small segment of this Fourier spectrum can pass through the imaging system and onto the image sensor (see diffracted spectrum in Figure 2). Mathematically, one can thus model the effect of a lens on a specimen's diffracted spectrum as a low-pass filter, which allows a narrow window of frequencies in the Fourier domain to pass unperturbed and otherwise filters out higher frequencies.
To form an image, the filtered Fourier spectrum that has passed through the microscope objective lens must next propagate to the image plane. Without dwelling on details, this process may be once again represented by a second Fourier transform, which returns the spectrum's spatial frequencies back into a spatial map of the specimen of interest, albeit at reduced resolution. When the specimen is illuminated with an angled plane wave, the specimen's Fourier spectrum will shift across the fixed lens aperture (Figure 2b), thus allowing measurement of a new windowed region of Fourier components. The amount of shift is specified by the angle of illumination where a larger angle yields a larger shift. By capturing many uniquely illuminated images at appropriately selected angles, Fourier ptychography records many segments of the Fourier transform that cover a large area (Figure 4). Fourier ptychography's subsequent computational goal is to combine the captured image data into a large, stitched Fourier spectrum composite, thus resolving higher-resolution features when inverted back into a final image.
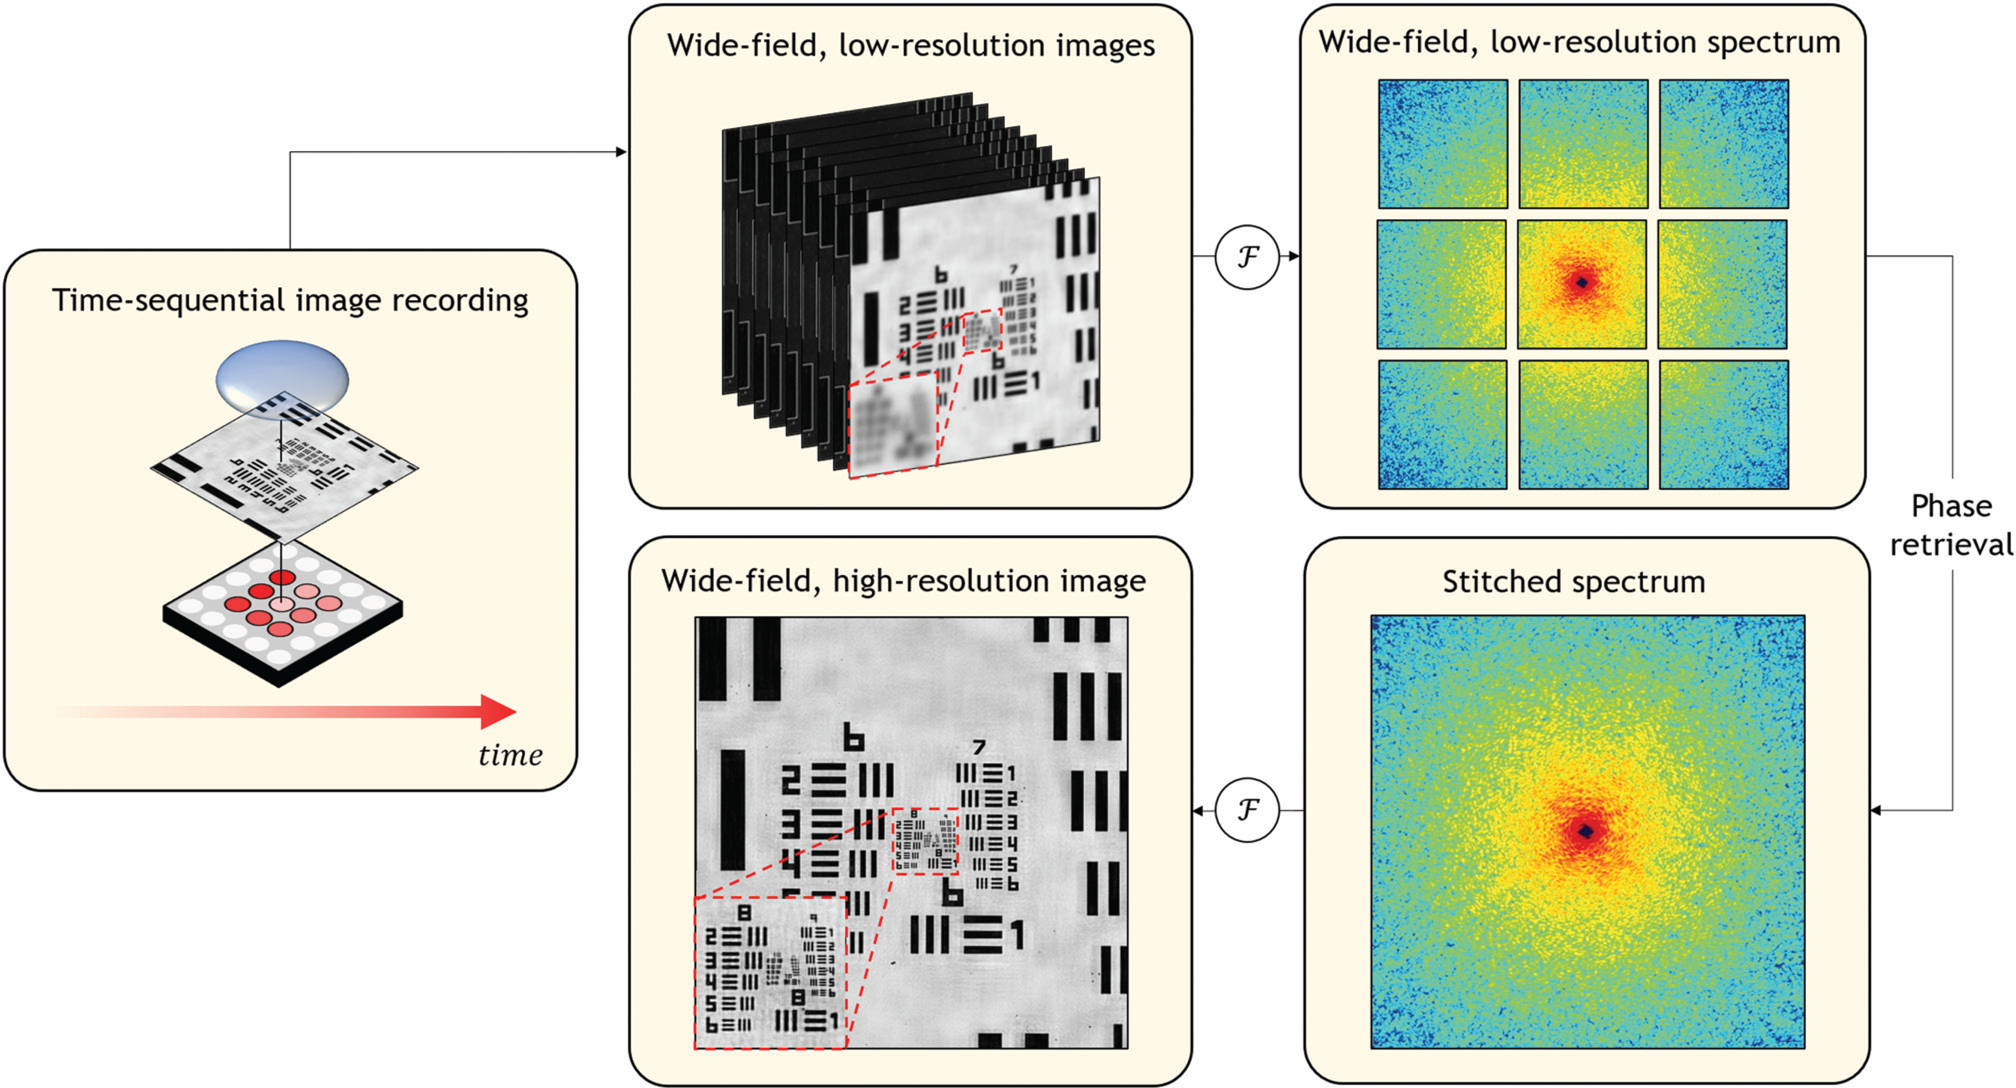
Figure 4: Fourier ptychography acquires multiple wide-area images, each under illumination from a different angle provided by an LED array. In the workflow above, the left image shows the central LED illuminating the center of the resolution sample. In the top row of the workflow, each low-magnification image is mathematically connected to a windowed component of the specimen's Fourier spectrum (here, 9 unique windows as shown top right). The central window is further processed in the bottom row of the workflow. The computational goal of Fourier ptychography is to synthesize a much larger Fourier spectrum, which is digitally Fourier transformed into the final high-resolution, large-area result. As the lack of measured phase prevents direct tiling in the Fourier domain, Fourier ptychography applies a phase retrieval algorithm to successfully produce a final high-resolution result as shown in the red boxed region in the bottom left panel of the workflow.
The Phase Problem
Diffraction is a wave phenomenon, which requires Fourier ptychography to consider light as an optical field that includes both an amplitude and a phase. Let's assume for a moment that it is possible for a digital image sensor to measure a complex-valued optical field at each image sensor pixel. In this case, after recording a sequence of uniquely illuminated images, Fourier ptychography's computational goal for high-resolution image formation is relatively straightforward. To reconstruct the sample's enlarged Fourier spectrum shown in Figure 4, one would first compute the Fourier transform of each image collected under illumination from each unique LED angle. For nine uniquely illuminated images at appropriate angles, this would form the nine Fourier windows shown in Figure 4. Next, using knowledge of each LED's angular position, one would correctly order and tile together these unique Fourier spectra into a larger composite. After tiling together all Fourier transform segments, the entire enlarged spectrum can then be inverse-Fourier-transformed into a final wide-area, high-resolution result. This approach is the foundation of a general technique termed synthetic aperture imaging, which is widely used in radar, ultrasound, and other imaging modalities in which it is possible to jointly measure the amplitude and phase of radiation.
At optical frequencies, however, it is not possible to directly measure the phase of an incident optical field, as digital image sensors only measure a signal that is proportional to the square amplitude of light. The lack of measured phase prevents correct execution of the above simple computations to obtain a final high-resolution image result. Accordingly, Fourier ptychography must overcome what is generally referred to as the “missing phase” problem [Reference Ou5].
A Preview for Part 2: Phase Retrieval Algorithms
The missing phase problem from image measurements using conventional detectors is well-known, and a variety of methods over the history of microscopy have been developed to determine phase via amplitude-only measurements. Phase contrast is, of course, extremely important in microscopy, as many specimens of interest are essentially transparent. Many physical methods for producing phase contrast within a microscope are readily available. With the advent of digital microscopy, “quantitative” phase imaging methods have become increasingly popular, as opposed to qualitative methods that convert phase contrast into intensity contrast for direct viewing. Thanks to the work of many scientists and mathematicians, there is now a suite of “phase retrieval” algorithms that are available to convert standard digital images, such as those acquired by Fourier ptychography [Reference Ou5], into amplitude and phase reconstructions, given that a number of key conditions are met. In Part 2 of this series, we will detail how phase retrieval algorithms are leveraged by Fourier ptychography to produce gigapixel-sized large-area, high-resolution images and quantitative phase maps using relatively simple microscope hardware.


 Open access