


Introduction
Recent technological developments, such as the FlowCytobot [Reference Olson and Sosik1], have revolutionized the in situ study of microorganisms such as diatoms, plankton, and microalgae at the 10 µm scale and above. However, smaller micron-scale organisms (bacteria and archaea) remain a neglected group of organisms for which limited environmental in situ imaging has been performed [Reference Dickinson and Hurst2], largely because of the challenges placed on the imaging system.
Prokaryotic life is limited by nutrient diffusion into the cell, restricting most bacteria and archaea to sizes in the range of 0.4–2.0 µm [Reference Marshall3]. Not only are cells small, but they lack distinctive features such as nuclei and other membrane-bound organelles, making them difficult to distinguish microscopically from debris (Figure 1). Imaging systems with sufficient resolution to identify objects at this size scale generally have very limited field of view and depth of field. This makes it difficult to observe a large number of interactive microorganisms and requires active focus and stage motion to track a single organism for even short times. Because of the need for instantaneous volume imaging, implementation of such features in a system for field use is daunting even if equipped with adaptive lenses.
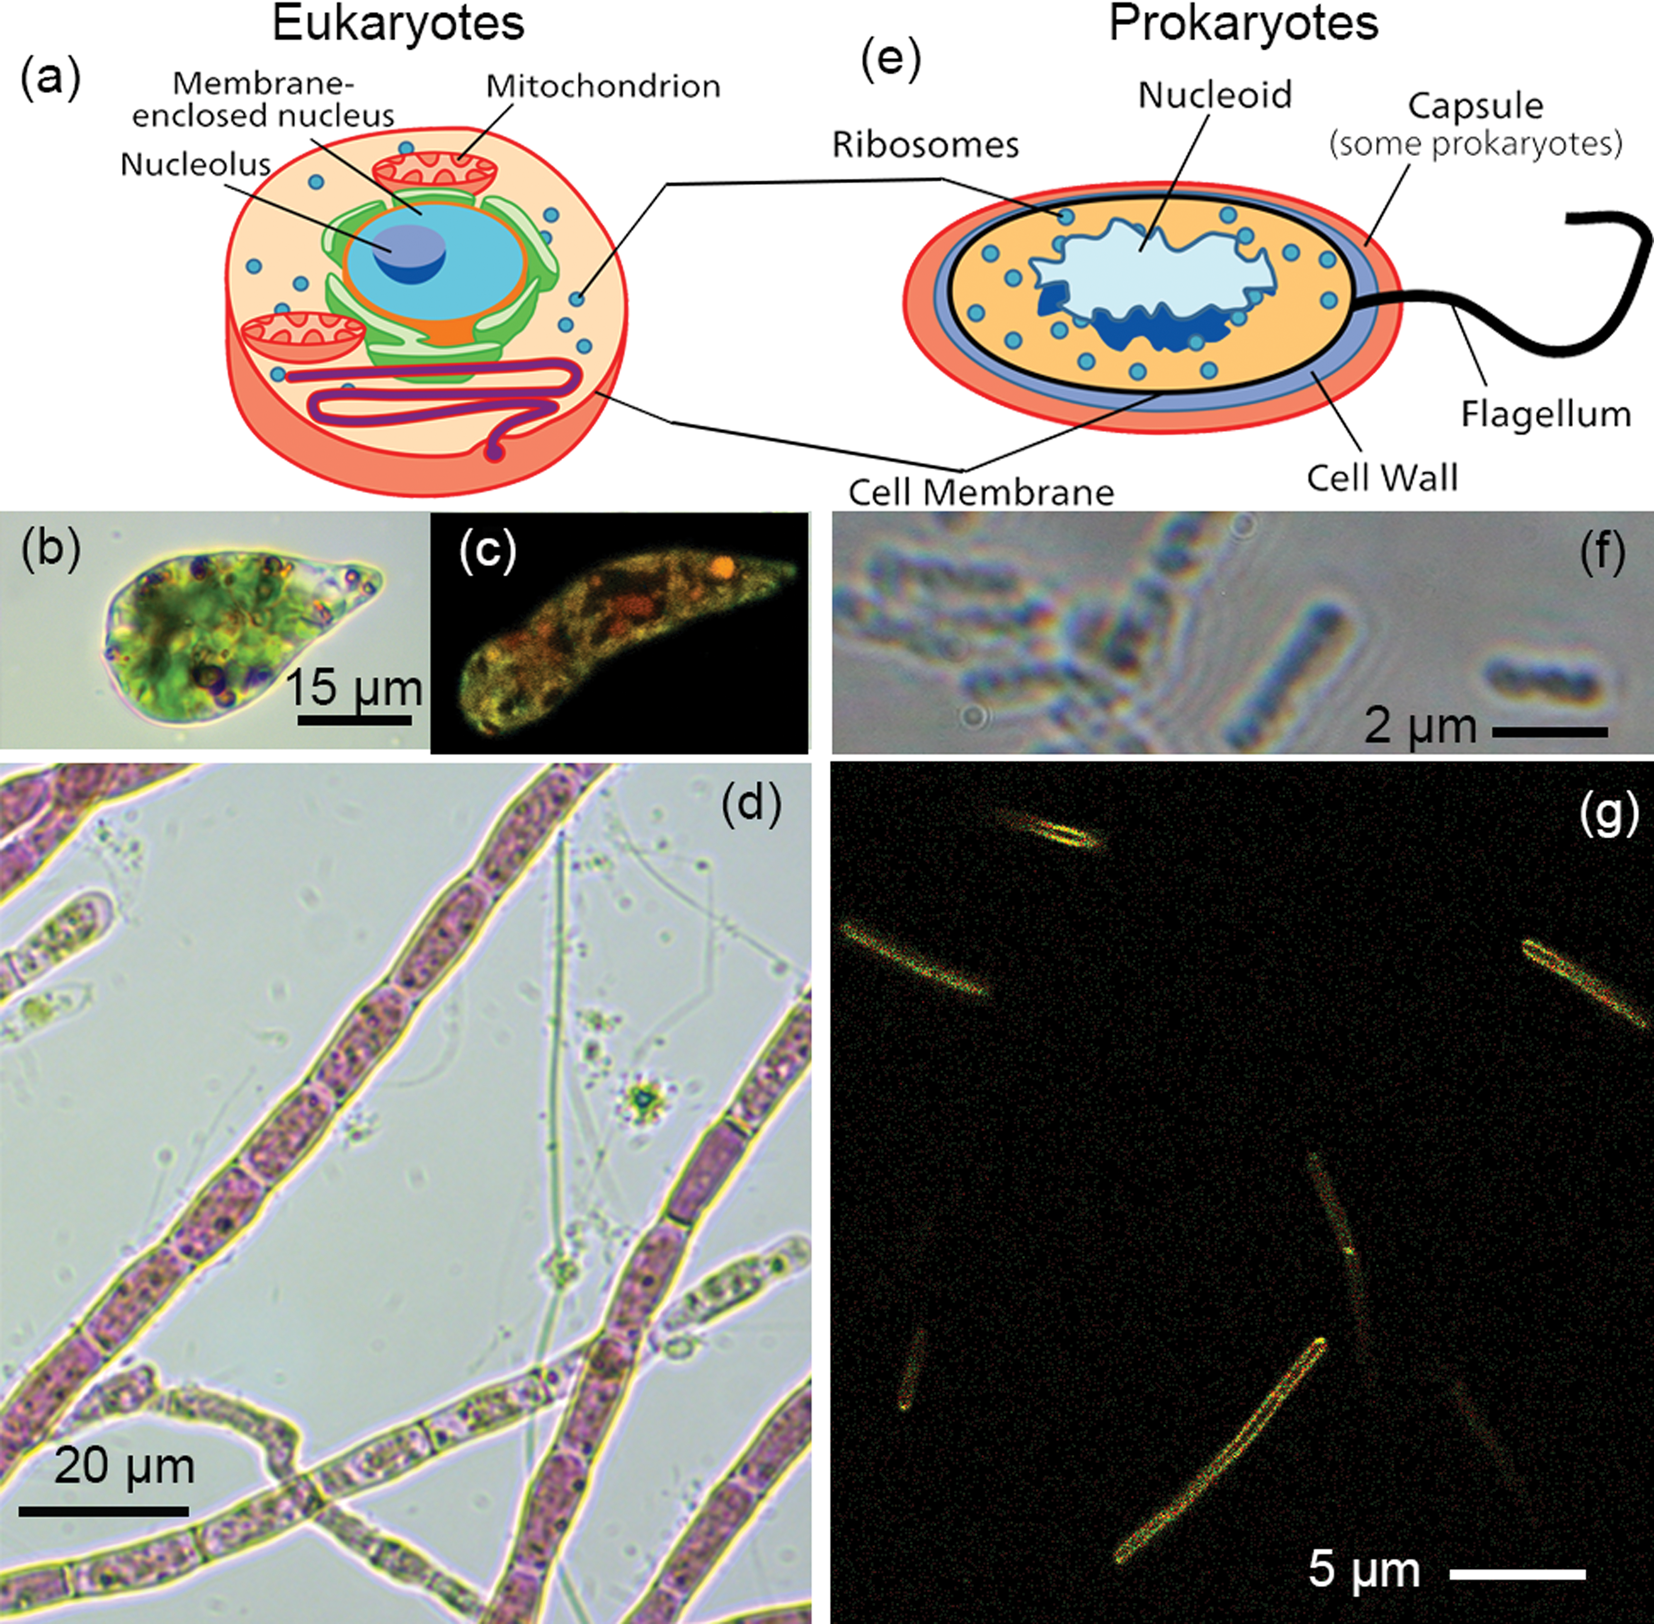
Figure 1: Eukaryotes versus prokaryotes. (a) Eukaryotic cells are typically >10 µm in diameter and possess membrane-bound organelles such as a nucleus and mitochondria. (b) Example of a single-celled eukaryote, Euglena gracilis, in brightfield. (c) Fluorescence image of Euglena gracilis. (d) Algae, such as these Acrochaetium, often form complex assemblies of cells. (e) Prokaryotes—bacteria and archaea—are typically 1–2 µm in diameter and have no membrane-bound organelles. The DNA is located in a “nucleoid” region, but no nuclear membrane is present. (f) The highest resolution light micrographs reveal few cellular features. This image shows the gut bacterium Escherichia coli in phase contrast. (g) Dyes targeted to membranes or nucleic acids can show some cellular features of prokaryotes. This image shows the soil bacterium Bacillus subtilis labeled with the membrane dye FM1-43.
In this paper, we report a multi-modal microscope called the Extant Life Volumetric Imaging System (ELVIS) designed for field use that integrates two modalities into a common instrument: digital holography microscopy (DHM) and fluorescence light-field microscopy (FLFM). ELVIS provides synchronous volumetric imaging of three types: fluorescence, intensity (bright-field), and quantitative phase. Both the DHM and FLFM components of the combined instrument are closely based on previously published designs [Reference Wallace4,Reference Serabyn5].
DHM is an interferometric technique that results in full electric field measurements of the sample volume. Off-axis holographic images may be reconstructed into intensity (bright-field) and quantitative phase images plane-by-plane through volumes ~100 times deeper than those imaged using ordinary bright-field microscopy [Reference Cuche6]. Amplitude and bright-field images are equivalent. However, quantitative phase imaging is an emerging technique in biology and materials science and has no direct counterpart in ordinary light microscopy. In quantitative phase imaging the phase shift of the light wave passing through the specimen is proportional to the product of the specimen's thickness and the difference in the refractive index from the surrounding medium. The phase shift information can be used to differentiate bacteria from minerals, to identify malignant cells in a tissue sample, to monitor the flux of water into and out of cells via ion channels, and to monitor neuronal function [Reference Marquet7,Reference Lee8].
Fluorescence microscopy is a ubiquitous tool in biology that allows for specific labeling of subcellular structures, enzymatic processes, individual proteins or nucleic acid sequences, and much more. A combined intensity/quantitative phase/fluorescence microscope would offer one-of-a-kind volumetric analysis. The problem lies in adding fluorescence capability to a technique such as DHM that is focus-free. Because DHM works on the principle of interfering coherent light, it does not directly support volumetric fluorescence imaging, and when coupled with fluorescence using traditional microscopes, imaging has been limited to a single plane [Reference Pavillon9,Reference Quan10]. This means that either most of the sample is missed by the fluorescence analysis or that it must be filtered onto a flat substrate, which disturbs correspondence between the DHM and fluorescence images.
In FLFM, the 3D light field of the sample is transformed into a 2D image using a microlens array, thus enabling a 2D camera to image the 3D sample volume [Reference Broxton11–Reference Serabyn13]. Computational reconstruction is then used to generate the 3D image of the sample from its 2D light-field image. FLFM suffers the trade-off of reduced lateral resolution compared to conventional microscopy carried out with similar numerical apertures. Depending on instrument goals, this can be partially mitigated by increasing the detector array size and appropriate lenslet array selection. However, the capability of synchronous volumetric imaging could offer game-changing prospects for many applications, particularly when combined with a DHM that provides high resolution in both amplitude and phase imaging.
Here we present a design for a combined DHM/FLFM instrument and quantify its performance using test samples. The trade-offs in volume versus resolution are discussed and future improvements suggested. In a second paper to be published in Microscopy Today, we will present data collected from cultured bacterial and in situ environmental microorganisms to demonstrate practical applications of the combined DHM/FLFM system.
Materials and Methods
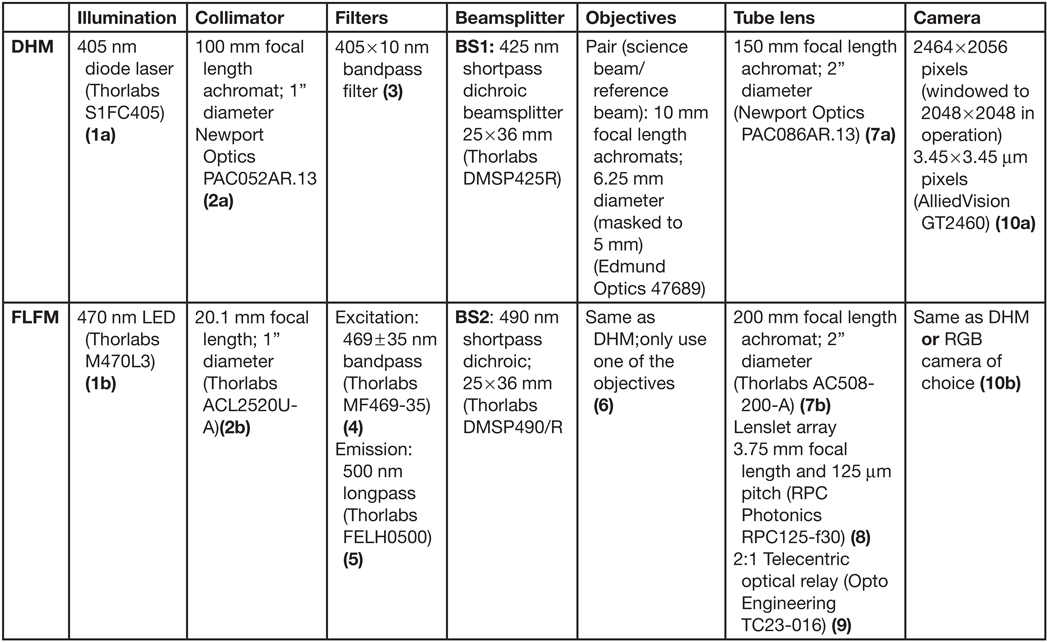
The design of the DHM side of the instrument has been described in detail [Reference Wallace4], with small differences in component selection for the combined DHM/FLFM instrument (Table 1). The DHM/FLFM system was developed with the goal of using a single objective, or a set of objectives, for both modes of the instrument, but with otherwise independent optics. In principle the DHM light source can be used for the FLFM illumination, but in practice there are advantages, described below, to using separate illumination capability for both modes. Note that one of our goals was to make use of relatively simple and inexpensive objective lenses to reduce the cost, complexity, and number of optical surfaces involved. Figure 2 shows a schematic and photo of the instrument, illustrating the instrument elements listed in Table 1.
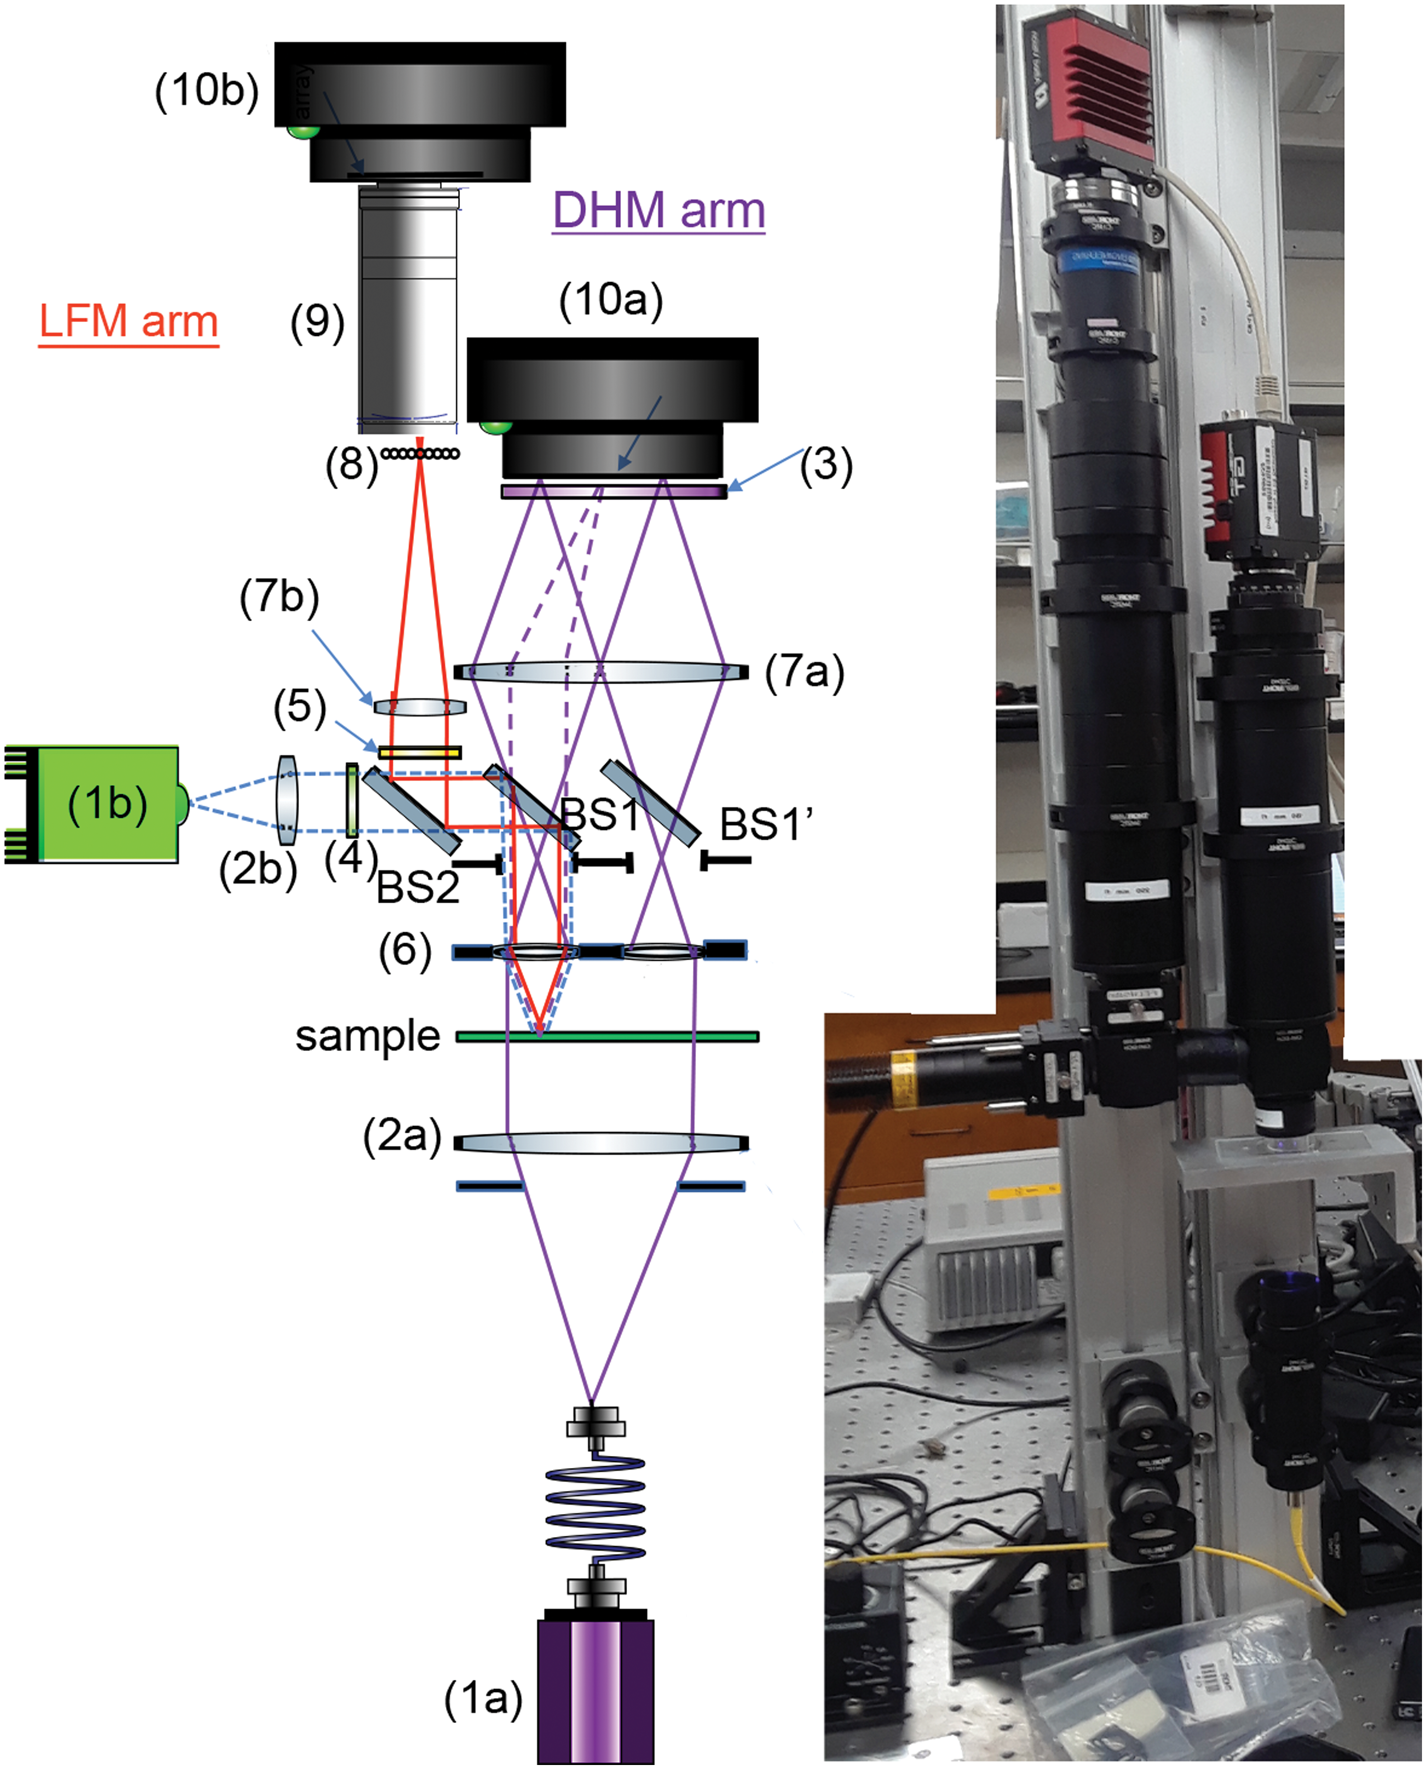
Figure 2: Schematic (left) and photo (right) of the instrument, with labels corresponding to the parts in Table 1. Note: BS1 and BS1’ are the same optic.
Table 1: Optical components for ELVIS. The numbered parts are shown in the schematic in Figure 2.
Results
ELVIS standardized sample testing.
Amplitude resolution laterally (x, y) and axially (z), depth of field, and phase sensitivity were all measured using U.S. Air Force (USAF) test targets [Edmund Optics SKU 58-198]. DHM-mode amplitude reconstructions without noise subtraction showed lateral resolution better than 0.9 µm (Figure 3a). No measurable loss of resolution in the reconstructed images was seen at a range of 900 µm in z. Since this exceeded the depth of our sample chambers, we did not measure depth of field farther. A measure of axial resolution was obtained by translating the micrometer stage a known distance in z and comparing this known distance with the position of best reconstructed focus. These values should differ by the square of the magnification of the system (approximately 218). A best fit to these values gives a slope of 228 with fit residuals of 9.6 µm at the sample, which corresponds to 4.4 µm axial resolution (Figure 3b).

Figure 3: DHM/FLFM test target (TT) images. Only a portion of the field of view is shown. The total field of view was 478 × 478 µm. (a) Amplitude reconstruction of USAF TT showing resolution better than group 9, element 2 (0.87 µm line widths). (b) The reconstructed best-focus position versus the actual position, allowing an estimate of axial resolution of 4.4 µm (see text). (c) Phase reconstruction of USAF phase TT with known widths. (d) Phase delay in nm versus the actual thickness in nm (data points shown as open circles) with best linear fit, permitting estimate of phase resolution (see text). (e) Raw FLFM image of USAF TT. (f) Reconstructed FLFM image showing resolution of group 6, element 5 (4.92 µm line widths).
A phase target consisting of patterns of known thickness was imaged, and the difference between the averages of a patch within the largest square and a similar patch just outside was measured (Figure 3c). The graph in Figure 3d plots the measured phase delay in nm versus the actual thickness in nm. The best fit slope is 0.52 +/− 0.02 (with a small offset). The slope corresponds to n-1, where n is the index of refraction of the phase material, corresponding to the manufacturer's value. The residuals are 4 nm, or 1% of a wave.
On the FLFM side, the field of view was measured to be 790 × 660 µm, which exceeded that of the DHM. The two fields of view overlapped to a large extent, but not completely. Figures 3e and 3f show raw and reconstructed USAF target images obtained with the FLFM that resolved line group 6,5, implying a resolution after reconstruction of 4.9 µm. The lateral resolution degraded with axial offset, leading to a depth of field of 150 µm with a resolution of 5.5 µm, and 300 µm for 7.0 µm resolution.
Axial resolution was also measured using 100 nm SiO2 beads (Polysciences, Inc. 24041-10). Amplitude and phase reconstructions of the beads are shown in Figures 4a and 4b. Both images were de-noised by translating the stage while imaging and using the median image to subtract amplitude background; a reference hologram containing no beads was used to remove noise in phase. These procedures are described in detail elsewhere [Reference Cohoe15]. Amplitude and phase x-z slices are shown in Figures 4c and 4d.
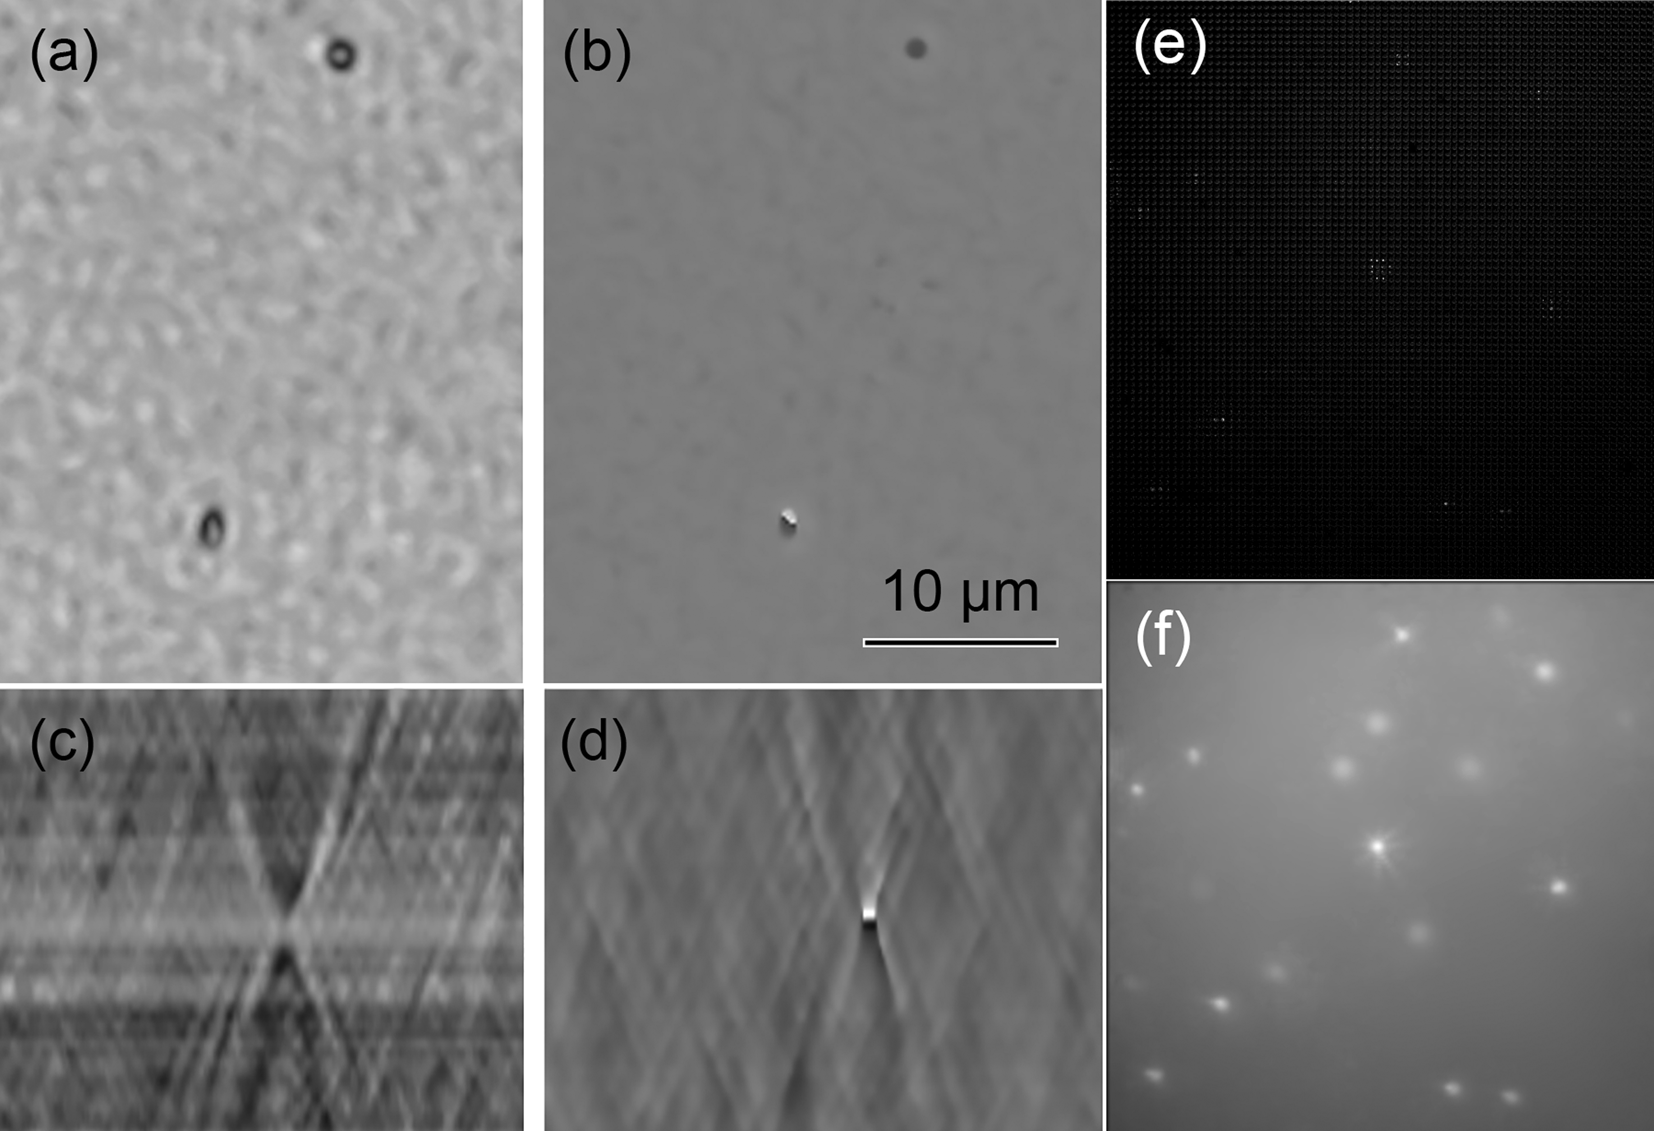
Figure 4: Resolution and fluorescence sensitivity using beads. (a) 100 nm beads in a single plane amplitude reconstruction. (b) 100 nm beads in phase. (c) Amplitude in the xz plane of a single bead. (d) Note how the phase flips from dark to light across the focal plane; this is a manifestation of the Gouy phase anomaly. (e) Raw FLFM image of 3 µm fluorescent beads. (f) Maximum intensity projection of reconstructed LFM bead image.
Fluorescence sensitivity was ascertained using fluorescent SiO2 beads (Polysciences, Inc. 24330-15). Figure 4e shows a raw image of 3 µm beads, and Figure 4f shows a maximum intensity projection through the sample.
Early issues with the instrument that were identified and ameliorated were (a) high background fluorescence, with resulting low sensitivity so that even labeled bacteria could not be identified under the FLFM; and (b) monochromatic fluorescence that did not permit distinguishing dye labeling from chlorophyll autofluorescence, or the use of 2 different dyes. Simple modifications resulted in improved performance. The 3D-printed objective lens holder was found to show significant autofluorescence, so it was replaced by a holder made of anodized aluminum. The use of an RGB camera was also used on the FLFM side to distinguish chlorophyll from common dyes (Figure 5) without the need to insert or change filters.
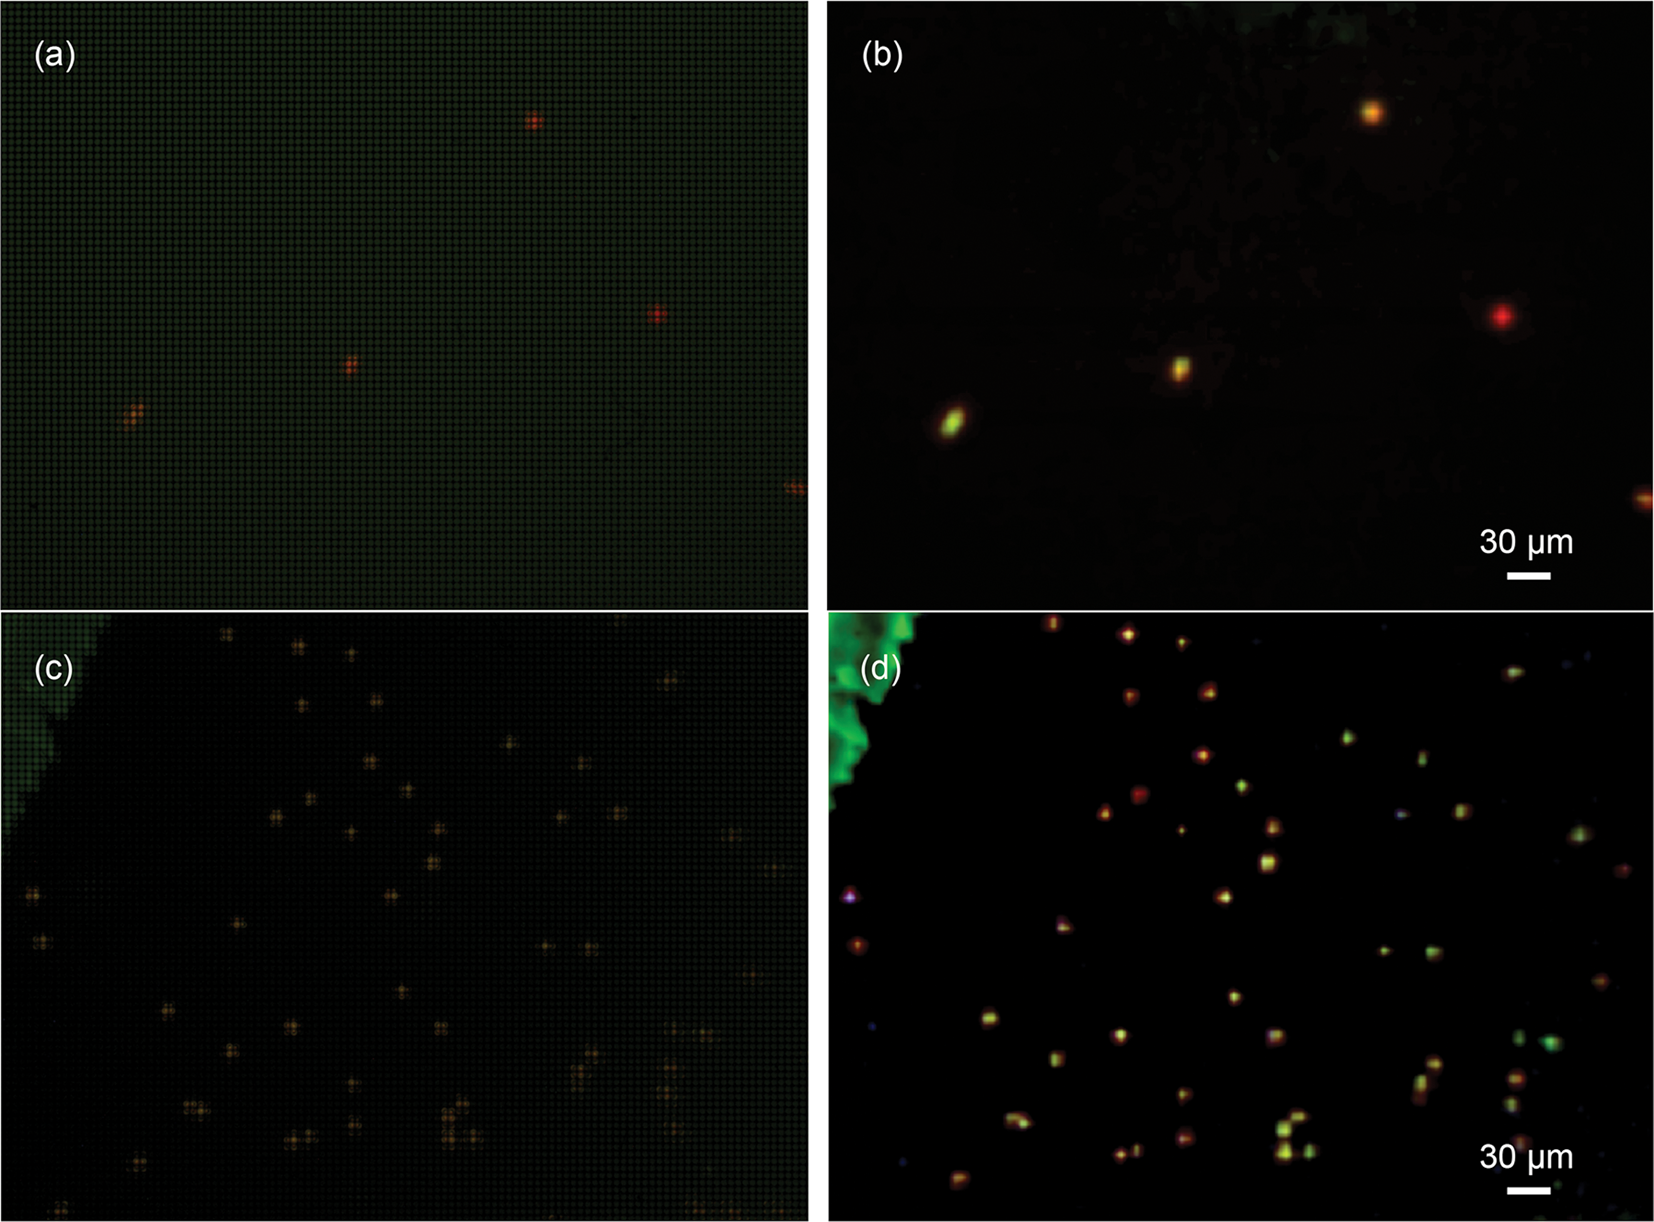
Figure 5: Use of an RGB camera with long-pass emission to discriminate acridine orange (AO) from chlorophyll. The samples are Euglena gracilis raw (a) and reconstructed (b), and Chlamydomonas sp. raw (c) and reconstructed (d).
Software.
Acquisition and real-time DHM reconstruction were performed using a custom package, DHMx, written by our group. DHMx runs under Linux and is open-source (https://github.com/dhm-org/dhm_suite). FLFM reconstruction was performed using another group's open-source package [Reference Bolan14]. Full amplitude and phase reconstructions were made using custom Fiji plug-ins that we have published previously [Reference Cohoe15].
Discussion
The combined DHM/FLFM system provides multimodal volumetric imaging, but trade-offs were made to permit the combination, which can be further optimized for particular applications.
The first major trade-off in the design of the instrument was the choice to use a shared set of objectives for both modes of the microscope. In early development we considered both this shared-objective design and a second design that used two fully independent microscopes observing the same volume at crossed angles. The shared objectives architecture ensures straightforward co-registration of the fields of view. The choice of objectives then sets both the capability and to some extent the size of the instrument. We have been working with simple aspheric and achromat objectives in order to make an instrument that is more rugged for field use and to avoid optical elements that might adversely affect the ability to obtain high fringe contrast in the DHM. Simple aspheric objectives are sufficient for the DHM, but their chromatic aberration can move the focus for many desired wavelengths far enough out of focus as to be effectively useless for imaging broad bands of light. Simple achromatic doublet objectives help mitigate this, and compound-apochromat or super-apochromat objectives could improve this further. Compound objectives must be selected carefully—many that are optimized for bright-field microscopy have elements that affect polarization and thus the interference in the DHM. We have found that at least some high-quality objectives designed for metallurgy provide both good DHM and fluorescence performance.
A second significant trade-off is in the lateral resolution of the fluorescence microscope mode. In the implementation shown here the same model of camera was used for both microscopes for low cost and because our intended long-term application as an in situ planetary instrument drastically limits the rate and volume of data return compared to a laboratory environment [Reference Hand16]. Increasing the pixel count and enlarging the sensor size on the FLFM detector is a straightforward way to improve the lateral resolution without a loss of field of view. The FLFM camera and detector could even be chosen to provide resolution, depth of field, and field of view comparable to the DHM, at the expense of a substantially increased data volume and likely a small increase in power consumption.
One might ask then why the dual instrument is still valuable at the design point where both have comparable resolution and field. Why not just the FLFM? The DHM mode offers label-free imaging of many otherwise transparent or translucent objects in the field, providing a survey capability that does not require any a priori knowledge of the characteristics of the objects in the field. Fluorescence microscopy typically requires some knowledge of the objects of interest—either excitation wavelengths of autofluorescent elements or chemical characteristics so that appropriate dyes can be selected. The DHM mode can readily detect objects that have only a few percent index difference to the surrounding medium and provides diffraction-limited resolution of the volume.
Another trade-off in the design of the instrument is the selection of a color versus monochrome camera on the FLFM side. The initial instrument described here was optimized for broad detection and discrimination of cells from mineral objects and so was designed around a small group of dyes. For fully correlated real-time observation of all dyes simultaneously, a color camera filter set with isolated excitation and detection bands is valuable, but some applications could use a monochrome camera and selectable single-band filters.
Conclusion
The combined DHM-FLFM allows for fluorescence detection in addition to volumetric amplitude and phase imaging. Although the spatial resolution of the FLFM is lower, the fluorescent signal can be matched to the higher-resolution DHM images to confirm cellular localization. The addition of RGB fluorescence detection and pulsed illumination will greatly improve the fluorescence capability by adding specificity and reducing phototoxicity and photobleaching. The simple design and open-source software make this instrument readily accessible to potential users.
Acknowledgements
Portions of this work were performed under a contract from the Jet Propulsion Laboratory, California Institute of Technology and at the Jet Propulsion Laboratory, California Institute of Technology under contract with the National Aeronautics and Space Administration. Portions of this work were supported by NSF Award #1828793.


