


Introduction
Down syndrome (DS) is a genetically based disease caused by triplication of chromosome 21 and affecting about 1 in 700 new borns (Parker et al., Reference Parker, Mai, Canfield, Rickard, Wang, Meyer, Anderson, Mason, Collins, Kirby and Correa2010). In addition to the numerous health conditions characterizing this syndrome, persons with DS exhibit severe muscle weakness associated with a deficit in motor coordination, balance, and postural control (Rigoldi et al., Reference Rigoldi, Galli, Mainardi, Crivellini and Albertini2011; Malak et al., Reference Malak, Kotwicka, Krawczyk-Wasielewska, Mojs and Samborski2013). This significantly limits their daily life and functional work capacity (Carmeli et al., Reference Carmeli, Ayalon, Barchad, Sheklow and Reznick2002a, Reference Carmeli, Barchad, Lenger and Coleman2002b; Cowley et al., Reference Cowley, Ploutz-Snyder, Baynard, Heffernan, Jae, Hsu, Lee, Pitetti, Reiman and Fernhall2010).
Understanding of the DS-associated muscle condition is limited. Research that utilizes animal model systems allows for a high level of experimental control, integrative methods and analyses, and the potential for studying causal biological mechanisms. A focus on animal models of DS that have translational relevance to humans would allow for studies of common and causal mechanisms involved in the muscular deficit of DS.
The Ts65Dn mouse is the most extensively studied murine model of DS having a partial trisomy involving a portion of the mouse chromosome 16, which is homologous to the human chromosome 21 (Davisson et al., Reference Davisson, Schmidt, Reeves, Irving, Akeson, Harris and Bronson1993). The Ts65Dn mouse shares with the human condition a remarkable number of phenotypic traits, including structural and cognitive alterations of the brain, Alzheimer's-like brain pathology, craniofacial alterations, and congenital heart defects (Reeves et al., Reference Reeves, Irving, Moran, Wohn, Kitt, Sisodia, Schmidt, Bronson and Davisson1995; Richtsmeier et al., Reference Richtsmeier, Baxter and Reeves2000; Moore, Reference Moore2006; Choi et al., Reference Choi, Berger, Mazzella, Morales-Corraliza, Cataldo, Nixon, Ginsberg, Levy and Mathews2009). Similar to DS persons, the Ts65Dn mouse also presents DS-like motor dysfunctions inclusive of skeletal muscle weakness (Costa et al., Reference Costa, Stasko, Schmidt and Davisson2010) as well as gross motor and muscle phenotypes (Costa et al., Reference Costa, Walsh and Davisson1999). Deficits in grip strength and motor coordination, as well as running and swimming speeds, were also found (Costa et al., Reference Costa, Stasko, Schmidt and Davisson2010). However, an intriguing lack of obvious functional deficit in the Ts65Dn skeletal muscle has been shown (Cowley et al, Reference Cowley, Keslacy, Middleton, DeRuisseau, Fernhall, Kanaley and DeRuisseau2012). The limited number of morphological studies on the Ts65Dn locomotor muscles reports no difference in the proportion of myofiber types or myofiber size in the hindlimb of trisomic versus euploid animals (Cowley et al, Reference Cowley, Keslacy, Middleton, DeRuisseau, Fernhall, Kanaley and DeRuisseau2012, Reference Cowley, Nair, DeRuisseau, Keslacy, Atalay and DeRuisseau2017; Pawlikowski et al., Reference Pawlikowski, Betta, Elston, Williams and Olwin2018). From the metabolic point of view, microarray analysis identified alterations in pathways involved in glucose and fat metabolism, as well as ATP biosynthesis, indicating a possible limitation of mitochondrial function in the soleus muscle of Ts65Dn mice (Cowley et al., Reference Cowley, Keslacy, Middleton, DeRuisseau, Fernhall, Kanaley and DeRuisseau2012). This was in agreement with the presence of structurally altered mitochondria in the quadriceps muscle fibers of the same mouse strain (Cisterna et al., Reference Cisterna, Costanzo, Scherini, Zancanaro and Malatesta2014). Interestingly, low respiration rate and decreased ATP production and mtDNA content were reported in neural progenitor cells from adult trisomic Ts65Dn mice (Valenti et al., Reference Valenti, de Bari, de Rasmo, Signorile, Henrion-Caude, Contestabile and Vacca2016); in addition, impaired mitochondrial homeostasis was reported in both persons with DS and animal models of DS (Mollo et al., Reference Mollo, Cicatiello, Aurilia, Scognamiglio, Genesio, Charalambous, Paladino, Conti, Nitsch and Izzo2020), thus suggesting a general alteration in mitochondrial bioenergetics and biogenesis in DS.
In the present study, we focused our attention on the quadriceps femoris muscle, considered the primary mover of the leg (Pratt & Lovering, Reference Pratt and Lovering2014). The quadriceps muscle is mostly composed of fast type II fibers (about 90% in the mouse; Zancanaro et al., Reference Zancanaro, Mariotti, Perdoni, Nicolato and Malatesta2007), which are known to be mainly affected by age-related atrophy (Lexell, Reference Lexell1995). Previous works suggested, in fact, that DS is characterized by a multi-systemic early aging (Roth et al., Reference Roth, Sun, Greensite, Lott and Dietrich1996; Nakamura & Tanaka, Reference Nakamura and Tanaka1998). We herein adopted an innovative approach combining light and electron microscopy, immunohistochemistry, and morphometry with nuclear magnetic resonance metabolomic analysis, with an aim at characterizing the skeletal muscle fiber of the quadriceps muscle in trisomic and euploid Ts65Dn mice. Results lead the way to powerful insight into the structural and functional characteristics of the trisomic skeletal muscle.
Materials and Methods
Animals
Ts65Dn [strain: B6EiC3Sn.BLia-Ts(17 < 16>)65Dn/DnJ] breeder mice were obtained from the Jackson Laboratory, ME, USA. The colony was maintained by breeding trisomic female mice to euploid B6EiC3Sn.BLiAF1/J males. Pups were weaned at 21 days of age. Tissue for genotyping was obtained from tail clips in p11 mice. Genotyping was accomplished by Mmu17 translocation breakpoint separated PCR (Reinholdt et al., Reference Reinholdt, Ding, Gilbert, Czechanski, Solzak, Roper, Johnson, Donahue, Lutz and Davisson2011).
Sixteen (eight trisomic and eight euploid) male Ts65Dn mice (The Jackson Laboratory, ME, USA) aged 8 ± 3.10 months were initially used in this work. However, due to technical problems with specimen handling, and the limited availability of adult trisomic Ts65Dn mice in the colony, results are presented from four trisomic (two for morphology and two for 1H NMR analysis) and eight euploid mice (four for morphology and four for 1NMR analysis).
The mice, housed in groups of 3–4 by genotype, were maintained under standard conditions (24 ± 1°C ambient temperature, 60 ± 15% relative humidity, and 12 h light/dark cycle) and fed ad libitum with a standard commercial chow. The animals had only spontaneous free-moving activity in the cage. The trisomic mice presented deficits in balance and motor coordination by month 4 of age accordingly with previous studies (Costa et al., Reference Costa, Walsh and Davisson1999).
The experimental protocol was approved by the Italian Ministry of Health (ref.: 538/2015-PR).
Tissue Processing
Ts65Dn mice were deeply anesthetized using Tribromoethanol (TBE) drug and perfused transcardially with 0.1 M phosphate buffer solution (PBS) followed by 4% paraformaldehyde in PBS. After perfusion, the vastus lateralis and rectus femoris muscle were quickly removed and samples (about 1 mm3) therefrom were further placed for 2 h at 4°C in either a 2.5% glutaraldehyde plus 2% paraformaldehyde solution (samples intended for ultrastructure) or 4% paraformaldehyde and 0.2% glutaraldehyde in 0.1 M PBS (samples intended for immunohistochemical evaluation at fluorescence microscopy). After fixation, samples for ultrastructural morphology were rinsed with PBS, postfixed with 1% OsO4 for 2 h at 4°C, dehydrated with acetone and embedded in Epon 812. For immunohistochemistry, samples were washed in PBS, treated with 0.5 M NH4Cl solution in PBS for 45 min at 4°C to block free aldehyde groups, dehydrated in graded concentrations of ethanol at room temperature and embedded in LRWhite resin.
Due to the small size of the muscles, the rectus femoris and vastus lateralis from the right leg were used for ultrastructural morphology and those from the left leg were processed for immunohistochemistry. Each muscle was cut transversely at mid-length; during the embedding procedure, care was taken to allow for one muscle half to be sectioned transversely and the other one longitudinally.
Morphological and Morphometric Evaluation
For ultrastructural morphology, ultrathin (70–90 nm thick) sections of Epon-embedded muscles were stained with lead citrate for 1 min and observed in a Philips Morgagni transmission electron microscope operating at 80 kV and equipped with a Megaview III camera for digital image acquisition.
For fiber typing, 2 μm-thick cross sections of LRWhite embedded muscles were submitted to immunohistochemical procedures to distinguish fast and slow fibers (Zancanaro et al., Reference Zancanaro, Mariotti, Perdoni, Nicolato and Malatesta2007). Briefly, sections were incubated for 2 h at room temperature with a mouse monoclonal antibody recognizing the heavy chain of skeletal fast fiber myosin (clone MY-32, Sigma-Aldrich, Buchs, Switzerland) diluted 1:200 in PBS; the antigen–antibody complex was revealed with an Alexa 488 conjugated antibody against mouse IgG (Molecular Probes, Invitrogen, Milan, Italy). The sections were finally counterstained for DNA with 0.1 μg/mL Hoechst 33258. Micrographs were taken with an Olympus BX51 microscope equipped with a 100 W mercury lamp under the following conditions: 330- to 385-nm excitation filter (excf), 400-nm dichroic mirror (dm), and 420-nm barrier filter (bf), for Hoechst 33258; 450- to 480-nm excf, 500-nm dm, and 515-nm bf for Alexa 488. Images were recorded with an Olympus Camedia C-5050 digital camera. In immunolabeled samples, the percentage of fast and slow muscle fibers was calculated on a minimum of 100 myofibers per muscle (vastus lateralis and rectus femoris), with at least 650 myofibers measured per group (trisomic and euploid). On the same myofibers, the percentage of cells with central myonuclei was calculated. Micrographs were taken at an on-scope magnification of 20× and processed with the ImageJ software (NIH). The minimum Feret's diameter (the minimum distance of parallel tangents at opposing borders of the muscle fibers (Briguet et al., Reference Briguet, Courdier-Fruh, Foster, Meier and Magyar2004) was measured on a minimum of 70 myofibers per muscle (vastus lateralis and rectus femoris) per animal, inclusive of fast and slow fibers. The minimum Feret's diameter is very insensitive against deviations from the “optimal” cross-sectioning profile, however, reliably detecting differences between muscles (Briguet et al., Reference Briguet, Courdier-Fruh, Foster, Meier and Magyar2004).
For morphometric evaluation of ultrastructural variables (Z line length, number of mitochondria and lipid droplets, as well as mitochondrial area and cristae length), ultrathin sections of Epon-embedded, longitudinally sectioned muscle were used. Measurements were made by using the Radius software for image acquisition and elaboration implemented in the Philips Morgagni transmission electron microscope. In order to analyze myofibril size, the Z line length (an estimate of sarcomere diameter; Luther, Reference Luther2009) of at least 50 myofibrils per muscle (vastus lateralis and rectus femoris) per animal was measured (at a microscope magnification of 7,100×), avoiding the myofiber periphery. The area of intermyofibrillar mitochondria and lipid droplets was also measured (again at a microscope magnification of 7,100×); their respective total areas were calculated and expressed as the percentage of measured myofiber area (300 μm2 per muscle and animal). Finally, the sectional area and the length of outer and inner mitochondrial membrane were measured (at a microscope magnification of 28,000×) in 20 intermyofibrillar and 20 subsarcolemmal mitochondria per muscle per animal, and the inner/outer membrane ratio was calculated as an assessment of cristae extension independent of mitochondrial size.
Nuclear Magnetic Resonance Spectroscopy
Despite its relatively low sensitivity, NMR spectroscopy is capable of identifying hundreds of molecules in a single sample and is rapid, nondestructive, highly reproducible, and amenable to quantification (Nicholson et al., Reference Nicholson, Lindon and Holmes1999) and proved to be suitable for the investigation of different biological matrices (Zancanaro et al., Reference Zancanaro, Nano, Marchioro, Sbarbati, Boicelli and Osculati1994, Reference Zancanaro, Bolner and Righetti2001, Reference Zancanaro, Righetti, Bolner and Nano2002; Righetti et al., Reference Righetti, Peroni, Pietrobelli and Zancanaro2003; Zancanaro et al., Reference Zancanaro, Mariotti, Perdoni, Nicolato and Malatesta2007) inclusive of skeletal muscle (Sobolev et al., Reference Sobolev, Mannina, Costanzo, Cisterna, Malatesta and Zancanaro2017).
Mice were killed by cervical dislocation, and the vastus lateralis and rectus femoris muscles were immediately dissected out, blotted on filter paper, weighed, and frozen in liquid nitrogen. Frozen specimens were then freeze-dried, ground to powder, and extracted in a mixture of methanol and chloroform as previously described (Zancanaro et al., Reference Zancanaro, Nano, Marchioro, Sbarbati, Boicelli and Osculati1994). The resulting aqueous and organic fractions were dried and stored at −80°C until analysis.
The dry residues of the aqueous fraction were dissolved in 0.72 mL of D2O/phosphate buffer (100 mM, pH = 7) containing 1 mM 3-(trimethylsilyl)-propionic-2,2,3,3-d4 acid sodium salt (TSP) as an internal standard. Dry organic fraction samples were dissolved in 0.72 mL of CDCl3/CD3OD 2:1 v/v mixture with tetramethylsilane (TMS), 0.03% v/v. The NMR spectra of aqueous and organic fractions were recorded at 27°C on a Bruker AVANCE 600 NMR spectrometer operating at the proton frequency of 600.13 MHz. 1H spectra were referenced to the methyl group signal of TSP (δ = 0.00 ppm) in D2O, and to the CH3 signal of TMS in CDCl3/CD3OD, respectively. 1H spectra of aqueous extracts were acquired using the same experimental conditions previously reported (Sobolev et al., Reference Sobolev, Mannina, Costanzo, Cisterna, Malatesta and Zancanaro2017). The following parameters were employed to obtain 1H spectra in CDCl3/CD3OD mixture: 128 transients, 32 K data points, spectral width 7.184 kHz, recycle delay of 5 s, and a 30° pulse of 3 μs. TOPSPIN 1.3 Bruker software was used for the acquisition and spectral processing of the NMR data. After Fourier transformation, manual phase and baseline corrections were carried out. Assignment of spectra was conducted as previously described (Mannina et al., Reference Mannina, Sobolev, Capitani, Iaffaldano, Rosato, Ragni, Reale, Sorrentino, D'Amico and Coppola2008; Sobolev et al., Reference Sobolev, Mannina, Costanzo, Cisterna, Malatesta and Zancanaro2017).
A representative spectrum of the aqueous and organic fractions of muscle extract is presented in Figure 1 together with peak assignment for all metabolites that were quantified using NMR data. For the quantitative analysis, the integrals of relevant resonances in 1H NMR spectra were measured (Table 1).

Fig. 1. 1H 600 MHz NMR spectra of aqueous (a) and organic (b) fractions of muscle extract. Assignment of aqueous extract: 1, leucine; 2, valine; 3, isoleucine; 4, lactic acid; 5, alanine; 6, acetic acid; 7, glutamic acid; 8, succinic acid; 9, glutamine; 10, acetyl-carnitine; 11, TMA/DMA; 12, taurine; 13, creatine/ phosphocreatine; 14, inosine-monophosphate; 15, α-glucose; 16, fumaric acid; 17, tyrosine; 18, anserine/carnosine; 19, phenylalanine; 20, carnosine; 21, NAD+; 22, formic acid; 23, nicotinamide. Assignment of organic extract: I1, Chol; I2, PUFA; I3, UFA; I4, FA; I5, DHA; I6, DUFA; I7, PE; I8, PC + SMN; I9, TG; I10, SMN. See Table 1 for explanation of abbreviations.
Table 1. Assigned 1H NMR Resonances of Aqueous and Organic Muscle Extracts Selected for Quantitative Analysis.

The corresponding chemical shift in parts per million (ppm) is reported as well (see also Fig. 1). Index, integrals of organic fraction resonances labeled with number (I1–I10) for use in equations reported in the text.
a Signals of anserine and carnosine are partially overlapped, the integral from anserine was calculated as the difference between the total integral and the integral of carnosine determined using another signal (at 8.22 ppm).
In the case of aqueous samples, the integral values were normalized with respect to the integral of the standard TSP (methyl group signal) set to 100 and divided by sample wet weight and used for quantitative analysis. In the case of CDCl3/CD3OD spectra, a previously described procedure was followed (Sobolev et al., Reference Sobolev, Mannina, Costanzo, Cisterna, Malatesta and Zancanaro2017) with some exceptions. All integrals were normalized with respect to the integral of α-CH2 groups of all fatty acid chains (I4 + I5/2) set to 100%. The content (molar percentage, %mol) of fatty acids of four different types (saturated fatty acids, SFA, monounsaturated fatty acids, MUFA, diunsaturated fatty acids, DUFA, and polyunsaturated fatty acids, PUFA) was calculated according to equations (1)–(4).
 $${\rm SFA} = 100\ndash {\rm I}_3/2\semicolon \;$$
 $${\rm MUFA} = 100\ndash {\rm SFA}\ndash {\rm I}_6\ndash {\rm I}_2\times 2/3\semicolon \;$$
 $${\rm DUFA} = {\rm I}_6\semicolon \;$$
 $${\rm PUFA} = {\rm I}_2\times 3/2\semicolon \;$$
The content of lipids (TG, PE, and SMN) was calculated using equations (5)–(7).
 $${\rm TG} = {\rm I}_9\times 6\semicolon \;$$
 $${\rm PE} = {\rm I}_7\times 2\semicolon \;$$
 $${\rm SMN} = {\rm I}_{10}\times 2.$$
PC content was calculated considering the overlapping of its characteristic signal from N(CH3)3 group with those of SMN, see equation (8).
 $${\rm PC} = 4\cdot \lpar {{\rm I}_8-{\rm I}_{10}\times 9} \rpar /9.$$
Statistical Analysis
Data of morphometric evaluations are presented as means ± standard deviation (SD). One-way ANOVA was used for group–group comparison. For the other variables (percentage of slow fibers, percentage of myofibers with central nuclei, and 1H NMR metabolites), data are presented as the median (interquartile range, IQ). Group–group comparison was performed with the Mann–Whitney test (Table 2). Statistical significance was set at α ≤ 0.05. The IBM-SPSS (v.25) statistical package was used for all analyses.
Table 2. Comparison of the Amounts of Selected Metabolites in Euploid and Trisomic Quadriceps Muscle.

Mann–Whitney test. The median (interquartile range) is presented.
TMA/DMA, trimethylamine/dimethylamine; MUFA, monounsaturated fatty acids; DUFA, diunsaturated fatty acids; PUFA, polyunsaturated fatty acids; PE, phosphatidylethanolamine.
Results
Immunohistochemistry and Morphometry
Immunolabeling for the heavy chain of skeletal fast fiber myosin (Figs. 2a, 2b) revealed a similar percentage of slow fibers in trisomic and euploid animals in both the vastus lateralis muscle (median: 0.59 versus 1.09%, p = 0.355) and the rectus femoris muscle (median: 2.25 versus 0.00%, p = 0.140).
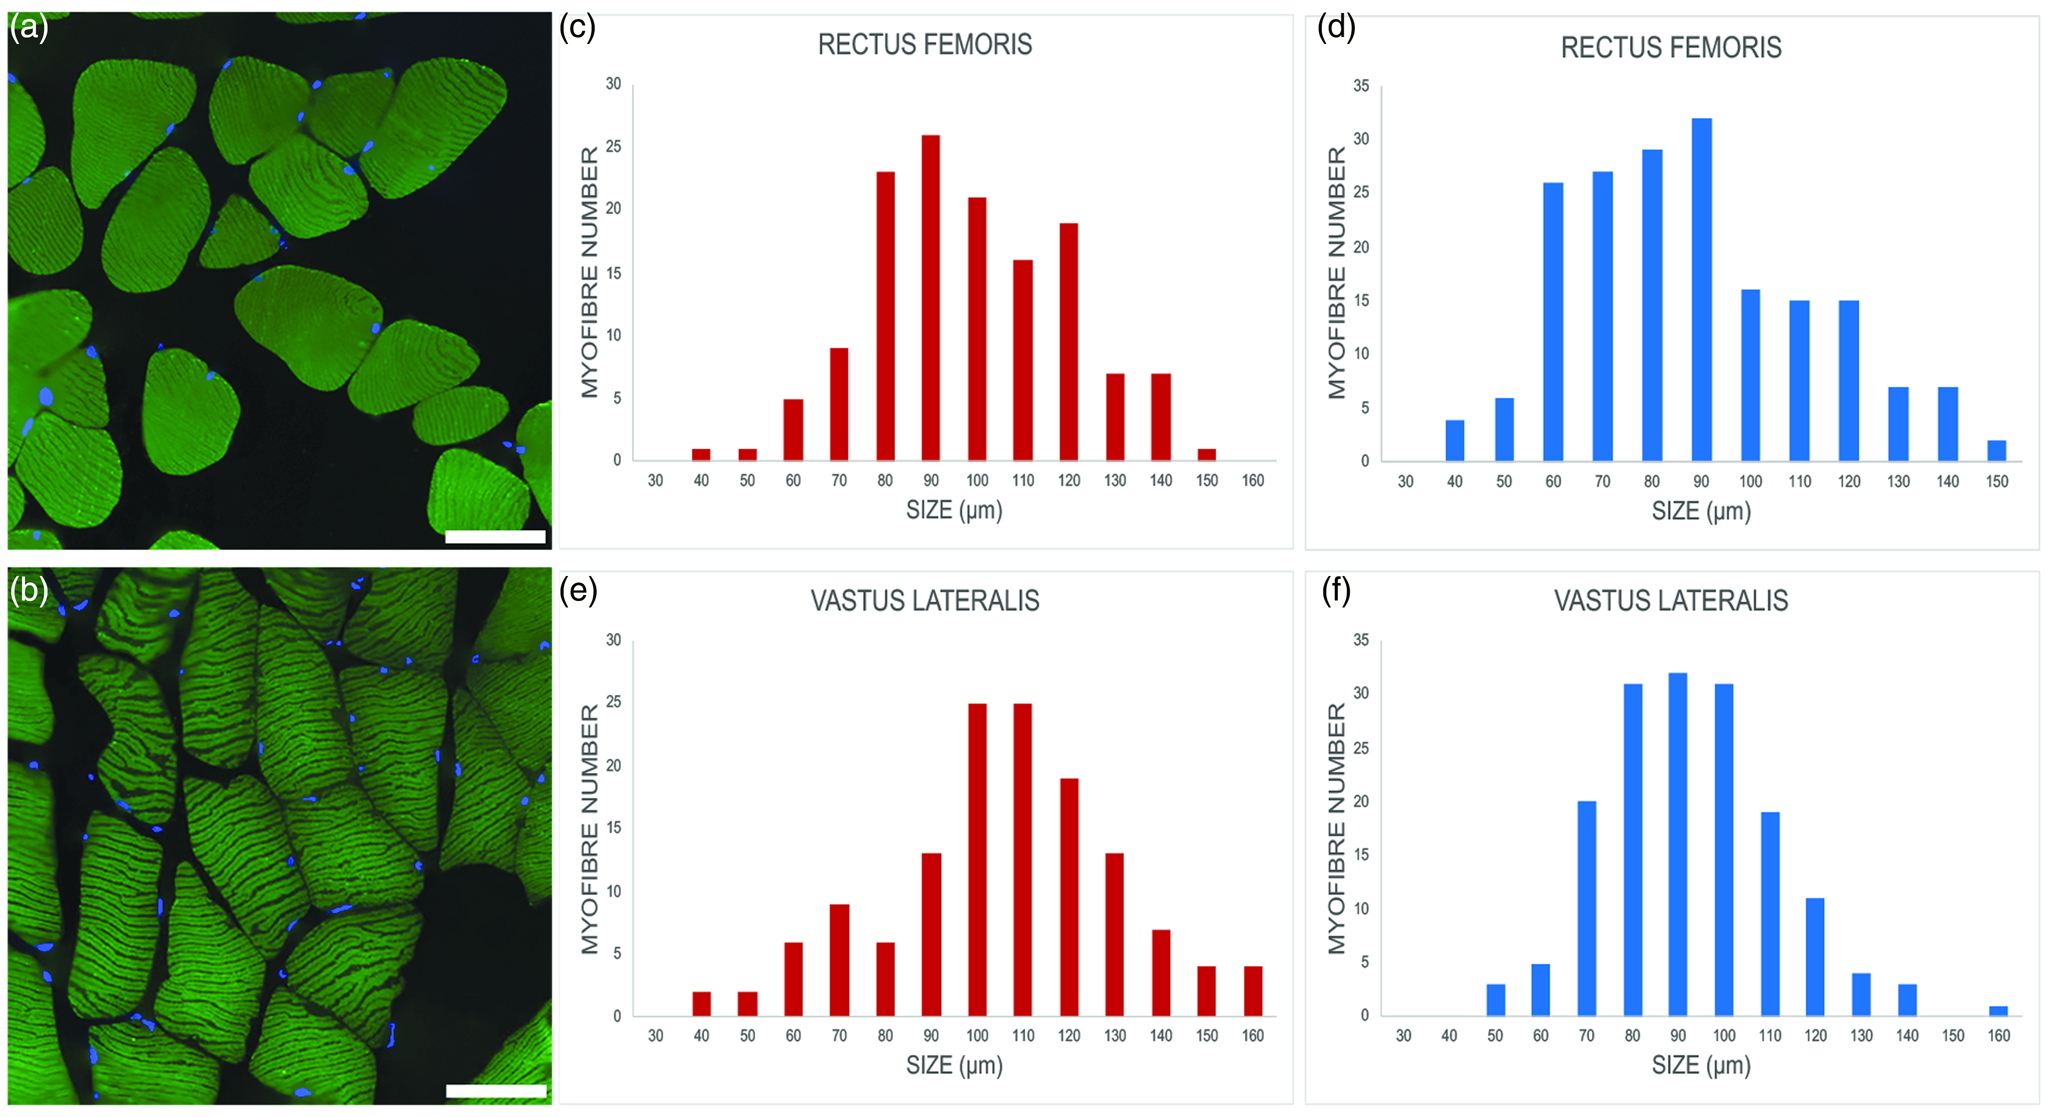
Fig. 2. Representative images of myofibers from euploid, (a) and trisomic, (b) mice; immunolabeling against the heavy chain of skeletal fast fiber myosin (green); DNA counterstaining with Hoechst 33258 (blue). Bars, 100 μm. (c–f) Minimum Feret's diameter distribution of the fast myofibers in the vastus lateralis and rectus femoris of trisomic (c,e) and euploid (d,f) mice. The myofibers are grouped in size classes of 10 μm and the number of fibers in each class is plotted.
The percentage of myofibers with central nuclei increased in the rectus femoris muscle of trisomic versus euploid mice at the limit of statistical significance (median: 9.32 versus 0.62%, p = 0.064). The percentage of myofibers with central nuclei in the vastus lateralis muscle was similar in trisomic and euploid animals (median: 5.26 versus 7.58%, p = 1.00).
Minimum Feret's diameter of fast fibers was significantly higher in trisomic versus euploid mice in the rectus femoris muscle (93.36 ± 21.22 μm versus 86.86 ± 22.95 μm; p = 0.005) and, to an even greater extent, in the vastus lateralis muscle (100.49 ± 25.43 μm versus 89.20 ± 19.56 μm; p < 0.001). Figures 2c–2f show the minimum Feret's diameter distribution in fast fibers. Fast fiber size was significantly larger in the vastus lateralis muscle versus rectus femoris muscle in trisomic (p = 0.013) but not in euploid (p = 0.18) mice. Due to the very limited number of slow fibers, no statistical analysis was carried out.
Ultrastructure and Morphometry
Morphological evaluation at transmission electron microscopy revealed that, in both euploid and trisomic mice, myofibers of rectus femoris and vastus lateralis muscles showed their typical elongated shape: the cytoplasm was almost entirely occupied by longitudinally arrayed myofibrils, while ovoid mitochondria were lined in narrow sarcoplasm areas between myofibrils and many nuclei containing a few heterochromatin clumps occurred in subsarcolemmal position. However, some fine structural differences were found between euploid and trisomic mice in both the vastus lateralis (Fig. 3) and rectus femoris (Fig. 4) muscles. In particular, in trisomic mice, both muscles showed myofibers containing irregularly arrayed myofibrils characterized by heterogeneous size and pattern, although the sarcomeric organization was preserved (Figs. 3b, 4a). In addition, large-sized mitochondria rich in cristae were lined between the myofibrils (Figs. 3b, 3d, 4a, 4b), as well as in the subsarcolemmal region. In the vastus lateralis muscle of trisomic mice, the sarcoplasmic reticulum was characterized by dilated cisternae, as well as by deposits of glycogen especially around the intermyofibrillar mitochondria and sarcoplasmic reticulum (Fig. 3d), while lipid droplets were scarce. Conversely, numerous lipid droplets typically associated with mitochondria were found in the rectus femoris muscle of trisomic mice (Fig. 4b), whereas no sarcoplasmic reticulum enlargement or glycogen accumulation was observed.

Fig. 3. Transmission electron micrographs of vastus lateralis myofibers from euploid (a,c) and trisomic (b,d) mice. (a,c) The cytoplasm is occupied by regularly arrayed myofibrils with well-preserved triad areas (arrows). (b,d) Irregularly arrayed myofibrils characterise the myofiber. Note the dilated sarcoplasmic reticulum (arrows) and the glycogen deposits (arrowheads). Bars: 500 nm (a,b); 200 nm (c,d).

Fig. 4. Transmission electron micrographs of rectus femoris myofibers of trisomic mice. Myofibrils heterogeneous in size occur in the myofiber (a). Numerous lipid droplets (asterisks) are associated with large-sized mitochondria (b). Bars: 500 nm (a); 200 nm (b).
Morphometric analysis demonstrated that the length of Z line was significantly lower in trisomic versus euploid animals in both vastus lateralis (327.78 ± 189.88 nm versus 451.59 ± 147.79 nm; p < 0.001) and rectus femoris (262.77 ± 150.21 nm versus 411.69 ± 147.65 nm; p < 0.001) muscles. The high SD for the trisomic Z line confirmed the high heterogeneity in myofibril size observed at TEM in these animals (see Fig. 3b). Figure 5 shows the Z line length distribution. The percentage of myofiber area occupied by the mitochondria was significantly higher in trisomic versus euploid mice in the vastus lateralis muscle (4.12 ± 0.64 versus 2.32 ± 0.80%; p < 0.005) and, to an even greater extent, in the rectus femoris muscle (16.04 ± 3.47 versus 3.87 ± 0.88%; p < 0.001). In the rectus femoris muscle, the percentage of myofiber area occupied by lipid droplets was significantly higher in trisomic versus euploid mice (0.49 ± 0.27 versus 0.01 ± 0.02%; p < 0.001). The sectional area and the inner/outer membrane ratio of intermyofibrillar and subsarcolemmal mitochondria were significantly higher in trisomic versus euploid mice in both rectus femoris and vastus lateralis muscles (Tables 3 and 4).

Fig. 5. Distribution of Z line length in the rectus femoris and vastus lateralis muscle of trisomic (a,c) and euploid (b,d) mice. The myofibrils are grouped in size classes of 100 nm and the number of myofibrils in each class is plotted.
Table 3. Mean ± SD Values of the Sectional Area and Inner/Outer Membrane Ratio of Intermyofibrillar Mitochondria in the Rectus Femoris and Vastus Lateralis Muscle from Euploid and Trisomic Mice.

One-way ANOVA.
Table 4. Mean ± SD Values of the Sectional Area and Inner/Outer Membrane Ratio of Subsarcolemmal Mitochondria in the Rectus Femoris and Vastus Lateralis Muscle from Euploid and Trisomic Mice.

One-way ANOVA.
Nuclear Magnetic Resonance Spectroscopy
Several intermediate metabolism compounds (succinic acid, lactic acid, acetic acid, pyruvic acid), amino acids (e.g. leucine, isoleucine, valine, alanine, tyrosine), nucleosides (NAD+), as well as key molecules for muscle energetics (α-glucose, creatine/phosphocreatine), were identified unambiguously in the aqueous fraction and quantified (Table 1). In the organic fraction, MUFA, DUFA, PUFA, as well as cholesterol, triglycerides, and phospholipids, were identified and quantified (Table 1). Comparison of quadriceps spectra showed a tendency for some metabolites to be present in different amounts in the muscles of trisomic versus euploid mice (Table 2). In trisomic versus euploid mice, the aqueous metabolites glutamate, succinic acid, TMA/DMA, and creatine/phosphocreatine were present in higher amounts per unit wet tissue. In the organic fraction, DUFA and PUFA were present in higher amounts per unit wet tissue in the trisomic versus euploid muscle, together with phosphatidylethanolamine; instead, larger amounts of MUFAs were found in the euploid muscle. All differences were at the limit of statistical significance (p = 0.064).
Discussion
The Ts65Dn mouse model shares numerous phenotypes with the DS human condition among which is the DS-associated locomotory deficiency. However, it has been used to a limited extent for investigating muscle pathology in DS. In this work, we expanded on previous knowledge by exploring the structure and composition of the quadriceps muscle using a combined morphological, morphometric, and metabolomic approach. Several trisomy-associated changes were found.
A similar proportion of fast and slow fibers was found in the muscle of euploid and trisomic Ts65Dn mice (consistent with previous findings in the soleus muscle; Cowley et al., Reference Cowley, Keslacy, Middleton, DeRuisseau, Fernhall, Kanaley and DeRuisseau2012); instead, myofiber size was significantly greater in trisomic versus euploid mice (rectus femoris, +7.2%; vastus lateralis, +12.6%). This finding should be considered as preliminary due to the limited number of analyzed animals; however, it suggests the presence of trisomy-associated hypertrophy in myofibers. Accordingly, earlier work found reduced “density” of nuclei in isolated skeletal muscle fibers of persons with DS versus euploid controls (Landing & Shankle, Reference Landing and Shankle1982), thereby suggesting that increased myofiber size is also present in the human trisomy. Further, in the myocardium of persons with DS, cells were found to be enlarged in comparison to controls (Recalde et al., Reference Recalde, Landing and Lipsey1986). Interestingly enough, several studies showed that some proteins codified by genes located in the so-called Down Syndrome Critical Region (DSCR) are involved in the calcineurin-NFAT signaling (Rothermel et al., Reference Rothermel, Vega and Williams2003; Arron et al., Reference Arron, Winslow, Polleri, Chang, Wu, Gao, Neilson, Chen, Heit, Kim, Yamasaki, Miyakawa, Francke, Graef and Crabtree2006; Gwack et al., Reference Gwack, Sharma, Nardone, Tanasa, Iuga, Srikanth, Okamura, Bolton, Feske, Hogan and Rao2006), which regulates a hypertrophic pathway in myofibers (Dunn et al., Reference Dunn, Burns and Michel1999; Semsarian et al., Reference Semsarian, Wu, Ju, Marciniec, Yeoh, Allen, Harvey and Graham1999; Ferreira et al., Reference Ferreira, Cheng, Agudelo, Cervenka, Chaillou, Correia, Porsmyr-Palmertz, Izadi, Hansson, Martínez-Redondo, Valente-Silva, Pettersson-Klein, Estall, Robinson, Nair, Lanner and Ruas2019) and cardiomyocytes (Molkentin et al., Reference Molkentin, Lu, Antos, Markham, Richardson, Robbins, Grant and Olson1998). Such a pathway undergoes destabilization in DS (Arron et al., Reference Arron, Winslow, Polleri, Chang, Wu, Gao, Neilson, Chen, Heit, Kim, Yamasaki, Miyakawa, Francke, Graef and Crabtree2006). In the Ts65Dn mouse, the expression pattern of DSCR genes is similar to that in humans (Strippoli et al., Reference Strippoli, Petrini, Lenzi, Carinci and Zannotti2000) and DSCR protein expression is upregulated in comparison with euploid animals (Baek et al., Reference Baek, Zaslavsky, Lynch, Britt, Okada, Siarey, Lensch, Park, Yoon, Minami, Korenberg, Folkman, Daley, Aird, Galdzicki and Ryeom2009), thus constituting a possible mechanism to explain our findings.
Skeletal muscle hypertrophy is usually characterized by an increase in myofiber protein synthesis (Bodine et al., Reference Bodine, Stitt, Gonzalez, Kline, Stover, Bauerlein, Zlotchenko, Scrimgeour, Lawrence, Glass and Yancopoulos2001); accordingly, 1H NMR showed a tendency in the trisomic mice to an overall increase in metabolites, such as glutamate and succinic acid, which are involved in skeletal muscle protein synthesis (Martins-Bach et al., Reference Martins-Bach, Bloise, Vainzof and Rahnamaye Rabbani2012; Yuan et al., Reference Yuan, Xu, Xu, Liang, Cai, Zhu, Wang, Wang, Zhu, Gao, Wang, Zhang, Jiang and Shu2017). 1H NMR also showed a tendency for phosphatidylethanolamine and polyunsaturated fatty acids to increase, and for MUFAs to decrease in muscles of trisomic mice, consistently with the activation of the mTor-pathway-independent mechanism of hypertrophy (Conte et al., Reference Conte, Armani, Conte, Serra, Franceschi, Mele, Sandri and Salvioli2019). In this view, the increase in the percentage of myofibers with central nuclei found in the rectus femoris of trisomic versus euploid mice, although at the limit of the statistical significance, deserves consideration. Central myonuclei are a marker of muscle regeneration/remodelling (Fukada, Reference Fukada2018) and satellite cells are the source of new myonuclei (van der Meer et al., Reference van der Meer, Jaspers, Jones and Degens2011; Fukada, Reference Fukada2018). Therefore, it could be inferred that in the rectus femoris muscle, a higher regeneration/remodelling activity takes place in trisomic versus euploid mice. The lack of a corresponding finding in the vastus lateralis muscle has no obvious explanation. Since active satellite cells preferentially occur close to capillaries (Hendrickse & Degens, Reference Hendrickse and Degens2019) and the rectus femoris is characterized by more vascularized myofibers than the vastus lateralis (Johnson et al., Reference Johnson, Polgar, Weightman and Appleton1973; Koga et al., Reference Koga, Kano, Barstow, Ferreira, Ohmae, Sudo and Poole2012, Reference Koga, Okushima, Barstow, Rossiter, Kondo and Poole2017), a higher incorporation of satellite cells in the rectus femoris muscle may be assumed, thus contributing to muscle hypertrophy. We may therefore hypothesize that the hypertrophy of quadriceps myofibers in trisomic mice is sustained by an increase in both protein synthesis (satellite cell-independent hypertrophy, Blaauw et al., Reference Blaauw, Canato, Agatea, Toniolo, Mammucari, Masiero, Abraham, Sandri, Schiaffino and Reggiani2009) and satellite cell contribution (Fukada, Reference Fukada2018).
It is worth noting that, despite the increase in myofiber size in the rectus femoris and vastus lateralis muscle of trisomic mice, a reduction in Z line length (i.e., sarcomere diameter) occurred in both trisomic muscles in parallel to an increase in mitochondria or lipid droplets (in the rectus femoris), or sarcoplasmic reticulum and glycogen (in the vastus lateralis). Taken together, these findings suggest that the hypertrophic drive observed in the quadriceps muscle of trisomic mice leads to the so-called “sarcoplasmic hypertrophy” i.e., a myofiber growth mostly related to an increase in the volume of mitochondria and sarcoplasmic reticulum and/or sarcoplasmic enzyme or substrate content (Haun et al., Reference Haun, Vann, Roberts, Vigotsky, Schoenfeld and Roberts2019). The parallel, intriguing reduction in myofibril diameter found in trisomic mice could be related to an early age-related muscle wasting process since a similar reduction in myofibril size was reported in hindlimb muscles of old rats (Ansved & Edström, Reference Ansved and Edström1991). However, in vivo magnetic resonance imaging showed similar hindlimb muscles volume in trisomic and euploid Ts65Dn mice (unpublished results) suggesting that trisomy does not affect overall muscle size. These findings highlight the need for further work at the muscle organ level, taking into consideration all the histological components, in the Ts65Dn mouse model of DS.
The ultrastructural analysis and the morphometric evaluation presented herein demonstrated in the myofibers of trisomic mice the presence of large-sized mitochondria in both the vastus lateralis and the rectus femoris muscles. It is known that the balance between mitochondrial fission and fusion processes is impaired in DS (Gomez et al., Reference Gomez, Morales, Maracaja-Coutinho, Parra and Nassif2020; Parra et al., Reference Parra, Altamirano, Hernández-Fuentes, Tong, Kyrychenko, Rotter, Pedrozo, Hill, Eisner, Lavandero, Schneider, Rothermel and Rothermel2018). In fact, the increase in the levels of the DSCR1 protein (also called RCAN1), affecting the calcineurin-DRP1 pathway (Gomez et al., Reference Gomez, Morales, Maracaja-Coutinho, Parra and Nassif2020), leads to the inhibition of mitochondrial fission (Parra et al., Reference Parra, Altamirano, Hernández-Fuentes, Tong, Kyrychenko, Rotter, Pedrozo, Hill, Eisner, Lavandero, Schneider, Rothermel and Rothermel2018). This would be consistent with the finding of large-sized mitochondria in our trisomic mice. The presence of mitochondria with larger size and longer cristae in myofibers of the trisomic mice may not imply a higher organelle efficiency. Actually, alterations in glucose and fat metabolism and in ATP biosynthesis suggestive of mitochondrial functional limitations have been reported in skeletal muscle of Ts65Dn mice (Cowley et al., Reference Cowley, Keslacy, Middleton, DeRuisseau, Fernhall, Kanaley and DeRuisseau2012). Consistently, a lower basal VO2 (Cefalu et al., Reference Cefalu, Croom, Eisen, Jones, Daniel and Taylor1998) was found in these mice, and mitochondrial dysfunctions have been reported in brain tissue from DS patients (Busciglio et al., Reference Busciglio, Pelsman, Wong, Pigino, Yuan, Mori and Yankner2002).
DS is usually related to a multi-systemic early aging (Roth et al., Reference Roth, Sun, Greensite, Lott and Dietrich1996; Nakamura & Tanaka, Reference Nakamura and Tanaka1998) and various alterations in mitochondrial structure and function have been found in several DS cell types (Druzhyna et al., Reference Druzhyna, Nair, LeDoux and Wilson1998; Busciglio et al., Reference Busciglio, Pelsman, Wong, Pigino, Yuan, Mori and Yankner2002; Helguera et al., Reference Helguera, Seiglie, Rodriguez, Hanna, Helguera and Busciglio2013; Cisterna et al., Reference Cisterna, Costanzo, Scherini, Zancanaro and Malatesta2014). Enlarged mitochondria have been described in the aging skeletal muscle, probably as a result of impaired fission/fusion events, together with a decreased mitochondrial function (Nourshahi et al., Reference Nourshahi, Damirchi, Babaei, Gholamali, Salehpour and Cseri2012; Tassinari et al., Reference Tassinari, De Gennaro, La Sala, Marazziti, Bolasco, Aguanno, De Angelis, Naro and Pellegrini2019). Consistently, the increase in Cr/PCr and succinic acid highlighted by 1H NMR in the present study in trisomic mice suggests perturbations in the mitochondria fuel utilization (Martins-Bach et al., Reference Martins-Bach, Bloise, Vainzof and Rahnamaye Rabbani2012; Consitt et al., Reference Consitt, Koves, Muoio, Nakazawa, Newton and Houmard2016). Accumulation of intramyocellular lipid droplets, as well as altered glycogen content, are also common features of aged skeletal muscles, likely due to the multifactorial deterioration of biological functions typical of the aging process, among which are decreased autophagic capacity, increased oxidative stress and inflammation (Shou et al., Reference Shou, Chen and Xiao2020). 1H NMR showed a tendency for glutamate to increase and for leucine to decrease in the skeletal muscle of trisomic mice. Amino acids are known to play a regulatory role in aging (Canfield & Bradshaw, Reference Canfield and Bradshaw2019) and high levels of glutamate have been described in aged skeletal muscles (Stuerenburg et al., Reference Stuerenburg, Stangneth and Schoser2006), as well as in some muscular diseases (Martins-Bach et al., Reference Martins-Bach, Bloise, Vainzof and Rahnamaye Rabbani2012). Leucine is strictly related to glutamate metabolism and is involved in skeletal muscle regeneration in aging (Pereira et al., Reference Pereira, Silva, da Cunha, Moriscot, Aoki and Miyabara2015) and inflammation (Nicastro et al., Reference Nicastro, da Luz, Chaves, Bechara, Voltarelli, Rogero and Lancha2012).
Conclusions
The original combination of structural and functional techniques applied in this study to characterize the quadriceps muscle of Ts65Dn mice provided a panel of data ranging from histological features to the fine organization of single muscle fiber to the muscle metabolites profile. These data highlighted hitherto unknown characteristics of the skeletal muscle in this murine model of DS. Although based on a limited number of animals, findings consistently suggest that, in the trisomic Ts65Dn mouse, the quadriceps myofibers undergo a particular form of myofiber hypertrophy associated with myofibrillar atrophy and mitochondrial alterations, which may be due to premature aging.
The present findings, while preliminary and not conclusive, constitute a solid experimental background for further investigations aimed at characterizing the biochemical and morphological underpinnings of skeletal muscle alteration in DS.
Acknowledgments
This work was supported by Departmental funding to MM and CZ.


 Open access