


Introduction
Due to their superior specific stiffness and strength, carbon fibers in reinforced composites advance the development in many technical sectors, such as aerospace and automotive industries. Furthermore, carbon fibers play a vital role in research frontiers of multifunctional materials such as structural power composites (Asp et al., Reference Asp, Johansson, Lindbergh, Xu and Zenkert2019, Reference Asp, Bouton, Carlstedt and Zenkert2021) and shape-morphing composites (Johannisson et al., Reference Johannisson, Harnden, Zenkert and Lindbergh2020). In these multifunctional devices, carbon fibers act as the traditional load bearing component, and are simultaneously electrochemically active by hosting and releasing lithium ions as a negative electrode. Still, it is not fully understood how the microstructure of carbon fibers governs their mechanical and electrochemical properties.
Most commercial carbon fibers are fabricated from polyacrylonitrile (PAN) precursors. Carbon fibers consist of >90% carbon (C) that form domains of turbostratic graphite and amorphous carbon. Additionally, heteroatoms like nitrogen (N) and oxygen (O) were found in many carbon fiber types (Minus & Kumar, Reference Minus and Kumar2005; Huang, Reference Huang2009). For carbon materials, heteroatoms like N have proved to be beneficial for electrochemical properties (Reddy et al., Reference Reddy, Srivastava, Gowda, Gullapalli, Dubey and Ajayan2010; Han et al., Reference Han, Yue, Zhang and Cui2012; He et al., Reference He, Li, Li and Dai2019). It is, therefore, important to obtain deep insights into the heteroatoms of carbon fibers and correlate the microstructure to electrochemical properties.
Previously, transmission electron microscopy (TEM) along with electron energy loss spectroscopy (EELS) was used to study the distribution of N and O in carbon fibers (Serin et al., Reference Serin, Fourmeaux, Kihn, Sevely and Guigon1990). EELS is proven for its high spatial resolution. However, the information obtained by TEM is two dimensional, collapsing in the specimen thickness direction, which is ~100 nm. The thickness is more than one order of magnitude larger than the microstructure domains, that is crystalline and amorphous areas, of some carbon fibers. Atom probe tomography (APT), with its high spatial resolution in three dimensions and high chemical sensitivity (Kelly & Miller, Reference Kelly and Miller2007), provides a unique opportunity to understand the distribution of heteroatoms of carbon fibers on the nanometer or atomic scale. APT has proved extremely powerful for analyzing a wide spectrum of materials, including metals, oxides (Liu et al., Reference Liu, Halvarsson, Hellström, Svensson and Johansson2015), and even biological materials (Gordon & Joester, Reference Gordon and Joester2011; Sundell et al., Reference Sundell, Hulander, Pihl and Andersson2019), however there are only very few trials on carbon fibers (Nishikawa & Taniguchi, Reference Nishikawa and Taniguchi2014; Marceau et al., Reference Marceau, Taylor, Sato and Henderson2019). Little is known on how to perform reliable APT experiments on carbon fibers and analyze the obtained data.
Recently, we conducted APT on three types of carbon fibers, including one high modulus (HM) type and two intermediate modulus (IM) types, and found the correlation between electrochemical property and the content and chemical configurations of heteroatoms (Johansen et al., Reference Johansen, Schlueter, Lam, Asp and Liu2021). In this paper, we present the systematic procedure that we used to identify and deconvolute a multitude of peaks in the complex mass spectra of carbon fibers; we also identify the material and operational parameters that influence mass resolution; and finally, we analyze issues pertaining to multiple hit events. The knowledge gained from this study can guide future APT studies on carbon fibers in structural and multifunctional composite materials.
Materials and Methods
Material
The carbon fibers investigated were three types of PAN-based commercial fibers: M60J (Toray), T800 (Toray), and IMS65 (Teijin). The fiber types were chosen since their microstructure is already known from a previous TEM study (Fredi et al., Reference Fredi, Jeschke, Boulaoued and Asp2018). M60J is classed as HM fiber. T800 and IMS65 are classed as IM fibers.
Sample Preparation
APT specimens were extracted from carbon fibers with the lift-out technique (Thompson et al., Reference Thompson, Lawrence, Larson, Olson, Kelly and Gorman2007). The instrument used was an FEI Versa 3D workstation—a combined focused ion beam and scanning electron microscope (FIB/SEM), with a micro-manipulator, Omniprobe, and a gas injection system for platinum (Pt) deposition. Before extraction, single carbon fibers were isolated and adhered to with silver glue on a silicon (Si) wafer. Depending on the targeted extraction geometry, the wafer was then positioned so that either the lateral surface or the cross-section of the carbon fiber was facing the ion beam. From the lateral surface, a wedge of material with surface dimensions of 15 × 1.5 μm2 was extracted for each lift-out; limited by the fiber diameter of 5 μm, only 5 × 1.5 μm2 was extracted from the cross-section for each lift-out. These wedges were cut into 2–5 pieces and each piece was adhered with Pt to an Si microtip post (pre-manufactured by CAMECA). The material adhered to the post was milled with an annular pattern to produce nano-tips with a tip radius of <50 nm. A series of ion currents were used, from 500 to 100 pA at 30 kV accelerating voltage. Finally, the accelerating voltage was changed to 2 kV, in order to mitigate ion beam damage to the material.
Atom Probe Tomography
For APT experiments, an IMAGO LEAP 3000X HR was used. Due to the high evaporation field of carbon, pulsed laser mode was utilized. The laser wavelength was 532 nm. The acquisition rate was set to 2 ions per 1,000 pulses (0.2%). Other operational parameters were set to laser energy 1 nJ (corresponding to ~25 pJ/μm2 on the material surface), pulse frequency 100 or 200 kHz, and specimen temperature 100 K, respectively. The acquired data was analyzed with IVAS 3.4.3 software.
Results and Discussion
Operational Parameters
Premature specimen fracture is one of the biggest challenges for APT of carbon fibers. Out of 40 runs, only 13 runs yielded over 100,000 ions. The high specimen failure rate during APT analyses is mainly attributed to the high evaporation field of carbon (155 V/nm) (Southworth & Ralph, Reference Southworth and Ralph1969; Mukherjee et al., Reference Mukherjee, Watanabe, Isheim, Seidman and Moutanabbir2016), a rich abundance of defects (pores) and the anisotropic microstructure. There are nanosized domains of amorphous carbon and turbostratic graphite. Nanosized pores are ubiquitous particularly between these domains. In the turbostratic graphite, the stacking of each graphene layer does not exhibit any ordering (unlike the close-packed hexagonal structure of graphite); the turbostratic graphite crystallites tend to align with the graphene layers more or less parallel to the fiber axial direction (Huang, Reference Huang2009). While between the graphene layers there is the weak van der Waals force, within the graphene layer, there are sp2 carbon atoms with one of nature's highest bonding energy ~5.9 eV, which is slightly higher than sp3 bonds in diamond (Pop et al., Reference Pop, Varshney and Roy2012). The strongly anisotropic microstructure leads to anisotropic properties. The axial Young's modulus for M60J is 588 GPa, for T800, it is 294 GPa, and for IMS65, it is 290 GPa, whereas the transverse modulus for M60J is 17 GPa, for T800, it is 14 GPa, and for IMS65, it is 22 GPa (Duan et al., Reference Duan, Liu, Pettersson, Creighton and Asp2020). The HM fiber, M60J, has much larger crystallite size (>300 Å) compared with the IM fibers T800 and IMS65 (~20 Å) (Fredi et al., Reference Fredi, Jeschke, Boulaoued and Asp2018). The different crystallite sizes affect thermal conductivity (150 versus 35 W/(m K) for M60J and T800, respectively) and electrical resistivity (0.7 × 10⁻⁵ versus 1.4 × 10⁻⁵ Ω m) for M60J and T800, respectively) (Toray, 2020).
The premature specimen fracture is most likely caused by the high mechanical stresses induced by the standing voltage (Birdseye & Smith, Reference Birdseye and Smith1970) on the anisotropic microstructure. To avoid the high stresses, operational parameters were chosen so that the field evaporation can be achieved while keeping the standing voltage as low as possible. Thus, high specimen temperature (100 K, compared with 30–60 K for most materials) and high laser pulse energy (1 nJ, compared with 0.1–0.5 nJ used for most other materials) were chosen. The major concern of high specimen temperature is that field evaporation may also occur between pulses, which causes a high background level and inaccurate quantification. In our case, at laser energy of 1 nJ (green laser) and specimen temperature 100 K, the background level is low, and the data acquisition is maximized. Ultraviolet (UV) laser energy of 1 nJ was previously proved to give stable evaporation for diamond (Mukherjee et al., Reference Mukherjee, Watanabe, Isheim, Seidman and Moutanabbir2016). It is worth noting that the thermal conductivity of diamond (~1,000 W/(m K)) is superior to that of carbon fibers (Olson et al., Reference Olson, Pohl, Vandersande, Zoltan, Anthony and Banholzer1993); and the effect of UV laser is generally considered to be one order of magnitude stronger than that of green laser. In our study, all the tips started to run between 2.5 and 5 kV. However, we found that the stability of the evaporation (discussed in the “Field evaporation behavior” section) needs further improvement.
Quantification
The strategy that we used to quantify the results obtained from the different types of carbon fibers, was to start with the chemically simple HM fiber, and then focus on identifying the differences between the HM and IM fibers. Since HM fibers undergo a higher final heat treatment during manufacture and nearly all heteroatoms—N, O, and H—are expelled, it yields >99 wt% C, the spectra are less complex than those for the IM fibers that still contain a substantial amount of N.
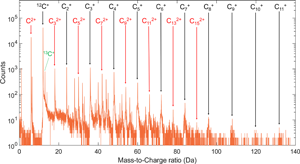
Still, quantification of the mass spectra of the HM carbon fibers requires assigning the nearly one hundred peaks (Fig. 1) in a systematic manner. Due to the predominant C content in HM carbon fibers, it is suitable to begin with identifying the peaks that consist solely of carbon ions with the most abundant isotope,  $^{12}{ {\rm C}_x}^{n + }$, starting with ions of charge state n = 1, then moving on to n = 2 and so forth. It is apparent that many peaks may overlap. For example, $^{12} {{\rm C}_3}^ + , \;^{12}{{\rm C}_6}^{2 + } , \;^{12}{{\rm C}_9}^{3 + } , \;^{12}{{\rm C}_{12}}^{4 + } , \;{\rm and}\;^{12}{{\rm C}_{15}}^{5 + }$ all have the mass-to-charge ratio of 36 Da. These peaks should be accompanied by a corresponding satellite peak containing $^{12} {\rm C}_{( x-1) }{^{13} {\rm C}}^{n + }$ with one 13C atom. Note that the satellite peaks do not overlap. Thus, given a good signal-to-noise ratio (low background level) and high enough mass resolution (narrow main peak and small thermal tail), the satellite peaks provide clear evidence for the presence of their corresponding main peaks. In the above-listed ion species, $^{12} {{\rm C}_{15}}^{5 + }$ (marked orange in Table 1) may not exist due to the absence of the corresponding satellite peak, while the rest of the species (marked green in Table 1) can be identified based on their corresponding satellite peaks. Also, there are potential overlaps at 28 and 44 Da. Apart from being associated with ${{\rm C}_7}^{3 + }$ and ${{\rm C}_{11}}^{3 + }$, these peaks can also be associated with CO+ and ${{\rm C}{\rm O}_2}^ +$. Table 1 lists all potential peak positions for ${^{12} {\rm C}_x}^{n + }$ (the main peak, referred to as “M” in the table) and $^{12} {{\rm C}_{( x-1) }}^{13} {\rm C}^{n + }$ (the satellite peak, referred to as “S” in the table) (x = 1–22, and n = 1–5). Potentially, there can be other satellite peaks than $^{12} {{\rm C}_{( x-1) }}^{13} {\rm C}^{n + }$ in the form of $^{12} {{\rm C}_{( x-y) }}^{13} {{\rm C}_y}^{n + }$, where y > 1. The natural abundance of the two stable isotopes of carbon is: 98.93% for 12C and 1.07% for 13C. The probability, P, that a molecular ion with x numbers of carbon atoms in total consists of y numbers of $^{13} {\rm C\ }( {^{12} {{\rm C}_{( x-y) }}^{13} {\rm C}_y} )$, is calculated by
 $$P{\kern 1pt} = {\kern 1pt} 0.9893^{( x-y) } \times 0.0107^y \times \displaystyle{{x!} \over {( x-y) !{\kern 1pt} \times {\kern 1pt} y!}}.$$
Fig. 1. A mass spectrum of M60J. Peaks associated with pure carbon ions of charge state 1+ and 2+ are marked.
Table 1. Mass-to-Charge Ratio for Pure C Ions at Different Charge States with Corresponding Main (M) and Satellite (S) Peaks,  $^{12} {{\rm C}_x}^{n + }$ and $^{12}{ {\rm C}_{( x-1) }}^{13} {\rm C}^{n + }$, Respectively.

The mass-to-charge ratios marked in green were confirmed in the mass spectra of M60J, either by uniqueness of the ratio or the corresponding satellite peak; and the ratios marked in orange lack confirmation by the satellite peak, which may be overshadowed by the tail of the major peak, or too small to be distinguished with certainty. The last column lists the theoretical ratio between the satellite and main peak (S/M) based on natural abundance of carbon isotopes.
For a carbon molecular ion not larger than 22 atoms, the probability of containing two or more 13C is very small compared with the probability of containing none  $^{13} {\rm C}( {^{12} {{\rm C}_x}^{n + } } )$ or one $^{13} {\rm C}( {^{12}{ {\rm C}_{( x-1) }}^{13} {\rm C}^{n + }} )$ (Fig. 2). Indeed, for three C atoms, the probability for $^{12} {{\rm C}_3}^ +$ at 36 Da, $^{12} {{\rm C}_2}^{13} {\rm C}^ +$ at 37 Da, and $^{12} {\rm C}^{13}{{\rm C}_2}^ +$ at 38 Da is: 96.82, 3.14, and 0.03%, respectively. The ratio between $^{12} {{\rm C}_2}^{13} {\rm C}^ +$ and $^{12} {\rm C}^{13}{{\rm C}_2}^ +$ is more than 90 times. Of course, the ratio increases with the number of total C atoms. However, even for C22, the ratio is as high as nine times. Thus, given the peaks of $^{12}{ {\rm C}_{( x-1) }}^{13} {\rm C}^{n + }$ are already small, any satellite peaks other than $^{12} {{\rm C}_{( x-1) }}^{13} {\rm C}^{n + }$ can in practice be ignored.

Fig. 2. The probability of a molecular ion consisting of (a) only 12C atoms, (b) one 13C atom and the rest 12C atoms, and (c) other combination of 12C and 13C atoms. Note that the largest molecular ion encountered was  ${{\rm C}_{22}}^{5 + }$, and for such small molecular ions, the probability of other combinations is relatively low.
From Table 1, it is apparent that several peaks may overlap. For peaks without overlap, the theoretical satellite-to-main peak ratio between  $^{12}{ {\rm C}_{( x-1) }}^{13} {\rm C}^{n + }$ and $^{12}{ {\rm C}_x}^{n + }$ (right column-“S/M” in Table 1) can be calculated based on the natural abundance of the isotopes 12C and 13C. Thus, the satellite-to-main peak ratio can be used to confirm and deconvolute overlapping peaks. In this regard, the peaks, in particular the small satellite peaks, must be unambiguously ranged and the background be carefully subtracted. However, the broad thermal tails from the main peaks sometimes overshadow the satellite peaks, particularly at 6 and 12 Da; additionally, the low ion counts in the satellite peaks can confuse the peaks with the background. Therefore, high mass resolution and large analysis volume are particularly desirable. How to improve mass resolution and number of acquired ions are discussed in detail later in the “Mass resolution” section. Another obstacle to directly using the theoretical ratio to deconvolute the main peak is the dead time of the detector. There are more ions in the main peaks than the satellite peaks. Therefore, ions of the main peaks hit the detector more frequently than ions of the satellite peaks. The detection efficiency is impaired when more than one ion hits the detector close in time and space. Consequently, the main peaks are underestimated, while the satellite peaks are closer to the true ion count. Thus, the theoretical satellite-to-main peak ratio together with the counts of the satellite peaks can be used to calculate the counts in the main peak, which is closer to the “true” value (Thuvander et al., Reference Thuvander, Weidow, Angseryd and Andrén2011).
The spectra of the IM fibers have additional peaks at 7, 14, 19, 26, 27, 28.67, 31, 32.67, 36.67, 38, 40.67, 43, 44.67, 50, 55, 62, 67, 74, and 86 Da. These are assigned as CxNn+ and CxNOn+. Table 2 shows the potential mass-to-charge ratios for CxNn+ and CxNOn+. The 1 Da peak corresponds to contaminant hydrogen in the atom probe vacuum chamber (Miller & Forbes, Reference Miller and Forbes2014) and does not stem from the carbon fiber specimens. During manufacturing of carbon fibers, expulsion of hydrogen (dehydrogenation) takes place at 400–600°C, and the final heat treatment temperatures are far beyond the dehydrogenation temperature (at 1,600°C for IM fibers and 3,000°C for HM fibers). Thus, hydrogen is assumed to be completely expelled in carbon fibers. The peak at 14 Da is, therefore, most likely associated with CO2+ and N+;  ${{\rm C}{\rm H}_2}^ +$ is not considered as a potential candidate, since the 14 Da peak was not distinctly shown for polymers containing CH2– units (Joester et al., Reference Joester, Hillier, Zhang and Prosa2012). Comparing the mass spectra of HM and IM fibers, it shows that the 14 Da peak is many times smaller in the HM spectra (Fig. 3), which is N depleted. Consequently, it can be assumed that the 14 Da peak of the IM fibers consist predominantly of N+, with traces of CO2+. Even for the HM fiber, there is possible overlap at 14 Da. Indeed, some trace amount of N was recently found by the authors in M60J using synchrotron hard X-ray photoelectron spectroscopy (Johansen et al., Reference Johansen, Schlueter, Lam, Asp and Liu2021).
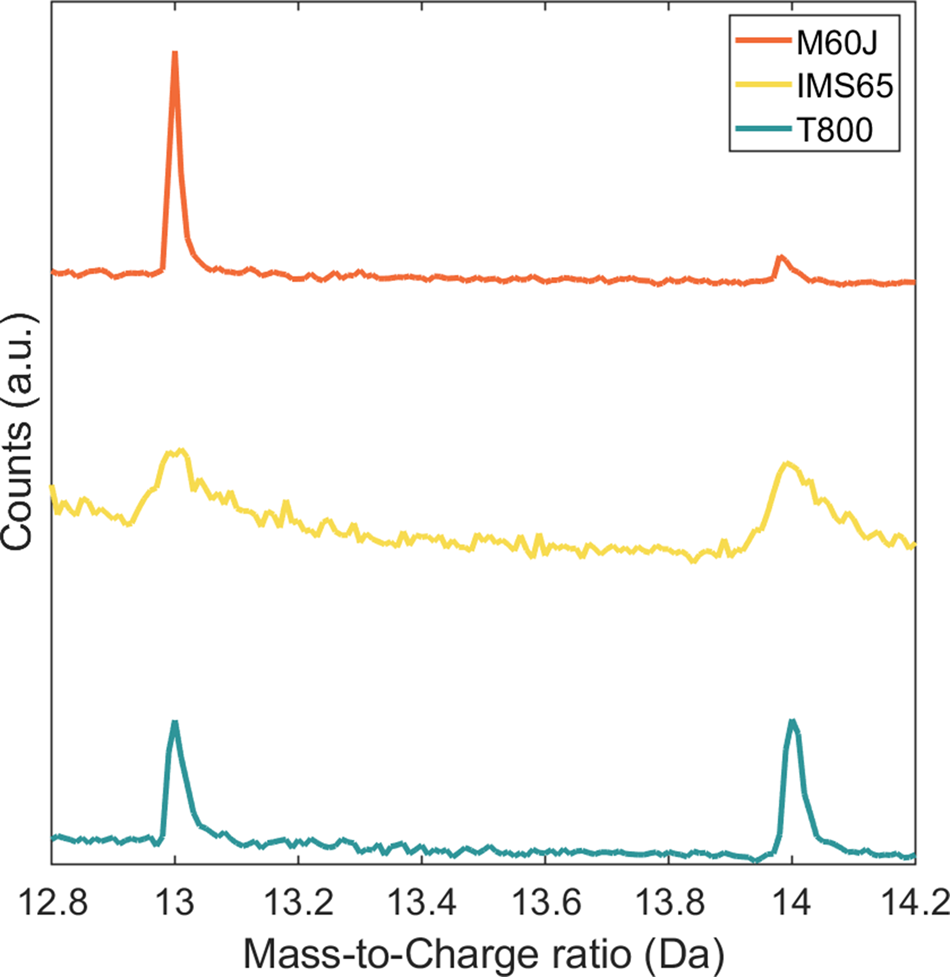
Fig. 3. Mass spectra of the HM fiber, M60J, and the IM fibers, IMS65 and T800, showing peaks at 13 and 14 Da. Note that the 14 Da peak is significantly smaller for M60J.
Table 2. Mass-to-Charge-Ratio of N Containing Ions at Different Charge States.

Peaks marked in green were confirmed in the mass spectra of IM fibers, and in orange may exist, but could not be confirmed due to overlap with other peaks.
It should be noted that for the HM fibers 75–80% and for the IM fibers 60–70% out of the total number of ions are monatomic ions C1+ and C2+. However, nearly all efforts were put on identifying and deconvoluting molecular ions.
Mass Resolution
The mass resolution of APT spectra for carbon fibers depends on several factors. First, the type of the carbon fiber heavily influences the mass resolution. For similar specimen geometry and same operational parameters, the spectra of M60J have the highest mass resolving power (M/ΔM, where M is the mass-to-charge ratio and ΔM is full-width at half-maximum) at 12 Da of ~850, while T800 and IMS65 has ~250 and ~150, respectively (Fig. 4a). The inferior resolution for the spectra of the IM fibers, T800 and IMS65, is mainly due to their lower thermal conductivity [35 versus 150 W/m K for T800 and M60J, respectively (Toray, 2020)], which, in turn, stems from a less ordered microstructure—many small crystalline domains (~20 Å) interweaved with amorphous domains with similar size (Fredi et al., Reference Fredi, Jeschke, Boulaoued and Asp2018). On the other hand, HM fibers such as M60J have undergone a final heat treatment with a much higher temperature (1,800–3,000°C) than IM fibers (1,100–1,600°C). M60J fibers, thus, exhibit a more ordered microstructure, with much larger crystalline domains (>300 Å). Consequently, their thermal conductivity is almost three times higher than that of T800. As the heat produced by the laser pulse cannot dissipate quick enough, residual heat will be responsible for delayed field evaporations that manifests as broadened peaks (poorer mass resolving power), including thermal tails. Thus, the fiber microstructure plays an important role in the obtained mass resolution.

Fig. 4. Factors that influence mass resolution. (a) Mass spectra of different fiber types—M60J, IMS65, and T800, at 12 Da. HM fiber, M60J, has better resolution than IM fibers, IMS65 and T800. (b) Mass spectra of cross-sectional and lateral specimens. The cross-sectional geometry leads to better resolution. (c) Mass spectra at pulse frequency of 100 and 200 kHz. 100 kHz leads to better resolution. (d) Mass spectra of a blunt and a sharp specimen tip. The blunt specimen leads to better resolution.
Second, since the microstructure of carbon fibers is anisotropic (graphene sheets in the crystallites align roughly along the fiber axial direction), the orientation geometry of the extracted material piece also influences the mass resolution. A schematic representation of the two orientation geometries can be found in Johansen et al. (Reference Johansen, Schlueter, Lam, Asp and Liu2021). Specimens extracted from the cross-sectional surface of T800 yield mass resolving power at 12 Da of ~580, compared with ~250 for specimens extracted from the lateral surface of T800 (Fig. 4b). Note both specimens started to field evaporate at the comparable voltage level, indicating a similar specimen shape. The higher mass resolution for the cross-sectional specimen is likely attributed to the orientation of the graphene sheets, which conduct heat more easily in-plane than across planes (Sun et al., Reference Sun, Stroscio and Dutta2009). With better heat dissipation, thermal tails for cross-sectional specimens become less pronounced. However, it should be noted that the preparation of cross-sectional specimens is much more time consuming than lateral ones, since the lift-out procedure becomes more delicate and the length of the material piece extracted per lift-out is limited to the fiber diameter of 5 μm, whereas in a lateral lift-out, the length easily reaches 15 μm.
Third, mass resolution is also affected by operational parameters such as laser pulse frequency. Comparing the mass resolving power of M60J at a pulse frequency of 100 and 200 kHz, it yields ~850 for the low frequency and ~310 for the high frequency (Fig. 4c). Similar degradation of mass resolving power at faster laser pulse frequency was previously reported (Cerezo et al., Reference Cerezo, Clifton, Gomberg and Smith2007; Kolli & Meisenkothen, Reference Kolli and Meisenkothen2014). This is attributed to insufficient time for the tip to cool down to the base temperature between pulses, and thus heat accumulated at the tip causes a spread of the time-of-flight of field evaporated ions from laser pulsing. By extending the time between pulses, that is decrease the pulse frequency, the residual heat has more time to dissipate away from the tip, and narrower mass peaks are achieved.
Finally, the shape of the specimen also has a great impact on the mass resolution. The bluntest T800 specimen had a mass resolving power of ~570, while the sharpest T800 specimen had a mass resolving power of ~80 (Fig. 4d). This is in accordance with several previous studies that reported higher mass resolution for blunter specimens (Bunton et al., Reference Bunton, Olson, Lenz and Kelly2007; Cerezo et al., Reference Cerezo, Clifton, Gomberg and Smith2007; Perea et al., Reference Perea, Wijaya, Lensch-Falk, Hemesath and Lauhon2008; Tang et al., Reference Tang, Gault, Ringer and Cairney2010; Kolli & Meisenkothen, Reference Kolli and Meisenkothen2014). A blunt specimen has a larger cross-sectional area. The heat dissipation is proportional to the cross-sectional area, and thus blunter specimens give better mass resolution. However, the blunt tip requires a higher voltage (~5,000 V) to initiate field evaporation compared with the sharp tip (~2,500 V). The high voltage means a high mechanical load on the specimen that leads to a higher risk for premature specimen fracture. In this specific case, the blunt specimen yielded 530,000 ions, whereas the sharp specimen yielded 2,000,000 ions. It is clearly a trade-off between high mass resolution and large acquisition data.
Field Evaporation Behavior
Under the same pulse, several ions can reach the detector with close succession—a so-called multiple hit event. Multiple hits can stem from correlated evaporation events on the specimen and/or mid-flight dissociation of molecular ions (Saxey, Reference Saxey2011). If the hits occur within too small a proximity in space and time, the detector can fail to register all the ions, and thus resulting in deviation from the true composition.
The proportion of multiple hit events is high for APT of carbon fibers: average for M60J ~55.5%, T800 ~65.2%, and IMS65 ~62.0%. Separating the spectrum of M60J into multiple and single hits, large differences are revealed in the proportion of multiple to single hits over the major mass-to-charge peaks (Fig. 5). Except for C+ at 12 Da, for which single hits are most common, multiple hits are predominant for ions of charge state 1+ and 2+ (C2+ at 6 Da,  ${{\rm C}_3}^{2 + }$ at 18 Da, ${{\rm C}_2}^ +$ at 24 Da, ${{\rm C}_5}^{2 + }$ at 30 Da, ${{\rm C}_3}^ +$ at 36 Da, ${{\rm C}_7}^{2 + }$ at 42 Da, ${{\rm C}_4}^ +$ at 48 Da, ${{\rm C}_9}^{2 + }$ at 54 Da, ${{\rm C}_5}^ +$ at 60 Da, and ${{\rm C}_6}^ +$ at 72 Da). At peaks with overlap of low charge state ions, 1+ and 2+, and high charge state ions, 3+ and 4+, the majority of ions have low charge states. For example, the 36 Da peak consist of ~60% ${{\rm C}_3}^ +$, ~25% ${{\rm C}_6}^{2 + }$, ~5% ${{\rm C}_9}^{3 + }$, and ~10% ${{\rm C}_{12}}^{4 + }$. For ions of charge state 3+ and 4+ ( ${{\rm C}_7}^{3 + }$ at 28 Da, ${{\rm C}_8}^{3 + }$ at 32 Da, ${{\rm C}_{11}}^{4 + }$ at 33 Da, ${{\rm C}_{13}}^{4 + }$ at 39 Da, ${{\rm C}_{10}}^{3 + }$ at 40 Da, ${{\rm C}_{11}}^{3 + }$ at 44 Da, and ${{\rm C}_{15}}^{4 + }$ at 45 Da), the number of single hits is either approximately equal to or larger than the number of multiple hits. The connection between charge state and proportion of multiple and single hit events is possibly due to many of the ions of charge state 3+ and 4+ dissociate into daughter ions of charge state 1+ and 2+, which in turn are registered as multiple hits. The ions of charge state 3+ and 4+, that do not dissociate, reach the detector as single hits. Interestingly, C+ does not follow this pattern, which suggests that C+ often evaporates in a favorable way. It should also be noticed that the proportion of single hits in 28 and 44 Da is even higher compared with other 3+ ions. This may be due to the fact that part of the 28 and 44 Da peaks come from CO+ and ${{\rm C}{\rm O}_2}^ +$, respectively.

Fig. 5. Relative ion counts of single and multiple hits of selected peaks from an M60J spectrum.
The typical voltage history curve for the carbon fibers has a jagged appearance due to the fluctuations in field evaporation; the detection rate profile consists of sudden spikes that are more than an order of magnitude above the target detection rate (0.2%) (Fig. 6). These spikes reflect sudden bursts of evaporation, where the consequent detection rate increased beyond the pre-set threshold value, which triggered a voltage drop. The threshold multiplier for the detection rate in the experiments was set to 4. A higher value of the multiplier may smoothen the voltage history curve by potentially reducing the number of voltage drops. On the other hand, however, it would lead to a higher risk of premature specimen failure, which is highly undesirable given the high specimen premature failure rate in this study. Sometimes, several consecutive drops occur until the detection rate has returned around the target value. The entire voltage drop during such a process can exceed 150 V. After regaining the stable evaporation, the voltage slowly increases before next sudden detection spike occurs. Presumably, the interweaved microstructure with amorphous and crystalline domains induces the uneven evaporation. The crystalline domain is of anisotropic nature with strong covalent bonds in-plane and weak van der Waals bonds between planes. The voltage increases as atoms in a “strong” domain are evaporated, but when a “weak” domain is revealed, the field is suddenly much stronger than what is needed for retaining the set detection rate. Thus, larger ions and ions of higher charge states evaporate, where multiple ions may be generated; and some of them may dissociate, and again creating multiple hit events. When some of these large domains are dislodged, local sharp features may be created on the tip surface, which increases the field strength and more domains may be dislodged, and the consecutive chain reaction manifests as the multiple spikes in detection rate. Micro-fracture of the specimen may also occur during evaporation. Such unstable evaporation behavior is believed to, at least partly, cause the very limited success rate of analyzing carbon fibers using APT. Using a high energy UV laser in a newer generation of APT instrument will most probably lead to a better success rate, partly due to the more stable evaporation attributed to the higher available laser energy per area, as achieved for diamond (Mukherjee et al., Reference Mukherjee, Watanabe, Isheim, Seidman and Moutanabbir2016).

Fig. 6. Voltage history for M60J with corresponding detection rate history.
The proportion of multiple hits varies along the voltage curve and is much higher at the voltage peaks (which coincide with the detection spikes) than at the voltage valleys. For M60J, the average proportion of multiple hits is ~77% at voltage peaks, and ~44% at voltage valleys. Extracting spectra at voltage peaks and valleys separately, and then separating into multiple and single hits, it is evident that the proportions of multiple hits and molecular ions are much higher at the voltage peaks (Figs. 7a, 7b).

Fig. 7. Relative ion counts of multiple and single hits of selected peaks from the spectra of M60J during (a) voltage peaks and (b) voltage valleys.
In general, multiple hit events are common when analyzing carbon-containing materials, such as various carbides (Thuvander et al., Reference Thuvander, Weidow, Angseryd and Andrén2011). Even for a small amount of C in the solid solution of a steel, all C ion types appear predominantly in multiple hit events, and the average proportion of multiple hit events related to C-containing ions is more than 80% (Marceau et al., Reference Marceau, Choi and Raabe2013). However, it must be noted that the voltage pulsing mode was used in the study by Marceau et al. A laser pulse mode often leads to lower evaporation field and lower multiple hit events, but more complex molecular ions. As discussed in the “Quantification” section, multiple events also impair accurate quantification. Therefore, from various aspects, it is desirable to reduce multiple hit events by, for instance using high laser pulse energy and setting a high specimen temperature (without introducing evaporation between pulses).
Conclusion
APT on three types of carbon fiber was conducted. Here, we present a systematic procedure for identification and deconvolution of peaks in the mass spectra from carbon fibers: mass spectra from the chemically simple HM carbon fiber are used as a baseline for more complex spectra from the IM carbon fibers. High mass resolution is of critical importance to accurate peak assignment, peak deconvolution, and ultimately accurate quantification. Type of carbon fiber, relative orientation geometry of the material piece on the APT tip (lateral specimen or cross-sectional specimen), laser pulse frequency, and specimen shape are shown to have a great impact on the mass resolution. The heterogeneous microstructure of carbon fibers is believed to cause, at least partly, sometimes unstable evaporation, a high proportion of multiple hit events, and limited acquisition volume. Best practices to overcome these challenges are suggested. These insights pave the way to further exploration of APT of carbon fibers.
Acknowledgments
This work was financially supported by the Swedish Energy Agency (Project nr 46598-1). F.L. thank the strategic innovation program LIGHTer (funding provided by Vinnova, the Swedish Energy Agency and Formas).


 Open access