

Finland-Swedish is a variety of Swedish spoken as a native language by approximately 290,000 individuals in Finland (Statistics Finland, Reference Finland2021). Using speech data from participants from four Swedish-speaking regions in Finland, the current study explores the presumed merger of the long front vowels /eː/ and /ɛː/ while taking into consideration both inter- and intraspeaker variation through the predictors of regional background and speech style. In Sweden-Swedish, these two vowels are usually considered separate phonemes, forming word pairs such as rev [re:v] ‘reef, ripped’ and räv [rɛ:v] ‘fox.’ Meanwhile, /eː/ and /ɛː/ are said to have mergedFootnote 1 in Finland-Swedish, where both are produced as [eː] (Kuronen, Reference Kuronen2001; Reuter, Reference Reuter2015; Riad, Reference Riad2014).
Swedish in Finland: history and linguistic features
Finland is a bilingual country with two official national languages, Finnish and Swedish. The territory of Finland was ruled by Sweden between the twelfth and nineteenth centuries, becoming an autonomous grand duchy of the Russian Empire in 1809 and eventually gaining independence in 1917. Although only 5.2% of the population today is registered as Swedish-speaking (Statistics Finland, Reference Finland2021), Finland-Swedish retains its position as having theoretically equal status to the Finnish majority language. The Swedish-speaking population has historically been concentrated in two coastal regions, that is, Ostrobothnia (Sw. Österbotten, Fi. Pohjanmaa) on the western coast, and the southern coast and archipelago, including the capital city Helsinki (Sw. Helsingfors) (Reuter, Reference Reuter and Clyne1991). Yet, the only monolingually Swedish-speaking municipalities that remain in Finland are found on the Åland Islands, an autonomous Swedish territory located between Finland and Sweden in the Baltic Sea. On the mainland, cultural and linguistic attitudes tend to vary by region, with Swedish-speakers from Ostrobothnia more often living in Swedish-speaking communities and having strong cultural ties to Sweden (ÅSUB, 1999), while Finland-Swedes in the south are more likely to live in bilingual or Finnish-majority communities and be fluent L2 Finnish speakers or native Finnish and Finland-Swedish bilinguals (see Strandberg & Gooskens, Reference Strandberg, Gooskens, Smakman, Nekvapil and Fedorova2022; Tandefelt & Finnäs, Reference Tandefelt and Finnäs2007).
The Finland-Swedish variety exhibits a number of features that differentiate it from Swedish spoken in Sweden. A typical syntactic feature is the continued use of the archaic forms di ‘they' and dem ‘them,’ rather than dom, which is preferred in Sweden (Leinonen, Reference Leinonen2015), while morphological features include the use of inverted gender article for some nouns like en nummer ‘a number’ (cf., Standard Swedish ett nummer) (Reuter, Reference Reuter2015:18). There are also “certain, mainly phonological, features which make it easy to conclude whether a speaker comes from Sweden or from Finland” (Reuter, Reference Reuter and Clyne1991:104). Reuter (Reference Reuter and Clyne1991) cited intonation as the main clue but also mentions other notable features, such as vowel and consonant quality. Differences in vowel quality between Finland-Swedish and Sweden-Swedish are widely accepted. For example, where Sweden-Swedish predominantly makes use of vowel quality to distinguish long and short vowels, Finland-Swedish has been found to mainly use vowel quantity (Helgason, Ringen, & Suomi, Reference Helgason, Ringen and Suomi2013; Kiparsky, Reference Kiparsky, Stratal, Vaux and Nevins2008). In relation to vowel production, another often-mentioned difference between the Finland-Swedish and Sweden-Swedish vowel systems is the /eː-ɛː/ merger in Finland-Swedish (see below).
The study
The current study seeks to investigate the /eː-ɛː/ merger in Finland-Swedish, as well as to provide a quantitative acoustic analysis of sociogeographical variation of the vowels. In an analysis on phonetic variation in allophones [øː] and [œː] by monolingual Finland-Swedish and bilingual Finland-Swedish and Finnish participants, Strandberg, Gooskens, and Schüppert (Reference Strandberg, Gooskens and Schüppert2021) found regional variation to be present in more formal speech styles but not in informal speech. When comparing height and fronting of the two vowels, the analysis indicated that Ostrobothnian participants produced the allophones in significantly different ways than speakers from the south (i.e., Helsinki and Southern Finland) when reading a list of word pairs and a passage of text, but not in samples from spontaneous speech. These results are unexpected, given that–based on the continuum of formality–more uniform, standard-like production is expected in formal contexts, with intergroup differences increasing in informal, spontaneous speech (Labov, Reference Labov2006; Trudgill, Reference Trudgill1974). According to the Vowel Space Paradox (Van der Harst, Reference Van der Harst2011), while the overall vowel space of a speaker shrinks in spontaneous speech, individual vowels are expected to increase their vowel space and, consequently, their sociogeographical variation. In contrast to expectations, the findings by Strandberg et al. (Reference Strandberg, Gooskens and Schüppert2021) suggested decreased sociogeographical variation in spontaneous speech. While examining the /eː-ɛː/ merger, the current study explores whether a similar pattern of regional variation is found in the production of other vowels in Finland-Swedish. Therefore, our research questions can be summarized thus:
1. In comparing height and fronting of /eː/ and /ɛː/ in Finland-Swedish, do the results indicate a complete merger of both vowels as [eː] in the variety, as existing literature presumes?
2. What, if any, are the effects of regional background and speech style on the /eː-ɛː/ merger in Finland-Swedish?
Whereas Strandberg et al. (Reference Strandberg, Gooskens and Schüppert2021) examined allophones [øː] and [œː], which are both orthographically represented by <ö>, the current study explores the merger of /eː/ and /ɛː/, represented by the graphemes <e> and <ä>, respectively. Considering that the distinction between the phonemes is preserved in Swedish orthography, the differences of reading tasks versus spontaneous speech could potentially be larger when participants are faced with the written form. Yet, if the merger is indeed complete in Finland-Swedish, participants would not be expected to produce different vowels in any speech style, as they would be presumed to associate both graphemes with [eː].
In addition to using speech data from the same participants from Ostrobothnia, Southern Finland, and HelsinkiFootnote 2 as in Strandberg et al. (Reference Strandberg, Gooskens and Schüppert2021), the current study also involves speakers from the autonomous, monolingually Swedish-speaking Åland Islands. The inclusion of participants from Åland is particularly relevant, given that, unlike the majority of Swedish varieties on the Finnish mainland, the Åland dialect is usually considered to retain the use of /ɛː/ (e.g., Leinonen, Reference Leinonen2010:93). According to the null hypothesis, the findings should thus indicate a /eː-ɛː/ merger for speakers from mainland Finland, but not for Ålanders. Despite the focus of the study being on regional and stylistic variation, our dataset also allows us to examine whether there are any indications of apparent-time change or gender-based variation in the production of /eː/ and /ɛː/.
The following section provides an overview of previous research in regional variation in Swedish and acoustic analysis focusing on Finland-Swedish. The variables examined in this study are described, and formant reference values are provided. The third section outlines the methodology of the study, including data collection and acoustic and statistical analyses. The fourth section comprises the results, while the fifth section discusses implications of the findings.
Background
Swedish regional variation
A number of quantitative studies on phonetic and phonological variation in Swedish have been conducted in the twenty-first century thanks to the SweDat 2000 project and SweDia database, consisting of speech samples from sites in Sweden and Swedish-speaking Finland (Lindh & Eriksson, Reference Lindh and Eriksson2009). Bruce (Reference Bruce2004) used the SweDia dataset to distinguish six dialect regions based on intonation, while Schaeffler (Reference Schaeffler2005) investigated the realization of phonological quantity in Swedish dialects using cluster analysis of vowel and consonant duration. According to the results of both studies, Finland-Swedish dialects were clustered separately from dialects spoken in Sweden, with different subcategories for varieties in Ostrobothnia and southern Finland. For the current study, the most relevant work based on the SweDia dataset is that of Leinonen (Reference Leinonen2010), who provided an acoustic analysis of regional variation in Swedish vowel production. Using samples of word lists read by speakers from ninety-eight rural sites in Sweden and Finland, Leinonen (Reference Leinonen2010) examined variation in vowel production by means of Bark filtering and subsequent Principal Component Analysis (PCA). While the study found that the dialects from ten Finland-Swedish locations generally formed a distinct cluster in the dataset, Leinonen notes that speakers from Åland mainly resembled those from Swedish Uppland (Leinonen Reference Leinonen2010:157).
Reuter (Reference Reuter1971) was the first to examine acoustic data from Finland-Swedish speakers, comparing Finland-Swedish vowel production to reference values from Sweden-Swedish and Finnish (reported by Fant [Reference Fant1959] and Wiik [Reference Wiik1965], respectively). In the study, four male speakers from Helsinki read a list of sixty target words containing long and short vowels (Reuter, Reference Reuter1971:241). Based on first and second formant frequencies, Reuter found that the Finland-Swedish vowels tended to be placed in intermediate position between the Sweden-Swedish and Finnish vowels. The author also concluded that qualitative differences between long and short vowels are very small or nonexistent in Finland-Swedish (Reuter, Reference Reuter1971:246). Similarly, Kuronen (Reference Kuronen2000)Footnote 3 found that Finland-Swedish speakers use quantity for distinguishing between long and short vowels, while Sweden-Swedish speakers rely on quality. In his study, Kuronen (Reference Kuronen2000) examined vowel height and fronting of recorded samples from sixteen male speakers and also found that, unlike in Sweden-Swedish, no diphthongization occurs in Finland-Swedish; the author argues that this is due to the lack of /ɛ/ in Finland-Swedish, which creates more acoustic and auditory space for the three front vowels /i/, /e/, and /æ/, meaning that no diphthongization is required to distinguish the vowels (Kuronen, Reference Kuronen2000, Reference Kuronen2001). Regional variation in the production of Swedish unstressed /e/ was examined by Kim (Reference Kim2005), who compared speakers from Helsinki and Stockholm, as well as speakers of rural dialects on Åland and Uusimaa (Sw. Nyland) on the southern coast of Finland. Although the study is based on data from only one or two speakers per local dialect, the results indicate that speakers from Helsinki and most of Uusimaa lower and back /e/ before /r/. This supports previous literature arguing that complementary distribution of short stressed [e] and [æ] (in which the allophone [æ] only occurs before /r/) is also found for unstressed /e/ in Finland-Swedish (Kim, Reference Kim2005:11).
As to the role of language contact, Kim (Reference Kim2006) explored intonation patterns in the speech of participants from seven rural regions in southern Finland and Ostrobothnia and found that many Finland-Swedish speakers displayed falling intonation, similar to that found in Finnish; specifically, falling pitch accents were found in areas with heaviest contact with Finnish, suggesting Finnish influence on Finland-Swedish in these regions (Kim, Reference Kim2006:79). Examining simultaneous bilingualism and speech style as predictors of variation in Finland-Swedish, Strandberg et al. (Reference Strandberg, Gooskens and Schüppert2021) investigated the effects of language background (monolingual Finland-Swedish or bilingual Finland-Swedish and Finnish), regional background, and age group on height and fronting of allophones [øː] and [œː]. Additionally, samples from three contextual styles were compared for each participant. The statistical analysis indicated that, although speakers usually distinguished between the two allophones, increased overlap of [øː] and [œː] was found in the vowel spaces of simultaneous bilinguals, particularly in spontaneous speech. Furthermore, the findings by Strandberg et al. (Reference Strandberg, Gooskens and Schüppert2021) also indicated regional variation, showing that speakers from Ostrobothnia produced the allophones in significantly different ways than speakers from Helsinki and southern Finland when reading a word list and a passage of text but not in spontaneous speech. The current study, therefore, seeks to shed more light on stylistic and regional variation in Finland-Swedish through the examination of /eː/ and /ɛː/ produced by participants from four historically Swedish-speaking regions in Finland.
The variables
The Standard Swedish vowel system consists of nine phonemes, each of which contains a long and short allophone.Footnote 4 The graphemes <e> and <ä> are most consistently produced as /e/ and /ɛ/, occurring either as the long vowels [eː] and [ɛː] or the corresponding short vowels [e̞] and [ɛ̝] (Leinonen, Reference Leinonen2010:21).Footnote 5 In addition, a more open allophone of /ɛ/ is used before /r/ (Leinonen, Reference Leinonen2010:17; Riad, Reference Riad2014:17). If followed by /r/ or a retroflex consonant, /ɛ/ is produced as [æ] or [æː]: compare nät [nɛ:t], ‘web’, and när [næ:r], ‘when.’ The long vowels /eː/ and /ɛː/ have long been argued to have merged in Finland-Swedish, as well as in traditional dialects around the Stockholm area in Sweden (Bruce, Reference Bruce2010:115; Leinonen, Reference Leinonen2010:21). Through this merger, both long vowels are produced as [eː], although the prerhotic allophone [æː] remains. In varieties with the merger, speakers are thus expected to produce distinct vowels for nät-när, but not rev-räv, which would both be produced as [re:v].
Phonological mergers
In investigating phonological mergers, three basic mechanisms for modeling them have been described: merger by approximation, merger by transfer (Trudgill & Foxcroft, Reference Trudgill, Foxcroft and Trudgill1978), and merger by expansion (Herold, Reference Herold1990). The merger-by-approximation model assumes that two phonemes gradually approximate each other until they merge, forming a single class in the vowel space (Labov, Reference Labov1994:321; Lennig, Reference Lennig1978). This mechanism is presumed to be triggered by language-internal factors and to occur subconsciously (Guy, Reference Guy1990:61). The merger-by-transfer model, on the other hand, describes how one phoneme may disappear as a result of words from one phonemic category being transferred into another (Gross & Forsberg, Reference Gross and Forsberg2020:269). Since the transfer model involves lexical items being transferred from one category to the other one by one, no items are found to be phonetically between classes (Labov, Reference Labov1994:321). Finally, the merger-by-expansion model assumes both original points of production remain but that one of the vowel clusters increases its variability, resulting in the two vowel clusters eventually overlapping with each other (Hall-Lew, Reference Hall-Lew2010:8). According to Guy (Reference Guy1990:61), both the transfer and expansion models are externally induced, but while merger by transfer is considered a conscious mechanism often triggered by prestige forms, merger by expansion presumes that change is triggered subconsciously.
If the /eː-ɛː/ merger was only found among Swedish-speakers in Finland, it could be presumed that it pertains to the merger-by-expansion model and transfer from Finnish L2 speakers, given that the Finnish language does not include the phoneme /ɛ/. As such, the situation would be similar to the appearance of the cot-caught merger in mining towns in eastern Pennsylvania, where Herold (Reference Herold1997) argues that the merger was triggered by immigration of speakers of Polish and non-Germanic languages. However, as we presume that the /eː-ɛː/ merger did not occur independently in Swedish spoken in Finland and Stockholm, it is unlikely that the phenomenon is due to triggers external to the language (see the discussion about /iː/ and /yː/ in Gothenburg Swedish by Gross and Forsberg [Reference Gross and Forsberg2020]). Instead, we hypothesize that the proximity of the two vowels in the vowel space, with both /eː/ and /ɛː/ being unrounded front mid vowels, is likely to have contributed to the merger, and thus the merger-by-approximation model provides the most likely explanation.
Previous research on /eː-ɛː/
The merger of /eː-ɛː/ in Stockholm Swedish has received some attention in linguistic research. Sometimes referred to as “Stockholm-e,” it has historically been considered a marker of low education and social status (Kotsinas, Reference Kotsinas, Fornäs, Boëthius, Forsman, Ganetz and Reimer1994a:331). However, in a study on youth language in the 1980s, Kotsinas (Reference Kotsinas, Fornäs, Boëthius, Forsman, Ganetz and Reimer1994a, Reference Kotsinas1994b:113-14) argued that the two vowels were “unmerging,” with /ɛː/ becoming more like the open allophone [æː], perhaps due to speakers overshooting the goal when attempting to produce [ɛː]. Gross, Boyd, Leinonen, and Walker (Reference Gross, Boyd, Leinonen and Walker2016) examined the sociolinguistic conditioning of variation of [ɛː] and [æː] in speech of adolescents of immigrant and nonimmigrant background in Stockholm and Gothenburg. The study found that while speakers from Stockholm produced variants of [ɛː] and [æː] that were systematically different, the Euclidean distance between the allophones was very small to the point where the authors question whether it is even perceptible (Gross et al., Reference Gross, Boyd, Leinonen and Walker2016:239, 241). In Gothenburg, participants of immigrant backgrounds resembled speakers from Stockholm more than other speakers from Gothenburg, producing a more open [ɛː] and thus being at the forefront of local change in the /ɛː/ vowel (Gross et al., Reference Gross, Boyd, Leinonen and Walker2016:243).
Table 1 summarizes the mean values for /eː/ and /ɛː/ for groups of (male) Finland-Swedish and Sweden-Swedish speakers in studies by Fant, Henningson, and Ståhlhammar (Reference Fant, Henningsson and Ståhlhammar1969), Kuronen (Reference Kuronen2000), and Reuter (Reference Reuter1971). Both Reuter (Reference Reuter1971) and Kuronen (Reference Kuronen2000) presume that the distinction between /eː/ and /ɛː/ no longer exists in Finland-Swedish, thus providing no values for /ɛː/. Leinonen (Reference Leinonen2010:157), who did include /ɛː/ in her analysis for Finland-Swedish speakers, highlights that speakers from eastern regions, that is, Uppland and Gotland in Sweden, as well as Swedish-speaking Finland (with the exception of Åland), produce /ɛː/ in a more close way in comparison to other Swedish-speaking regions, thus supporting the presumed lack of distinction between between /eː/ and /ɛː/.
Table 1. Mean F1 and F2 Hz values for /eː/ in Finland-Swedish (FS) from Reuter (Reference Reuter1971:243) and Kuronen (Reference Kuronen2000:140), and for /ɛː/ in Sweden-Swedish (SS) from Fant et al. (Reference Fant, Henningsson and Ståhlhammar1969:28) and Kuronen (Reference Kuronen2000:68)

Methodology
Speakers
Sociolinguistic interviews with 141 Finland-Swedish speakers were recorded for the study, with the first author conducting the interviews. Cluster analysis of Finland-Swedish dialects has usually demonstrated two mainland clusters, Ostrobothnia and Southern Finland, with Åland also found to be distinct (Bruce, Reference Bruce2004; Leinonen, Reference Leinonen2012; Schaeffler, Reference Schaeffler2005; Tandefelt, Reference Tandefelt2007). Based on these regional clusters, the current study compares speakers from Ostrobothnia (n = 40), Southern (mainland) Finland (n = 35), and the Åland Islands (n = 26). Furthermore, forty participants from the Greater Helsinki Region were interviewed to examine the allegedly most “urban” and standard-like Finland-Swedish variety (Østern, Reference Østern2004). The participants were aged 18–91 and were divided into three groups to reflect approximate generations of twenty years: 18–35 years (n = 43), 36–55 years (n = 56), and above 56 (n = 42).Footnote 6
Difficulties in recruiting male participants resulted in an uneven gender distribution, with forty-two male participants compared to ninety-nine female participants. However, no considerable multicollinearity between variables was detected using the variance inflation factor (VIF). The speakers consist of simultaneous bilingual Finland-Swedish and Finnish and monolingual or L2 bilingual participants. However, given the lack of bilingual participants from the monolingually Swedish Åland Islands, the predictor of language background was not included in the current study.
Data collection
The data were collected through sociolinguistic interviews, allowing for the examination of intraspeaker variation through the use of three contextual styles: spontaneous speech, reading a passage of text, and reading a list of words. The sociolinguistic interview presumes that the speaking task influences the amount of attention the speaker pays to their speech, hence affecting their speech production. Spontaneous speech, considered the most naturalistic informal speech that can be obtained in an interview, can be observed when participants pay little to no attention to the interview setting (see Labov, Reference Labov2006:64-72). In contrast, participants’ attention to speech is expected to increase with more formal tasks, that is, the reading of a passage of text or a list of words. To our knowledge, besides Strandberg et al. (Reference Strandberg, Gooskens and Schüppert2021), this is the first study to use sociolinguistic interview data for acoustic analysis of Finland-Swedish vowel production.
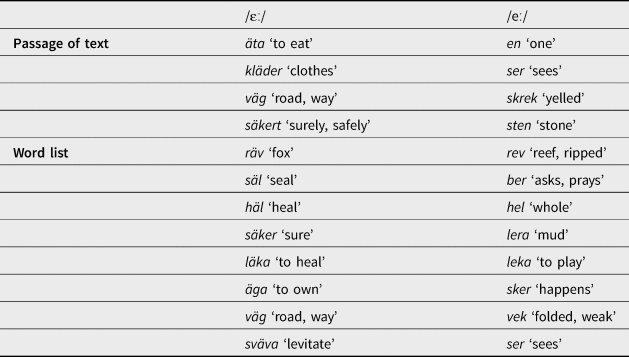
Speakers were interviewed individually, and the interviews were recorded using a TASCAM DR-100 recorder with a Sennheiser E845 tabletop microphone. The conversational modules of the interview schedule (see Labov, Reference Labov, Baught and Sherzer1984) were designed to lead to topics relating to participants’ childhoods and memories rooted in language use, but the interview structure was never followed rigidly. After the interview, the participants were asked to read a passage of text, which was an adapted version of Little Red Riding Hood.Footnote 7 In the final production task, participants were asked to read a list of words out loud. The target words in the reading passage and the word list are included in Table 2.
Table 2. Target words for the passage of text and word list. Target vowels are indicated, and English translations included
Acoustic analysis
The target vowels were segmented from the recordings using the acoustic analysis software Praat (Boersma & Weenink, Reference Boersma and Weenink2018), set to a window length of 25 ms and a dynamic range of 30 dB. The frequency maximum was set to 5000 Hz for male and 5500 Hz for female participants. Annotation was performed manually according to the expected productions of target vowels, with first and second formants measured at the vowel midpoint using the formant-tracker (Thomas, Reference Thomas, Holmes and Hazen2014). The list of words contained eight target words per vowel for sampling, while the reading passage contained four target words per vowel. Additionally, five tokens for each vowel were sampled from spontaneous speech for a total goal of 4794 tokens (34 tokens x 141 speakers). Overall, 136 tokens were either missing or excluded for various reasons, such as a vowel formant demonstrating a considerable linear drop, being highly articulatorily reduced, showing coarticulation of adjacent segments, or having generally unclear formant structure (see Kim, Reference Kim2005; Smakman, Reference Smakman2006; Strandberg, Reference Strandberg2018; Thomas, Reference Thomas, Holmes and Hazen2014). The final total of tokens used in the study was therefore 4658. The minimum number of tokens for the analysis was three tokens per speaker per vowel per speech context, which was achieved in all cases except for one speaker for the reading passage.
To perform normalization, formant samples were extracted from the target vowels as well as six additional vowelsFootnote 8 produced by the speakers. Based on existing reviews of normalization procedures (see Adank, Smits, & van Hout, Reference Adank, Smits and van Hout2004; Clopper, Reference Clopper2009; Fabricius, Watt, & Johnson, Reference Fabricius, Watt and Johnson2009; Flynn & Foulkes, Reference Flynn and Foulkes2011), which have pointed to the vowel-extrinsic, formant-intrinsic, and speaker-intrinsic methods as performing best for sociolinguistic data, the data were normalized using the Nearey individual log-mean method (i.e., Nearey1). The vowels package (Kendall & Thomas, Reference Kendall and Thomas2018) for the computing language R (R Core Team, Reference Core Team2020) was used to transform the data.
Statistical analysis
Using the lme4 package (Bates et al., Reference Bates, Mächler, Bolker, Walker, Christensen, Singmann and Dai2020) for R, linear mixed modelsFootnote 9 were fitted to predict F1 and F2 of long Swedish vowels /eː/ and /ɛː/. The models included the random effect of speaker with random intercepts, alongside vowel type (close-mid /eː/, open-mid /ɛː/) and style (word list, reading, spontaneous speech) as within-subject fixed factors, while regional background (Åland, Ostrobothnia, Helsinki, Southern Finland) was included as a between-subjects fixed factor. Contrasts were applied to all factors using sum-coding, and the statistical models were fitted with predictors and interactions using step-up modeling. Additional between-subject factors based on demographic information were age group (18-35, 36-55, 56+), and gender (male, female). We report the standardized beta coefficients (β), the standard error (SE), and the t- and p-values for the linear mixed models. The alpha level was set to 5%. For interaction effects, pairwise comparisons were conducted using the emmeans package (Lenth, Singmann, Love, Buerkner, & Herve, Reference Lenth, Singmann, Love, Buerkner and Herve2020), and for these we report the t-ratio, degrees of freedom, and p-value.
Results
Vowel type
The models predicting normalized F1 and F2 values both showed highly significant main effects of vowel type. The close-mid vowel /eː/ was found to have significantly lower F1 values (β = -.27, t = -10.96, p < .001) and significantly higher F2 values (β = .20, t = 10.90, p < .001) compared to the factor mean, indicating that /eː/ is produced in a more close and fronted way than /ɛː/. These results mirror differences between the vowels based on reference values by Fant et al. (Reference Fant, Henningsson and Ståhlhammar1969) and Kuronen (Reference Kuronen2000) for Sweden-Swedish speakers (Table 1), thus contradicting the presumption that the vowels have merged completely in Finland-Swedish.
Speech style
Both models indicated significant main effects of speech style (averaged over both vowels), and the model predicting vowel height (F1) also showed a highly significant interaction effect of vowel type and style. Pairwise comparisons of the interaction predicting F1 values (Table 3) indicate that /eː/ and /ɛː/ are produced significantly differently in formal speech contexts, with /eː/ being produced with significantly lower normalized F1 values in the styles of word list (t(683) = -10.03, p < .001) and reading (t(683) = -9.38, p < .001). Interestingly, in spontaneous speech, the contrast between F1 values for /eː/ and /ɛː/ is nonsignificant. This is confirmed by the mean normalized Hz values for each vowel in the three speech styles (Table 4), which also show with differences in vowel height being removed in spontaneous speech. No two-way interaction for vowel type and style was found for fronting (F2), as the normalized values remain significantly different in all speech styles.
Table 3. Summary of pairwise comparison of normalized F1 values with the contrast of vowel type and the predictor of speech style (n = 844)
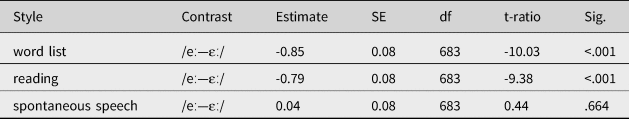
Table 4. Mean normalized Hz values for the target vowels for /eː/ and /ɛː/ according to speech style

Although we should be cautious when comparing the normalized mean values from the current study with the reference values in Table 1, we can observe some general patterns. For /ɛː/, speakers in our dataset produce the highest F1 values in the context of reading (458 Hz, range 374-558), but the value still remains lower than the reference values for Sweden-Swedish speakers, that is, 505 Hz (Fant et al., Reference Fant, Henningsson and Ståhlhammar1969) and 590 Hz (Kuronen, Reference Kuronen2000). Meanwhile, F2 values in reading have a mean of 1800 Hz (range: 1534-1984), which is between the Sweden-Swedish values by Fant et al. (Reference Fant, Henningsson and Ståhlhammar1969) and Kuronen (Reference Kuronen2000) at 1949 Hz and 1650 Hz, respectively. With regards to /eː/, both Reuter (Reference Reuter1971) and Kuronen (Reference Kuronen2000) found that Finland-Swedish speakers produce /eː/ more open than Sweden-Swedish speakers, at 418 Hz and 446 Hz, respectively. Mean normalized F1 values for /eː/ in our data are closest to these reference values when reading a text (429 Hz, range: 361-506); however, in the same context, F2 values are lower (1854 Hz, range: 1617-2028) compared to values by both Reuter (Reference Reuter1971) at 2203 Hz and Kuronen (Reference Kuronen2000) at 1964 Hz.
Regional background
Both models showed significant two-way interactions of vowel type and regional background, as well as three-way interactions of vowel, style, and region. Pairwise comparisons for the three-way interactions are demonstrated in Tables 5 and 6, and vowel plots visualizing the interactions are provided in Figure 1.Footnote 10

Figure 1. Vowel plots demonstrating normalized F1 and F2 values of /eː/ and /ɛː/ for speakers from four regions in three speech styles. The y-axes demonstrate the F1 interval from 300 to 650 Hz, and the x-axes demonstrate the F2 interval from 1450 to 2300 Hz. Individual tokens as well as 95% confidence ellipses are shown.
Table 5. Summary of pairwise comparison of normalized F1 values with the contrast of vowel type and the predictors of speech style and region (n = 844)

Table 6. Summary of pairwise comparison of normalized F2 values with the contrast of vowel type and the predictors of speech style and region (n = 844)

Pairwise comparisons for vowel height indicate that, when reading a list of words, /eː/ is produced in a significantly more close way compared to /ɛː/ by speakers from Åland (t(683) = -11.61, p < .001), Ostrobothnia (t(683) = -3.31, p = .001), and Helsinki (t(683) = -2.69, p = .007). Meanwhile, when reading a text, speakers from all regions produce /ɛː/ in a more open way, with significantly higher F1 values. However, in spontaneous speech, no region distinguished significantly between the two vowels in terms of vowel height. On the other hand, the three-way interaction for fronting shows that speakers from both Southern Finland and Helsinki produce significantly different F2 values for /eː/ and /ɛː/ in reading (t(683) = 2.02, p = .043 and t(683) = 3.62, p < .001, respectively), but merge the vowels in the word list and spontaneous speech. In contrast, Ålanders and Ostrobothnians produce /eː/ in a significantly more fronted way than /ɛː/ in all contexts.
While the results indicate that speakers from Åland tend to produce /eː/ and /ɛː/ in a more distinct way than speakers from mainland Finland, the vowels were also found to differ significantly in samples from Ostrobothnia. Furthermore, speakers from the southern coast may also distinguish between /eː/ and /ɛː/ but only in formal styles. The two vowels were least distinct in Southern Finland, where a significant difference was only found for both height and fronting in the context of reading. However, it is interesting to note that in the case of vowel height, all regions merged /eː/ and /ɛː/ in spontaneous speech. This suggests that fronting is the foremost method for distinguishing the two vowels in spontaneous speech for participants from Åland and Ostrobothnia. If we examine the three-way interaction with the contrast of regional background rather than vowel type,Footnote 11 we find that significant differences are mainly found between speakers from Åland and the other three regions with regards to the production of /ɛː/. When reading a list of words, speakers from Åland produce /ɛː/ with significantly higher F1 values and significantly lower F2 values than speakers from the mainland. When reading a passage of text, the contrasts between Åland and the other regions are significant in vowel height but nonsignificant in fronting, while in spontaneous speech the only significant regional contrast is that of Åland and Southern Finland for fronting of /ɛː/ (t(498) -2.74, p = .038).
Age and gender
Both models predicting F1 and F2 showed significant main effects of age; however, no interactions involving age were found to significantly improve the models. Pairwise comparisons for the three levels in the main effect of age, combined over the factors of vowel type, style, and region, are shown in Table 7. The results suggest a pattern in which speakers from the youngest group (18-35) produce both vowels in a significantly more open and backed way than the older groups. The middle group (36-55) is also shown to produce significantly higher F1 values for speakers aged 56+ (t(135) = 2.79, p = .018), although there is no significant difference between the two oldest groups for F2.
Table 7. Summary of pairwise comparison of normalized F1 and F2 values for the main effect of age (n = 844)

The main effect of gender was found to significantly improve the model predicting vowel fronting, with the model summary indicating that female participants produce significantly higher F2 values for both vowels compared to the factor mean (β = -4.86, p < .001). Female speakers, therefore, tend to produce more fronted versions of both vowels compared to the male participants, while the absence of a significant effect of gender for the model predicting F1 indicates a lack of gendered practices in the height of these vowels.
Discussion
The results of the statistical analysis comparing height and fronting of /eː/ and /ɛː/ in the speech of Finland-Swedish participants shed new light on Swedish spoken in Finland. In contrast to previous literature on Finland-Swedish vowel production, which supposes that /ɛː/ has merged into /eː/, our findings suggest that speakers do produce these vowels in significantly different ways. Although the degree to which /eː/ and /ɛː/ differ with regards to vowel height and fronting varies by region and speech style, our results indicate that /ɛː/ should not be so easily dismissed in discussions of Finland-Swedish phonology.
Not unexpectedly, speakers from Åland were found to usually distinguish between /eː/ and /ɛː/, producing /ɛː/ in a significantly more open way when reading a list of words or text, as well as a more backed way in all speech styles. However, since a similar pattern is found for Ostrobothnians, regional differences between Åland and mainland Finland regarding the /eː-ɛː/ merger are not as clear as previous literature suggests. Furthermore, speakers from Helsinki produce a significantly more open /ɛː/ in the contexts of word list and reading passage, as well as a more backed /ɛː/ in reading. Speakers from Southern Finland were the most likely to merge /eː/ and /ɛː/, only producing significantly distinct variants in terms of vowel height and fronting in the context of reading.
Swedish-speakers from Ostrobothnia, and, in particular, Åland, tend to have close cultural ties to Sweden (ÅSUB, 1999) and influence from Sweden-Swedish is likely to explain why these regions demonstrate a clearer distinction of /eː/ and /ɛː/ than speakers from Helsinki and Southern Finland. However, it is notable that not even Ålanders, who were not expected to merge the vowels, produced significantly different F1 values of /eː/ and /ɛː/ in spontaneous speech. In fact, both Ålanders and Ostrobothnians only produced differing F2 values for the vowels in spontaneous speech, suggesting that these speakers mainly identify the two vowels through vowel fronting in informal styles. It seems that, as the vowels move closer in the vowel space in spontaneous speech, the difference in terms of vowel height is lost, and distinction is only upheld by fronting.
Although the /eː-ɛː/ merger seems to be present in spontaneous speech by Finland-Swedish speakers from the southern coast, our results indicate that formal speech styles may still result in distinction of the vowels. Considering that style-shifting is related to the degrees of social awareness of a variable (Labov, Reference Labov, Eckert and Rickford2001:86), the interaction effects involving speech style suggest some perceptual differences with regard to height and fronting in the production of /eː/ and /ɛː/ in the Finland-Swedish population. The contrast between formal and informal speech styles may indicate a level of prestige attached to the phoneme distinction, even for speakers of a variety where the phonemes are considered merged. The prevalence of the /eː-ɛː/ distinction can perhaps be partially explained by Swedish orthography, as participants may be more inclined to hypercorrect and produce differing versions of /eː/ and /ɛː/ when they are faced with <e> and <ä> in written form. Regardless, it is interesting that the context in which speakers from both Helsinki and Southern Finland produce significantly different F1 and F2 values for the vowels is the reading of a text, not a list of words. A possible explanation for this may be the choice of reading passage; if participants associate Little Red Riding Hood with a story being read aloud to children, this may encourage them to articulate in an exaggerated fashion that is beyond what they produce when reading individual words.
The distinction of speakers from Åland in the comparison of vowel production between regions generally supports findings of previous research, indicating that Åland dialects have more in common with Swedish spoken in Sweden than Finland-Swedish varieties (Leinonen, Reference Leinonen2010; Schaeffler, Reference Schaeffler2005). However, it is notable that, with the exception of the contrast Åland-Southern Finland for the vowel /ɛː/, there were no significant regional differences in vowel production in spontaneous speech. While mirroring the findings of Strandberg et al. (Reference Strandberg, Gooskens and Schüppert2021) for [øː] and [œː], these results are surprising, as speakers would be expected to demonstrate less regional variation in formal speech styles and more variation in spontaneous speech. Yet, while our results indicate that the vowel space shrinks in spontaneous speech (as expected by the Vowel Space Paradox), causing more overlap between /eː/ and /ɛː/, regional variation also seems to decrease. Our study thus shows that not only are /eː/ and /ɛː/ produced in more distinct ways in formal speech contexts for speakers from all four regions, but interregional differences in vowel production between speakers from Åland and the other regions are also more evident in the word list and passage of text. While unexpected, these findings are not completely unique; Van der Harst (Reference Van der Harst2011:264) examined the Vowel Space Paradox in Dutch, and found that while the vowel space decreased in size for monophthongs in spontaneous speech, only some vowels showed an increase in variation in the informal context. Furthermore, Van der Harst (Reference Van der Harst2011) found considerable interdialectal differences in reading tasks for Dutch participants, specifically when comparing Dutch speakers from the south of the country to ones from the Randstad metropolitan area. He argues that the sociogeographical differences in formal speech styles may be due to the strong position of local dialects in the south (Van der Harst, Reference Van der Harst2011:265). Similarly, we hypothesize that the distinction of Åland compared to the other Finland-Swedish regions when reading is either a result of a strong local linguistic identity, or simply due to speakers from Åland navigating toward a standard-like pronunciation typical of Sweden rather than Finland.
Although pairwise contrasts of vowel type showed that speakers from Ostrobothnia had a stronger tendency to produce distinct variants of /eː/ and /ɛː/ than speakers from Helsinki or Southern Finland, no significant differences in production of the vowels were found between the mainland regions in any style. Therefore, we can conclude that, despite the three regions differing in how much they merge the phonemes, sociogeographical variation in the production of the individual vowels /eː/ and /ɛː/ are relatively small in mainland Finland. This is in contrast to previous findings by Strandberg et al. (Reference Strandberg, Gooskens and Schüppert2021), who, while working with acoustic data from the same participants as the current study, found significant differences between speakers from Ostrobothnia and Helsinki/Southern Finland in the production of [øː] and [œː]. Moreover, Ostrobothnia and Southern Finland are usually considered to vary considerably (e.g., Ivars, Reference Ivars2015), with previous quantitative research placing Ostrobothnian and Southern Finland-Swedish dialects in different clusters (Bruce, Reference Bruce2004; Leinonen, Reference Leinonen2012; Schaeffler, Reference Schaeffler2005). Yet, for the vowels examined in this study, regional variation on the mainland with regards to individual vowels seems to be insignificant, with intraregional differences largely limited to the extent of which they distinguish between /eː/ and /ɛː/.
The predictor of age indicated that speakers aged 18-35 produce both /eː/ and /ɛː/ more open and more backed than older speakers. In the case of vowel height, the middle group (36-55) also produces the vowels in a more open way than speakers aged 56+, suggesting possible apparent-time evidence of change. Yet, because the effect of age is found over both vowels, there is no evidence of unmerging or increased merging of /eː/ and /ɛː/; rather, what we see is a general shift of the two vowels. Although this study did not include language background as a predictor, we hypothesize that influence from Finnish could potentially explain this shift. Kuronen (Reference Kuronen2000) found his Finnish participants to produce [eː] as more open and backed (468 Hz and 1838 Hz) than the Finland-Swedish participants (446 Hz and 1964 Hz). Increasing influence from Finnish could explain higher F1 and lower F2 values for /eː/ among younger participants, while the corresponding shift for /ɛː/ may be a consequence of /eː/ becoming more open and backed. With regard to gendered practices, the study found that female speakers tended to produce both /eː/ and /ɛː/ in a more fronted way than male speakers. If the results with regards to age group indeed are due to change over time, the predictor of gender suggests that female participants are not at the forefront of this change, as could be expected (see, e.g., Labov, Reference Labov1990; Milroy & Milroy, Reference Milroy and Milroy1985). Rather, for /eː/ and /ɛː/, female speakers demonstrate a tendency to prefer the more standard fronted production of the vowels.
Based on previous accounts reporting a lack of distinction between /eː/ and /ɛː/ in Finland-Swedish, the /eː-ɛː/ merger could be discussed in the context of the merger-by-approximation model, as we proposed earlier. However, given our study shows statistically distinct productions of /eː/ and /ɛː/ by Finland-Swedish speakers from different regions in various speech styles, the results raise the question of the point at which two phonemes can be argued to have merged. Situations of discordance between speaker perception and production have been discussed in other language context, as for example in the case of the meat-mate lexical sets in Mid-Ulster English (Maguire, Clark, & Watson, Reference Maguire, Clark and Watson2013). While speakers of the variety believe that the two sets are pronounced the same (either using [e] or the diphthong [ɪə]), analysis of speech production has shown a small but significant phonetic difference between them (Maguire et al., Reference Maguire, Clark and Watson2013:231-32). Likewise, the findings of our statistical analysis do not support the popular belief of a complete /eː-ɛː/ merger in Finland-Swedish. Although the mean values indicated much smaller differences between /eː/ and /ɛː/ in both F1 and F2 compared to Sweden-Swedish reference values, the statistical analyses indicate significant differences between the phonemes, with the predictor of vowel type constituting a main effect as well as interaction effects with regional background and speech style. It could, therefore, be argued that /eː/ and /ɛː/ present a near-merger in Finland-Swedish, that is, a situation in which two sounds sound the same to speakers of a variety, but they nevertheless differentiate them in production (Labov, Karen, & Miller, Reference Labov, Karen and Miller1991). Yet, while our results seem to contradict the claims of a complete /eː-ɛː/ merger in Finland-Swedish and thus potentially support the categorization of /eː-ɛː/ as a near-merger, it must be highlighted that no experiment has yet been conducted that would investigate how speakers themselves perceive these vowels. Thus we echo the question posed by Gross et al. (Reference Gross, Boyd, Leinonen and Walker2016:239) regarding allophones of /ɛː/ in Sweden-Swedish, wondering how these statistically significant differences in terms of formant frequencies correspond to perceptual distinction by speakers themselves.
Conclusion
The findings of the current study call into question the longstanding assumption of a full /eː-ɛː/ merger in Finland-Swedish. Despite relatively small differences between mean F1 and F2 values for /eː/ and /ɛː/, the statistical analysis indicates that Finland-Swedish speakers from not only Åland but also mainland Finland produce the vowels in significantly different ways. While the differentiation is more consistent in terms of vowel fronting, formal contexts of reading a word list and, in particular, a passage of text increase the likelihood of speakers also producing distinct values for height. These results indicate that studies examining Finland-Swedish should be careful when omitting /ɛː/ from their analysis; although /eː/ and /ɛː/ are not found to be as clearly distinct in Finland-Swedish as in Sweden-Swedish, our results suggest that the merger is not complete. As the current study only deals with speech production, however, future research could shed light on the extent to which Finland-Swedish listeners perceive differences between vowels.
This project is one of the first to examine regional and stylistic variation in Finland-Swedish using acoustic analysis. Yet, we acknowledge some limitations of our study, namely the broadness of our studied regions, the exclusion of language background as a predictor for the production of /eː/ and /ɛː/, as well as the uneven gender distribution of participants. In spite of these shortcomings, however, our findings provide valuable insight into regional variation and style-shifting for a linguistic variety that has received little focus in the past. Notably, our findings on the /eː-ɛː/ merger in Finland-Swedish call into question existing presumptions regarding the homogeneity of the variety.
Acknowledgments
The fieldwork for this study was funded with support from the Finnish Cultural Foundation and the Swedish Cultural Foundation in Finland.
Competing Interests
The author(s) declare none.
Appendix
Table A1. Overview of participant data according to regional background, age, and gender

Table A2. Summary for mixed effects model fitted to F1 production of /eː/ and /ɛː/ with random intercepts for speaker

Table A3. Summary for mixed effects model fitted to F2 production of /eː/ and /ɛː/ and with random intercepts for speaker

Table A4. Summary of pairwise comparison of normalized F1 and F2 values with the contrast of region and the predictors of speech style and vowel type


 Open access