


I. Introduction
Viruses and graft-transmissible pathogens impose high costs on specialty crop growers, including grape growers. If left uncontrolled, pathogens can cause diseases that cost the grape industry billions of dollars annually (Mannini and Digiaro, Reference Mannini, Digiaro and Meng2017). Planting certified, clean vines derived from virus-tested (negative) foundation stocks minimizes the initial introduction of virus diseases into the vineyard (Arnold et al., Reference Arnold, McRoberts, Cooper, Smith and Golino2019), which is key to cost-effective grape production (Golino et al., Reference Golino, Fuchs, Sim, Farrar, Martelli and Meng2017). Clean plant material is also critical for the U.S. grape industry and other specialty crop industries to remain competitive globally. For these reasons, the National Clean Plant Network (NCPN) was established under the 2008 USDA Farm Bill to produce, maintain, and distribute virus-tested plant material to nurseries and growers of specialty crops. The NCPN consists of various crop-specific national networks. The first networks established were NCPN-grapes and NCPN-fruit trees, reflecting the national importance of these specialty crops (Gergerich et al., Reference Gergerich, Welliver, Gettys, Osterbauer, Kamenidou, Martin, Golino, Eastwell, Fuchs, Vidalakis and Tzanetakis2015). More recent crop-specific networks include berries, citrus, hops, roses, and sweetpotato.
Since their inception, the focus of NCPN-grapes centers has been primarily to ensure the production and maintenance of virus-tested vine stocks and the distribution of propagation material derived thereof to nurseries and growers. This is achieved by comprehensively testing elite rootstock and scion material for detrimental viruses and other graft-transmissible pathogens, that is, phytoplasmas and Xylella fastidiosa, by conducting therapeutics when viruses and other undesirable pathogens are detected, and by establishing clean vine stocks in foundation vineyards. The propagative material derived from virus-tested stocks that are distributed by NCPN centers is rigorously tested for multiple pathogens, including viruses associated with grapevine leafroll disease (GLRD), one of the most serious grape virus diseases in the United States and throughout the world (Naidu et al., Reference Naidu, Rowhani, Fuchs, Golino and Martelli2014). Imported grape material is carefully tested in NCPN-grapes centers over a five-year period using state-of-the-art equipment and a panel of advanced diagnostic technologies. If necessary, imported grape material is subject to disease-elimination therapy, commonly done via microshoot tip culture, as appropriate, prior to releasing clean plants to growers and nurseries by state and federal authorities (Golino et al., Reference Golino, Fuchs, Sim, Farrar, Martelli and Meng2017).
GLRD causes substantial yield losses (30–68%), delays fruit ripening, and reduces fruit quality by altering soluble solids, titratable acidity, tannin content in berry skins, and flavor profiles (Naidu et al., Reference Naidu, Rowhani, Fuchs, Golino and Martelli2014). Viruses associated with GLRD can be disseminated through uncontrolled vegetative propagation and grafting practices. Some GLRD-associated viruses can also be disseminated in the vineyard by several species of mealybugs and soft scales (Tsai et al., Reference Tsai, Rowhani, Golino, Daane and Almeida2010; Naidu et al., Reference Naidu, Rowhani, Fuchs, Golino and Martelli2014). Agrochemical controls are not effective against viruses, and there is no cure in the vineyard. An infected vine hosts the virus until it is removed from the vineyard. If kept in the vineyard, the infected vine will serve as an inoculum for secondary virus spread.
Several studies have thoroughly examined the economic impact of GLRD in New Zealand (Walker et al., Reference Walker, Charles, Froud and Connolly2004; Nimmo-Bell and Company Limited, 2006), New York (Atallah et al., Reference Atallah, Gómez, Fuchs and Martinson2012), and California (Ricketts et al., Reference Ricketts, Gómez, Atallah, Fuchs, Martinson, Battany, Bettiga, Cooper, Veregaal and Smith2015; Fuller, Alston, and Golino, Reference Arnold, McRoberts, Cooper, Smith and Golino2019; Cheon et al., Reference Cheon, Fenton, Gjerdseth, Wang, Gao, Krovetz, Lu, Shim, Williams and Lybbert2020). Grower costs of GLRD were estimated to range from $21,000 to more than $226,000 per hectare over a 25-year lifespan of a vineyard, depending on the level of infection, the timing of infection, price penalty for poor fruit quality, cultivar, and region of grape production. These studies also identified roguing in combination with the application of insecticides to reduce mealybug vector populations as the most economically attractive GLRD management option in the vineyard (Walker et al., Reference Walker, Charles, Froud and Connolly2004; Nimmo-Bell and Company Limited, 2006; Atallah et al., Reference Atallah, Gómez, Fuchs and Martinson2012; Ricketts et al., Reference Ricketts, Gómez, Atallah, Fuchs, Martinson, Battany, Bettiga, Cooper, Veregaal and Smith2015; Pietersen, Bell, and Krüger, Reference Pietersen, Bell, Krüger and Meng2017). Additional work examined the spatial nature of GLRD and its effects on the per hectare net present value (Atallah et al., Reference Atallah, Gómez, Conrad and Nyrop2015; Atallah, Gómez, and Conrad, Reference Atallah, Gómez and Conrad2017). Recently, Fuller, Alston, and Golino (Reference Fuller, Alston and Golino2019) estimated the vineyard-level economic impact of grapevine leafroll-associated virus 3, the most predominant virus of GLRD (Naidu et al., Reference Naidu, Rowhani, Fuchs, Golino and Martelli2014) in the North Coast region of California. The highest loss was $66,063 per hectare over a 25-year lifespan of a vineyard when growers initially planted unscreened vines and replanted unscreened vines to replace diseased vines. In contrast, planting and replanting vineyards with vines derived from virus-tested stocks minimized losses to $37,875/ha over the 25-year lifespan of a vineyard. Minimized grower losses, although substantial, resulted from damages related to virus introductions from neighboring vineyard blocks due to the aerial dispersal of mealybug vectors (Fuller, Alston, and Golino, Reference Fuller, Alston and Golino2019). The authors also show that grower benefits substantially outweigh the cost of the clean plant program at Foundation Plant Services (FPS) of the University of California at Davis, the major NCPN-grapes center, by at least ten times per year.
NCPN-grapes centers were established more than a decade ago. A pertinent research question is: What are the returns to public investments in NCPN-grapes centers? Many studies examine the returns to public investments in agricultural research and development (Alston et al., Reference Alston, Chan-Kang, Marra, Pardey and Wyatt2000; Heisey and Fuglie, Reference Heisey and Fuglie2007; Alston et al., Reference Alston, Pardey, James and Andersen2009; Pardey et al., Reference Pardey, Alston, Chan-Kang, Hurley, Andrade, Dehmer, Lee, Rao, Carayannis, Kalaitzandonakes, Rozakis and Grigoroudis2018). Yet, analyses of returns to public investments in using innovative technologies to provide clean planting material derived from virus-tested foundation vine stocks are limited. A notable exception is Fuller, Alston, and Golino (Reference Fuller, Alston and Golino2019), which provide a solid foundation to explore the economic benefits for growers and the returns to the public investment in FPS.
In this study, we examined the economic benefits (i.e., reduction of the economic losses due to GLRD) of virus-tested propagative material released by FPS over the period 2006–2019 in California. To account for benefits, we employed Ricketts et al. (Reference Ricketts, Gómez, Atallah, Fuchs, Martinson, Battany, Bettiga, Cooper, Veregaal and Smith2015) estimates of the economic impact of the GLRD previously determined in Napa County, Sonoma County, and the Northern San Joaquin Valley (NSJV) to estimate statewide benefits from 2006 to 2019. We then compared these benefits to the costs of operating FPS and calculated benefit-cost ratios to examine the returns to public investment in FPS over the 14 years. We also carried out a welfare analysis to examine how net benefits (benefits minus costs) are distributed among the different constituents of the grape and wine industry. Our study differs from Fuller, Alston, and Golino (Reference Fuller, Alston and Golino2019) by providing a more nuanced estimate of statewide returns to public investment in FPS for a longer period of time (5 versus 14 years).
II. Materials and methods
A. Initial assumptions
The benefits of adopting certified, clean grapevines derived from virus-tested stocks by grape growers begin when vines start producing in a vineyard. The time lag between the initial purchase of a certified, clean vine and grape production in the vineyard was considered to provide accurate estimates of producing hectares established with clean vines. For example, grape production from vines derived from virus-tested foundation vine stocks was estimated to take 10 or more years on average for three reasons. First, FPS distributes a limited number of cuttings, buds, and plants, primarily to nurseries, upon request following an average of five years of extensive testing (Foundation Plant Services, 2008). Second, nurseries, in turn, bulk up clean stock material in increased and registered vineyards for at least two years to achieve a size capable of producing grafted vines for broad distribution to growers. Third, growers establish vineyards with certified, clean grafted vines that produce grapes in year three and reach maximum fruit production in year five of the vineyard's production cycle.
The parameters used to calculate the annual benefits of adopting clean vines derived from virus-tested stocks were built on the work of Ricketts et al. (Reference Ricketts, Gómez, Atallah, Fuchs, Martinson, Battany, Bettiga, Cooper, Veregaal and Smith2015), who assessed the economic impact of GLRD on Vitis vinifera cv. Cabernet Sauvignon in Napa County, Sonoma County, and the NSJV, including San Joaquin, Merced, Stanislaus, Sacramento, Solano, and Contra Costa Counties. Our study, therefore, focused on Cabernet Sauvignon, widely adopted in California, as a representative wine grape cultivar. We did not include table and raisin grapes due to the lack of detailed information on the GLRD's economic impact on these types of grapes at the onset of our study. We employed the estimates of the GLRD economic impact and optimal management strategy previously determined in Napa County, Sonoma County, and the NSJV (Ricketts et al., Reference Ricketts, Gómez, Atallah, Fuchs, Martinson, Battany, Bettiga, Cooper, Veregaal and Smith2015) to extrapolate the statewide benefits. We considered two disease scenarios, one with a conservative 5% disease incidence rate, a 20% yield reduction, and no price penalty; and the other with a 20% disease incidence rate, a 20% yield reduction, and no price penalty. Under both disease scenarios, the optimal management strategy in each study region is roguing and replanting clean vines in combination with insecticide applications to control vector populations (Ricketts et al., Reference Ricketts, Gómez, Atallah, Fuchs, Martinson, Battany, Bettiga, Cooper, Veregaal and Smith2015).
B. Estimates of certified vine production and their benefits
Two steps were involved in estimating the annual benefits from adopting certified, clean vines derived from virus-tested stocks in California from 2006 to 2019 under the two scenarios described previously. The first step estimates the number of hectares planted to vines derived from virus-tested stocks. The second step estimates the per hectare benefits from using clean plant material relative to its unscreened counterpart. Multiplying total hectares by per hectare benefits yields the annual statewide benefits.
Figure 1 presents a flow chart describing our approach for estimating total benefits in California.
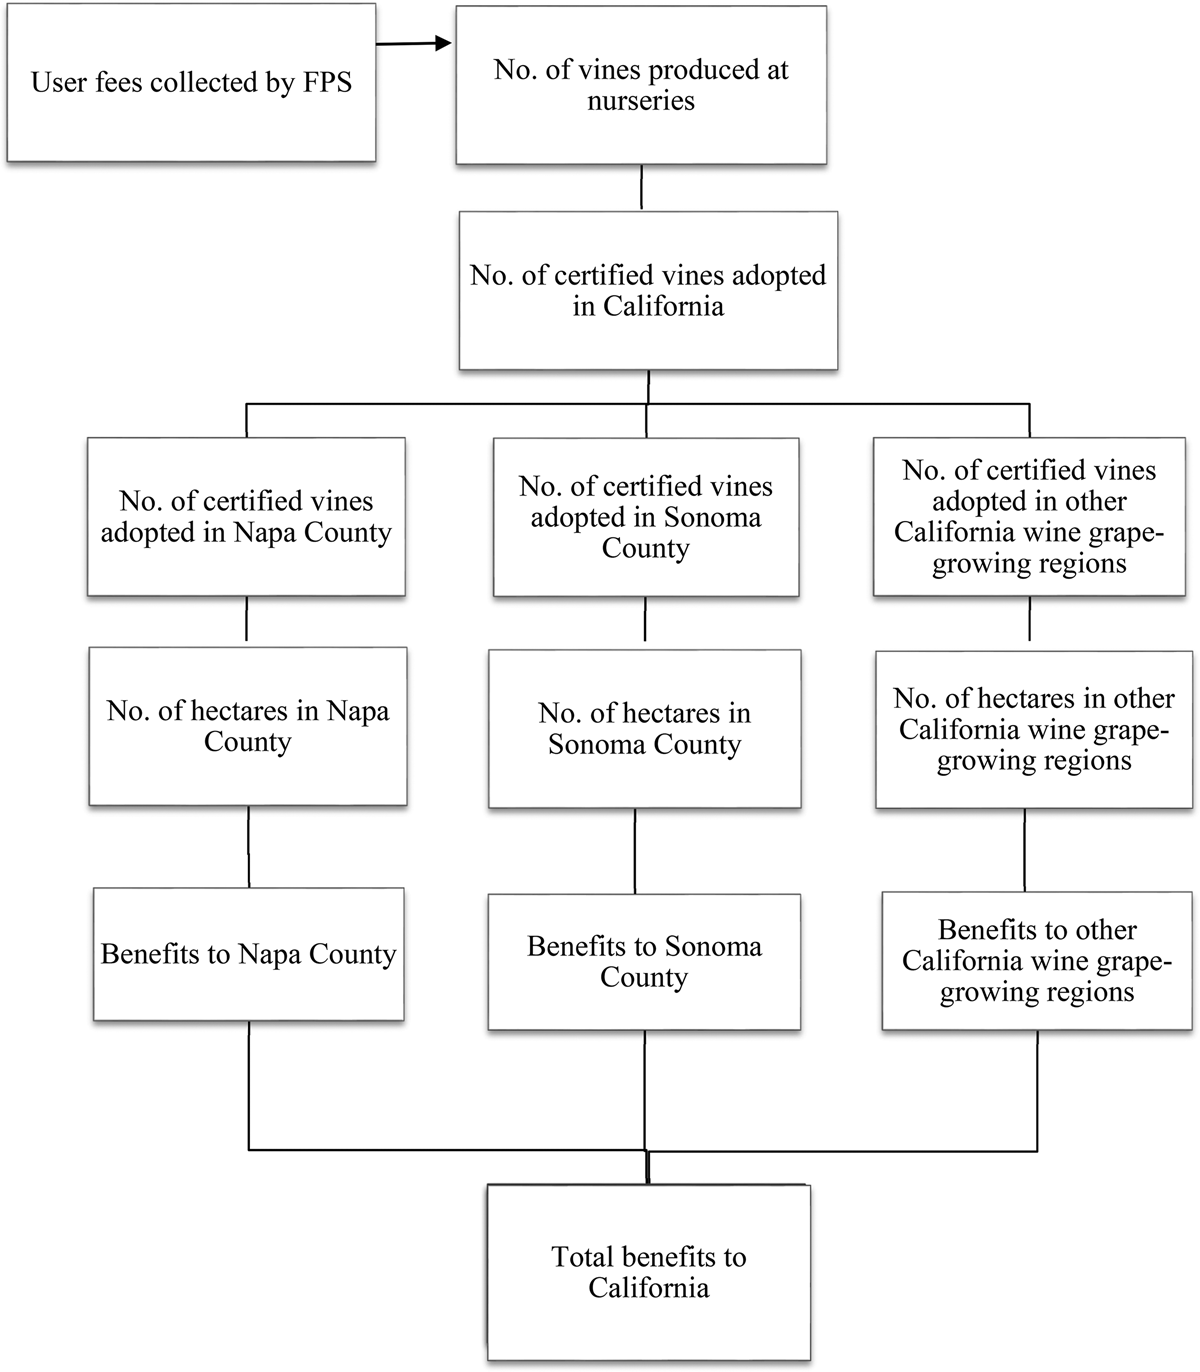
Figure 1. Flow chart describing the approach to estimating total benefits from adopting certified, clean vines in California.
The first step involved estimating the number of vines derived from virus-tested stocks that were propagated by nurseries and the number of hectares planted with certified vines in California from 2006 to 2019. We used information on the user fees collected and recorded by FPS to estimate the number of certified vines grown in vineyards (Foundation Plant Services, 2006–2019; Golino, Reference Golino2019). A detailed record of user fees for each propagative unit sold, exchanged, or retained for growers/nurseries’ own use during the preceding calendar year is kept by FPS (https://fps.ucdavis.edu/fgrmain.cfm). This means that nurseries purchasing grape material from FPS are required to sign the “FPS Grower Agreement,” holding them accountable for reporting and paying the appropriate user fees for using and propagating virus-tested material.
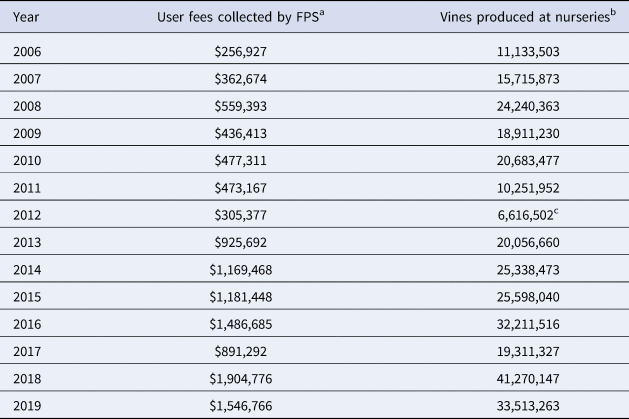
Two price points are applied depending on the type of material sold: $0.048 for one unit of both scion budwood and rootstock or $0.040 for one unit of scion budwood. Based on FPS records, 80% of the collected user fees are for materials sold at the $0.048 price level and 20% for materials sold at the $0.040 price level. Also, FPS prices per propagative unit before 2011 were half of the current prices. This change was considered in our model when estimating the number of certified vines grown in the vineyard. For example, in 2013, the recorded user fees totaled $925,692, and our estimate of the number of virus-tested stock materials sold to growers was 20,056,660 ($925,692 * 0.8/0.048 + $925,692 * 0.2/0.040). Therefore, the number of certified vines derived from virus-tested stocks at FPS that were sold by nurseries to growers was estimated annually. We factored in a 10% loss rate of the material moving from FPS to nurseries or nurseries to vineyards. Following the illustrative example, our estimate of the number of certified vines adopted in vineyards was 18,050,994 (20,056,660 * 0.9) in 2013. The number of certified vines sold to grape growers or vineyard managers was then calculated using the user fees collected by FPS from 2006 to 2019.
Because our study aimed to assess the benefits of FPS in California, we made two assumptions regarding the distribution of certified, clean vines derived from FPS’ virus-tested vine stocks and the farm-level impacts of GLRD. First, we assumed that approximately 10% of certified vines derived from FPS virus-tested vine stocks in California were distributed to Napa County and 10% to Sonoma County because they each represent roughly 10% of the total California wine grape hectares during the study period. Second, we assumed that the wine grape production structure and the farm-level impacts of GLRD in the other 80% of California wine grape-growing regions are similar to those in the NSJV region. These assumptions allowed us to use the GRLD impacts from Ricketts et al. (Reference Ricketts, Gómez, Atallah, Fuchs, Martinson, Battany, Bettiga, Cooper, Veregaal and Smith2015) to conduct a statewide benefit-cost analysis of FPS. We used these two assumptions to calculate the number of vines adopted in Napa County, Sonoma County, and other California wine grape-growing regions. Then, we estimated the number of hectares adopting certified, clean vines according to the average number of vines planted per hectare in each region by Ricketts et al. (Reference Ricketts, Gómez, Atallah, Fuchs, Martinson, Battany, Bettiga, Cooper, Veregaal and Smith2015). Given the availability of GLRD economic impact data only in Napa County, Sonoma County, and the NSJV at the onset of our study but not in any of the other California wine grape-growing regions, we extrapolated the production structure of the NSJV to other California wine grape-growing regions in order to estimate statewide benefits. We recognize this extrapolation as a limitation of our study and discuss it in more detail in the Discussion.
The second step was calculating the annual cash flow for one representative hectare of a vineyard under the two disease scenarios in Napa County, Sonoma County, and other California wine grape-growing regions. The annual cash flow for a one-hectare vineyard affected by GLRD and optimally controlled by growers over a 25-year lifespan was from Ricketts et al. (Reference Ricketts, Gómez, Atallah, Fuchs, Martinson, Battany, Bettiga, Cooper, Veregaal and Smith2015). Similarly, the cash flow of a one-hectare vineyard of certified vines was calculated based on the estimates of Ricketts et al. (Reference Ricketts, Gómez, Atallah, Fuchs, Martinson, Battany, Bettiga, Cooper, Veregaal and Smith2015) for one hectare of a healthy vineyard while also considering a 25% price premium paid by growers for clean, certified vines. The economic benefit from using certified, clean vines derived from virus-tested stocks (or the economic cost of GLRD) for one hectare of the representative vineyard is the difference in cash flow of a hectare affected by GLRD and of a hectare planted with certified, clean vines.
Next, we estimated the economic benefits of using certified, clean vines for each region by multiplying the total hectares planted to certified, clean plants by the per hectare benefits in each region. Adding the annual benefits in Napa County, Sonoma County, and other California wine grape-growing regions yielded the total annual California benefits.
C. Operation costs of the FPS-grapes program
The 2006–2016 costs to maintain and operate the FPS-grapes program are thoroughly documented in FPS annual reports, including salaries, benefits, contract labor, capital investments and equipment, program support, and general operating expenses. Since 2017, operating costs of the FPS-grapes program have not been recorded due to a change in the overall FPS accounting system, which started only reporting total FPS expenses for all crops, including grapes and other crops. Therefore, we calculated the average share of the FPS-grapes program in the total FPS expenses over the period 2006–2016 (60%) and then employed the 60% share to calculate FPS-grapes operating costs for the period 2017–2019. The costs of the FPS-grapes program are directly offset by public and private investments through user fees, direct sales, NCPN funding, gifts and awards, and California Department of Food and Agriculture (CDFA) Nursery Assessments. For example, in 2014, user fees, direct sales, and NCPN funding accounted for 42%, 5%, and 34% of FPS revenue, respectively. The remaining funding was from gifts, awards, and CDFA Nursery Assessments. However, the costs of the FPS-grapes program do not include institutional investment in the program, including the salary and benefits of the faculty director, utilities, use of farmland, and some maintenance costs.
D. Net benefits and welfare analysis
We calculated the cumulative benefits and costs of the FPS-grapes program for the period 2006–2019. We also calculated net program benefits and examined their distribution among grape growers and buyers. In this context, benefits from planting clean vines can be treated as an outward shift of the supply curve for grapes (i.e., more grapes are produced per hectare), with subsequent changes in grower and buyer welfare. To conduct this analysis, we used a measure of benefit distribution grounded in microeconomic theory (Muth, Reference Muth1964; Alston, Norton, and Pardey, Reference Alston, Norton and Pardey1995) to assess the grapevine nurseries, growers, and consumers. This measure corresponds to the economic surplus or gross-annual benefits from a technological change. The share of total net benefits accruing to wine grape growers (producer surplus) and wine grape buyers (consumer surplus) is derived from the following equations:


where ɛ is the elasticity of supply and η is the absolute value of elasticity of demand. Elasticities of supply and demand are pivotal in determining the relative change in welfare for wine grape growers and those who purchase grapes for wine production. When supply is inelastic relative to demand, grape growers enjoy a greater share of the total gains than when supply is elastic relative to demand. Given that grapes are perennials and there is a lag time between planting decisions and fruit harvest, growers are expected to face greater losses or gains in welfare than grape buyers due to a relatively inelastic supply to demand (Fuller, Alston, and Golino, Reference Fuller, Alston and Golino2019). We carried out a sensitivity analysis to determine a range of possible welfare distributions from clean vines based on past estimates of supply and demand elasticities (Fuller and Alston, Reference Fuller and Alston2012).
We used net benefits under the scenarios of no price penalty for a reduction in fruit quality and a 25% yield reduction due to GLRD with initial infection rates of 5% and 20% to determine a range of distributions. Following Fuller, Alston, and Golino (Reference Fuller, Alston and Golino2019), we employed supply elasticities ranging from 0.1 to 1.2 in the short run and up to 2.8 in the long run. Fuller and Alston (Reference Fuller and Alston2012) estimated a number of elasticities of demand values (–2.6, –5.2, and –9.5 for low, medium, and high-quality grapes, respectively). We employed a value of –5.2 in our study, which is pertinent given our use of a representative hectare.
III. Results
A. Use of certified, clean vines derived from virus-tested foundation vine stocks in California
The number of certified vines derived from virus-tested foundation stocks sold by California nurseries each year from 2006 to 2019 was calculated based on the annual user fees collected by FPS (Column (1) in Table 1). The estimated annual average was 21.8 million certified vines. The estimates in Table 1 show a positive trend in the number of certified clean vines produced by nurseries, with some degree of variability during the period of analysis.
Table 1. User fees collected by Foundation Plant Services (FPS) for the distribution of virus-tested plant material and the number of certified vines produced thereof by California nurseries from 2006 to 2019
Notes:
a We assumed that 10% of certified vines derived from FPS virus-tested vine stocks in California were distributed to Napa County, 10% to Sonoma County, and 80% to other California wine grape-growing regions.
b We assumed that the wine grape production structure and the farm-level impacts of GLRD in other California wine grape-growing regions are similar to those in the Northern San Joaquin Valley (NSJV). The NSJV region includes the counties of San Joaquin, Merced, Stanislaus, Sacramento, Solano, and Contra Costa.
c A change in user fee in 2011 caused delays in collecting user fees, hence the artefactual drop in the number of vines produced.
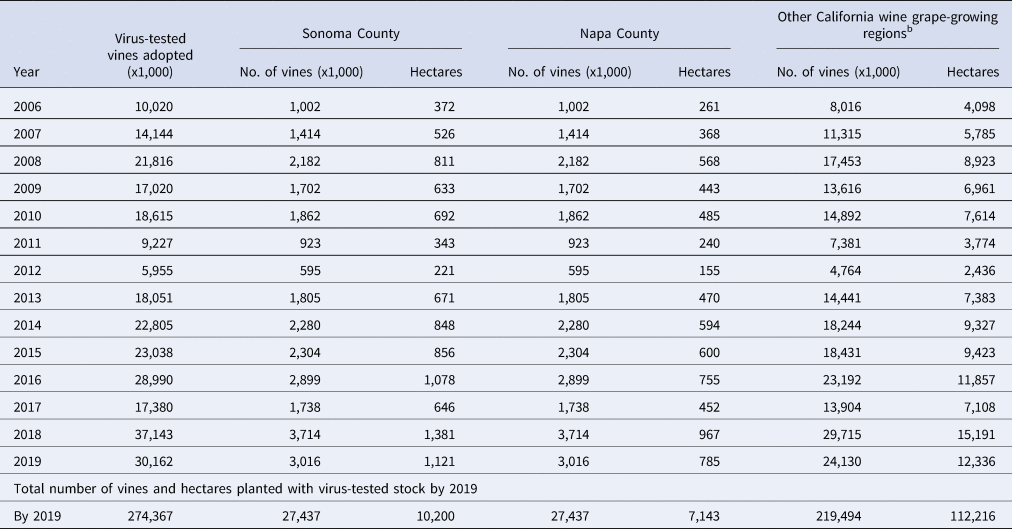
To estimate the number of hectares established for certified, clean vines in Napa County, Sonoma County, and other California wine grape-growing regions, we considered a 10% loss rate for material moving from nurseries to vineyards for the establishment of producing vines with an allocation of 10% to Napa County, 10% to Sonoma County, and 80% to other California wine grape-growing regions each year from 2006 to 2019 (Table 2). For example, the total number of vines adopted in vineyards in 2013 was 18,051,000, among which 1,805,000 were adopted in |Napa County; 1,805,000 in Sonoma County; and 14,441,000 in other California wine grape-growing regions (Row 8 in Table 2). We followed Ricketts et al. (Reference Ricketts, Gómez, Atallah, Fuchs, Martinson, Battany, Bettiga, Cooper, Veregaal and Smith2015) and assumed that plant densities are 3,841, 2,690, and 1,964 vines per hectare in Napa County, Sonoma County, and the NSJV, respectively. As explained in the previous section, we assumed that the wine grape production structure and the farm-level impacts of GRLD in other California wine grape-growing regions are similar to those in the NSJV. The parameters from NSJV were used to calculate the hectares planted in other California wine grape-growing regions. These data were used to calculate the number of hectares adopting certified, clean vines in California. Results were 470 hectares in Napa County, 671 hectares in Sonoma County, and 7,383 hectares in other California wine grape-growing regions in 2013 (Row 8 in Table 2). In year three, these vines started bearing fruit (i.e., 2015 in Table 2).
Table 2. Estimated number of certified, clean vines in vineyards in California, 2006–2019a
Notes:
a We assumed that 10% of certified vines derived from FPS virus-tested vine stocks in California were distributed to Napa County, 10% to Sonoma County, and 80% to other California wine grape-growing regions.
b We assumed that the wine grape production structure and the farm-level impacts of GLRD in other California wine grape-growing regions are similar to those in the Northern San Joaquin Valley (NSJV). The NSJV region includes the counties of San Joaquin, Merced, Stanislaus, Sacramento, Solano, and Contra Costa.
By 2019, we estimated that approximately 7,143 hectares of certified, clean vines were planted in vineyards in Napa County, 10,200 hectares in Sonoma County, and 112,216 hectares in the other California wine grape-growing regions (Table 2). In 2019, 53% of all wine grape bearing hectares in California were planted with certified, clean vines. Assuming an average vine productive lifespan of approximately 25 years, an annual average vineyard replacement rate of 4% is expected, or 56% over 14 years. This suggests that our estimated 53% adoption or replacement rate is reasonable.
B. Economic benefits from the production and maintenance of virus-tested foundation vine stocks at FPS and the distribution of propagative material derived thereof
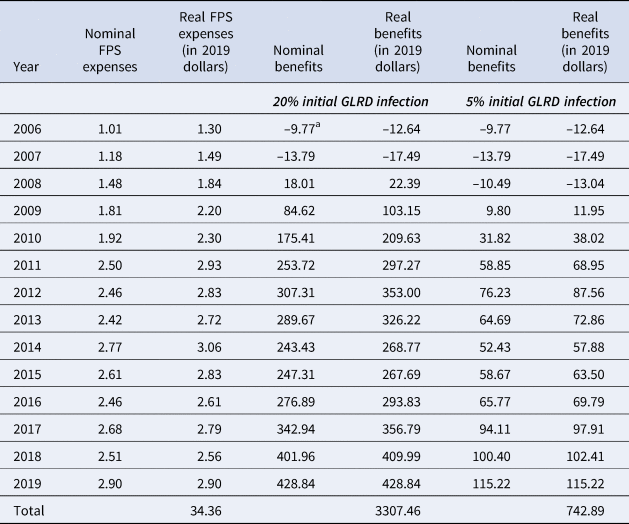
Annual nominal and real benefits from producing and maintaining virus-tested foundation vine stocks were calculated using a “conservative” scenario: (i) a 5% initial GLRD infection rate in commercial vineyards; (ii) a 20% yield reduction with no price penalty for reduced fruit quality; and (iii) roguing in combination with insecticide applications to reduce mealybug populations as the optimal GLRD management strategy. Real benefits were converted to 2019 dollars using a 2% discount rate. We used 2019 as the base year and discounted all the nominal costs and benefits to 2019 to calculate the benefit-cost ratio (Table 3). From 2006 to 2019, the cumulative expenses for FPS were nearly $34.36 million (in 2019 dollars), while cumulative benefits were around $742.89 million (in 2019 dollars). In turn, the benefit-cost ratio is 22:1 (Table 4), suggesting that $1 invested in FPS generated $22 in economic benefit by 2019.
Table 3. Estimated costs and benefits (in million dollars) from producing and maintaining certified, clean vines at Foundation Plant Services (FPS)
Notes:
a Initial land preparation plus vine costs combined with first year operation costs.
Table 4. Summary of benefit to cost ratio of producing and maintaining virus-tested vine stocks, and distributing propagative material at Foundation Plant Services
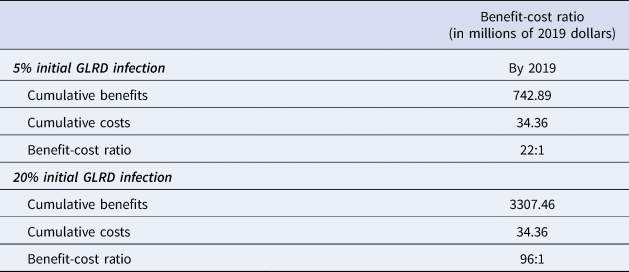
Benefits under a “most likely” disease scenario with a 20% GLRD infection rate in commercial vineyards, a 25% yield reduction, and no price penalty for reduced fruit quality were estimated at $3,307.46 million (in 2019 dollars). The cumulative cost was $34.36 million. In turn, the benefit-cost ratio is 96:1, meaning that $1 invested in FPS generated $96 in benefits by 2019 (Table 4). These results revealed that investment in the production and maintenance of clean vine stocks at FPS has overwhelmingly paid dividends.
C. Welfare analysis
We employed the annual net benefits from using certified, clean vines derived from virus-tested foundation stocks to conduct a welfare analysis in a supply-demand framework. This allowed us to examine the distribution of net benefits between wine grape crushers (buyers, denoted as “consumers” in the welfare analysis) and wine grape growers (producers) using Equations (1) and (2) in the Materials and Methods section. We used the net benefits under the scenarios of no price penalty for the reduction in fruit quality and a 25% yield reduction due to GLRD, with two initial infection rates in commercial vineyards (5% and 20%), to determine a range of distribution of benefits.
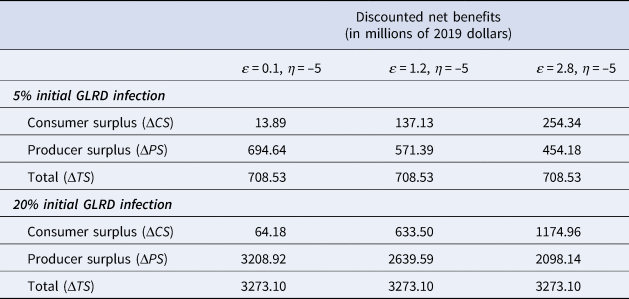
Total cumulative net benefits were $708.53 million and $3,273.10 million by 2019, based on a 5% and 20% initial disease infection rate, respectively (Table 5). Since wine grape supply is inelastic relative to demand, we predicted that grape growers capture most of the benefits accruing from planting certified, clean vines. Maintaining the same demand elasticity and using three alternative supply elasticity estimates across the two initial infection rates, we estimated that grape growers capture most of the total surplus (net benefits), ranging from $454.18 million to $3,208.92 million. In addition, the net benefits captured by consumers/wine producers range from $13.89 million to $1,174.96 million (Table 5). More specifically, under a 5% GLRD infection rate, grape growers’ surplus increased from $454.18 million to $694.64 million as the elasticity of supply decreased from 2.8 to 0.1.
Table 5. Net benefitsa from using certified, clean vines derived from virus-tested stocks by 2019
Notes:
a Net benefits are the difference between total benefits and total costs of operating the FPS-grapes program over the study period.
Similarly, under a 20% GLRD infection rate, grape growers’ surplus increased from $2,098.14 million to $3,208.92 million as the elasticity of supply decreased from 2.8 to 0.1. These results indicate that growers and nurseries capture the most economic surplus from planting certified, clean vines derived from virus-tested foundation vine stocks (Table 5). Depending on the supply elasticity, the share of the growers’ surplus can range from 64% to 98%. Consumers/wine producers also benefit from the program, though their portion is smaller in comparison to growers and nurseries.
IV. Discussion
In this study, we examined the economic impacts of public investments in the production and maintenance of virus-tested foundation vine stocks and the distribution of propagative units derived thereof from 2006 to 2019 with regard to the management efforts of GLRD, by focusing on the NCPN-grapes center at FPS in Davis, CA. Our cost-benefit analyses suggested cumulative statewide benefits of $3,307.46 million (in 2019 dollars) by 2019 under the most probable disease scenario (i.e., when GLRD causes a 20% initial infection rate with a 25% yield reduction and no price penalty for reduced fruit quality). At the same time, estimated costs to operate FPS, the main NCPN-grapes center supplying clean material to nurseries and growers, totaled about $34.36 million by 2019 (in 2019 dollars). These results indicated a benefit-cost ratio of 96:1 by 2019. When employing a conservative disease scenario (i.e., 5% initial infection rate), the estimated benefit-cost ratio is still high, at 22:1 by 2019. These results are consistent with previous studies on public investment in agricultural research (Heisey and Fuglie, Reference Heisey and Fuglie2007).
Our welfare analysis indicated that grape growers and nurseries capture most of the surplus (net benefits) from planting certified, clean vines derived from virus-tested vine stock, ranging from $454.18 to $3,208.92 million (in 2019 dollars) by 2019, depending on supply and demand elasticities, as well as on disease scenarios. Nonetheless, some benefits go to winemakers and the downstream wine supply chain. These findings suggest strong incentives for grape growers to adopt certified, clean vines, as they realize most of the economic benefits from planting clean vines. Similarly, grape buyers are encouraged to work with vineyard managers to adopt clean vines because they also obtain substantial economic benefits when growers plant certified, clean vines derived from virus-tested vine stocks, though their portion is relatively small compared to that of grape growers.
Our study underscores the benefits of adopting certified, clean vines derived from virus-tested foundation vine stock for managing a single virus disease, that is, GLRD, which is one of the most prominent virus diseases affecting grape production across the United States and the world (Naidu et al., Reference Naidu, Rowhani, Fuchs, Golino and Martelli2014). Considering other diseases such as grapevine red blotch disease (Cieniewicz, Perry, and Fuchs, Reference Cieniewicz, Perry, Fuchs and Meng2017) or Pierce's disease would have likely increased the estimated economic benefits of FPS. Similarly, other NPCN-grapes centers, such as the Clean Plant Center Northwest in Prosser, Washington, the Midwest Grape Tissue Culture and Virus-Testing Center in Mountain Grove, Missouri, and the Northeast Clean Plant Center at Cornell University in Geneva, New York, could bring substantial economic benefits to the growers and winemakers too. For example, simply eliminating GLRD in the Finger Lakes region alone can raise a vineyard's net returns from $9,693 to $16,014 per hectare over the 25-year life of a vineyard (Gómez et al., Reference Gómez, Atallah, Martinson, Fuchs and White2010).
Our study offers insights into the importance of an NCPN-grapes center in providing virus-tested propagative material that benefits all participants in the grapevine supply chain system. Our results suggest that returns to public and private investments in support of NCPN centers such as FPS are large. Public funding to operate NCPN centers is essential to help cover upfront fixed costs (e.g., equipment, supplies, facilities, and staff, including scientists) and to ensure that virus-tested propagative material is available to nurseries and growers nationwide. NCPN centers may theoretically become more self-supportive if enough virus-tested propagative material is widely distributed across nurseries and purchased by wine grape growers. However, continued public investments are essential to ensure that the production and distribution of high-quality and affordable clean vines remain fully transparent.
Additionally, public investments in NCPN centers are paramount to continue warranting a system of checks and balances that an exclusively privately funded program would not provide. Finally, public investments are also crucial, not only for the sustained production and distribution of virus-tested grape budwood (for scions) and cuttings (for rootstocks) at NCPN centers but also for the repository of a wide range of clean accessions at foundation vineyards. These assets are indispensable to minimize the introduction of detrimental and costly viruses and virus-like diseases into commercial vineyards.
We acknowledge the limitations of our research. For example, we assumed averages across a diverse group of growers, regions, and markets in California to focus on a representative vineyard for analysis. Although effective, this approach cleared some of the subtle regional differences. Specifically, a limitation of the study is that we assumed the economic impact of GLRD in the NSJV is similar to the impact of this disease in other California wine regions, including Mendocino County to the north or the Central Coast to the south, because there was no research on the impact of the disease on these regions at the onset of our study. Future research could focus on these grape-growing regions once economic impact data are available to conduct nuanced assessments of FPS impacts. Similarly, by using parameters for a single main Vitis vinifera cv. Cabernet Sauvignon, our model may understate or overstate the economic impact of GLRD, depending on how similar or dissimilar GLRD impacts are on other cultivars relative to the one studied. Continued work on the varying ecological, biological, and production factors related to GLRD, particularly its spread, could change annual net income estimates and, ultimately, total benefits in assessing the impact of the FPS. Thus, our study should be refined to address these issues.
Another limitation is that we assume growers use profit-maximizing control strategies (i.e., roguing diseased vines and replacing them with FPS propagation material screened for GLRD). Future research could examine to what extent this is a realistic assumption. Future research could also consider table and raisin grapes when the economic impact data are available for these grape cultivars. Finally, future studies could target wine grape-growing regions beyond California, for example, Washington State, Oregon, or New York, and include other diseases to estimate the returns to public investment when relevant data are available. We anticipate total returns to be higher when the benefits from using propagation material derived from FPS virus-tested vine stocks in other wine regions beyond California are considered. Nonetheless, despite inherent variations, we await no qualitative change in total economic benefits because adopting certified, clean material outweighs the total cost of operating the NCPN-grapes center at FPS.
V. Conclusion
Our study examined the costs and benefits of using certified, clean vines derived from virus-tested foundation vine stocks produced and maintained at FPS, the major NCPN-grapes center, with regard to GLRD management in California. Returns to public investments in FPS ranged from 22:1 to 96:1 from 2006 to 2019, depending on the initial GLRD infection rate (5% or 20%, respectively) in the vineyard. These benefit-cost ratios of the public investment in a clean plant center for a single virus disease are considerable. Total economic returns would likely be more substantial if other wine grape-growing regions and other diseases were investigated. A welfare analysis revealed that growers and nurseries capture most of the economic benefits of planting material derived from virus-tested stocks relative to wineries. Our findings documented strong financial incentives for higher adoption of clean vines derived from virus-tested foundation stocks and continued financial support of NCPN-grapes centers.
Acknowledgments
We greatly appreciate the helpful comments from an anonymous reviewer and the kind advice from the editor, Dr. Karl Storchmann. The authors are also grateful to Carole Lamb, Foundation Plant Services, the California Department of Food and Agriculture, and California nurseries who contributed valuable information to this study.
Funding
This work was supported in part by USDA-APHIS-NCPN award 16-8130-0429-CA to Cornell University.


 Open access