


1 Introduction
This paper examines the phonetics of European Portuguese (hereafter EP) stress, using a nonce word experiment, building on previous research (Delgado-Martins Reference Delgado-Martins1982, Reference Delgado-Martins1986; d’Andrade & Viana 1989; Frota Reference Frota2000, Reference Frota and Sun-An2014).
Across languages, multiple acoustic measures may correlate with stress in vowels: stressed vowels can be realized with increased fundamental frequency (f0), increased intensity, and increased duration (Gordon & Roettger Reference Gordon and Roettger2017). Stressed vowels also tend to occupy a more peripheral vowel space than their unstressed counterparts, although there is a contrary effect observed in some languages whereby stressed vowels may be lower in the acoustic space than their unstressed counterparts (e.g. Garellek & White’s Reference Garellek and White2015 work on Tongan stress). In addition to acoustic cues, many phonological and morpho-phonological processes are potentially sensitive to stress. For example, vowel reduction is found in EP and many other languages (see Section 2.2).
For EP, I will show that duration functions as a significant acoustic measure for stress among the five cues examined (f0, F1, F2, intensity, and duration), agreeing with d’Andrade & Viana (1989).
A particular analytical challenge is that phonological processes influence the same acoustic properties that signal stress. Importantly, EP has a productive phonological neutralization in unstressed syllables that alters F1 and F2. For example, low vowels are raised to mid, mid vowels to high, and mid front vowels are also centralized (see Section 2.2). Consequently, comparing stressed and unstressed vowels for F1 and F2 requires factoring out the effects of these phonological changes. This study takes pains to control the phonological environment of the stimuli to block vowel reduction so stressed vowels and their unstressed counterparts can be directly compared. Factoring out phonological vowel neutralization, stressed and unstressed vowels do not differ in F1 and F2 for almost all the within-vowel comparisons.
Similarly, intonational pitch accents affect f0, meaning that it is non-trivial to factor out the effect of pitch accents on stressed–unstressed f0 (Roettger & Gordon Reference Roettger and Gordon2017). This study avoids this problem by focusing on speakers who do not assign distinct pitch accents to stressed syllables, and finds that for them f0 is not significantly different between stressed and unstressed vowels.
This article is organized as follows: Section 2 provides background on EP word-level stress. Section 3 discusses the methodology. Section 4 presents the results from acoustic measures. Section 5 offers a general discussion. Finally, section 6 concludes this paper.
2 Word-level stress in European Portuguese
2.1 Stress assignment
Some background on EP segments and morphology is necessary to understand stress assignment and the design of the experiment.
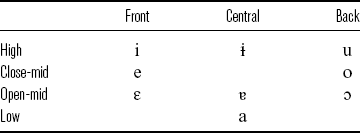
EP has nine oral vowels on the surface (Mateus & d’Andrade Reference Mateus and d’Andrade2000), as shown in Table 1. The distribution of the vowels is mainly conditioned by stress. Eight vowels [i e ɛ a ɐ o ɔ u] occur in stressed syllables, whereas four vowels [i i ɐ u] appear in unstressed syllables (See Section 2.2 on how unstressed vowels relate to stressed ones). Even though [ɐ] appears as a stressed vowel, its appearance in this context is very restricted and predictable (Mateus & d’Andrade Reference Mateus and d’Andrade2000). For that reason, Mateus & d’Andrade (Reference Mateus and d’Andrade2000) do not assume it to be an underlying vowel, but consider it derived. Nasal vowels are not discussed here as they are not relevant to this study.
Table 1 European Portuguese’s vowel inventory.
In EP, the location of word stress is unpredictable: it may fall within the last three syllables of the prosodic word, and it is lexically contrastive. However, most EP words are stressed on the penultimate syllable (Cruz-Ferreira Reference Cruz-Ferreira1995). Data from the FrePOP database (Frota et al. Reference Frota, Martins and Cruz2010), containing 1,486,092 prosodic words from spoken and written language, shows that 74% of words with two syllables or more are stressed on the penultimate syllable, 23% of words are stressed on the final syllable, and 2% of words have stress on the antepenultimate syllable.
Stress assignment is also argued to be influenced by the morphological structure of words (Vigário Reference Vigário2003, Castelo Reference Castelo, Frota, Vigário and João Freitas2005). For example, in the noun system, primary stress falls either on the last vowel of the derivational stem (the unmarked pattern) or on the penultimate vowel of this domain whenever the last vowel is lexically marked as unstressed (the marked pattern). However, Garcia (Reference Garcia2017) argues that there is no compelling argument for morphological influence on non-verb stress.
Portuguese verbs can be placed into three classes (referred to as conjugations) according to the theme vowels in their infinitive ending: -ar (first conjugation), -er (second conjugation), and -ir (third conjugation). Each of these conjugations defines an inflectional paradigm. The verb is formed from a root morpheme, to which a theme vowel is added to form a stem. A tense/mood/aspect morpheme (which may be null) follows the theme vowel, and a person/number morpheme (which may be null as well) is added finally. In the present indicative and subjunctive verb forms, the theme vowel of the verbal forms is obligatorily deleted when followed by another vowel (Vigário Reference Vigário2003 and references therein).Footnote 1 When a verb is in its uninflected infinitive form, stress always falls on the last syllable of the word, as in (1).
![]()
Crucially, in the present tense, stress always falls on the penultimate syllable of the verb form, which may correspond to the last vowel of the verbal root, to the theme vowel, or to the mood marker (Vigário Reference Vigário2003). The paradigm for the verb falar ‘to speak’ in present tense is provided in (2).Footnote 2

As we will see below, verbs with penultimate stress (present tense) and final stress (infinitive form) are essential in the design of the nonce word experiment. The stress alternation allows direct comparison of penultimate vowels in both stressed and unstressed states.
The existence of secondary stress is under debate. Cruz-Ferreira (Reference Cruz-Ferreira1995) reports that secondary stress is shown only with diphthongs. That is, syllables with diphthongs not bearing primary stress are assigned a secondary stress, e.g. [ˌau.ˈtẽ.ti.ku] ‘authentic’. Castelo (Reference Castelo, Frota, Vigário and João Freitas2005) claims that secondary stress can be observed in compounds, which corresponds to the primary stress of the compound’s internal word – for example, in abre-latas ‘can opener’, the primary stress of the word abre becomes a secondary stress. In this study, diphthongs and compounds are excluded from the nonce word experiment so there is no potential influence from secondary stress.
2.2 Vowel reduction
In EP, vowels undergo reduction in unstressed positions. Most recent studies report the reduction pattern shown in Table 2 (Mateus & d’Andrade Reference Mateus and d’Andrade2000, Vigário Reference Vigário2003, Castelo Reference Castelo, Frota, Vigário and João Freitas2005, Correia et al. Reference Correia, Butler, Vigário and Frota2015).Footnote 3 That is, the mid front vowels [e ɛ] are neutralized to [ɨ], the mid back vowels [o ɔ] are reduced to [u], the low vowel [a] is raised to [ɐ], and the high vowels [i u] remain unreduced in unstressed positions. Unlike Brazilian Portuguese, the reduction pattern in EP is identical in pre- and post-tonic positions (Mateus & d’Andrade Reference Mateus and d’Andrade2000). Moreover, vowel reduction is not affected by the presence of word-initial non-primary stress or emphatic stress (Vigário Reference Vigário2003).
Table 2 Vowels in stressed and unstressed positions (data from Correia et al. Reference Correia, Butler, Vigário and Frota2015).

There are many irregular exceptions to vowel reduction. The same underlying vowel may appear reduced or unreduced in morphologically and semantically related words (Vigário Reference Vigário2003). For example, compare the second unstressed vowels in the pair: [i.kɔ.nu.ˈmi.ɐ] ‘economy’ vs. [i.ku.ˈnɔ.mi.ku] ‘cheap’. Some exceptions are claimed to result from historical factors: e.g. [ĩ.va.ˈzoɾ] ‘invader’ (Mateus & d’Andrade Reference Mateus and d’Andrade2000). Together, this suggests that the non-application of vowel reduction has to be lexically marked for specific words.
Except for the irregular cases, vowel reduction is regularly blocked in a number of contexts, relating to syllable structure, the position of the syllable within the word, and morphological information (Vigário Reference Vigário2003 and references therein). In particular, vowel reduction systematically does not apply or is incomplete in absolute prosodic word-initial position. Though there is great dialectal and interspeaker variation, the introspection data provided in Vigário (Reference Vigário2003) suggests that /e ɛ o ɔ/ are either unreduced or undergo one degree raising, as shown by the example [e.ˈʀaɾ]∼[i.ˈʀaɾ] ‘to fail’ (compare [ˈe.ʀu] ‘mistake’).
Central to the experiment is the syllable structure. Crucially, syllable-final sonorants [ɫ j w] block the reduction of tautosyllabic vowels (Brakel Reference Brakel1985, Mateus & d’Andrade Reference Mateus and d’Andrade2000, Vigário Reference Vigário2003), as in (3a).

Syllable-final nasal [n] impedes the reduction of /e o/ (Brakel Reference Brakel1985). However, the examples used in Brakel (Reference Brakel1985), e.g. [kõn.ˈtaɾ] ‘to tell’, seem to indicate nasal vowels instead of true syllable-final nasals (also see Vigário Reference Vigário2003: 70 on nasal vowels). Word-final sonorants [ɫ ɾ n] are also reported to block vowel reduction (Vigário Reference Vigário2003), as in (3b).
Here I review the discussion of unstressed vowels in lateral-ending syllables, as this type of syllable is employed in the design of the experiment. For /e/ and /ɛ/, their distinction is neutralized in this position; only [ɛ] surfaces in the output: e.g. [dɛɫ.ˈɡa.du] ‘thin’ (Vigário Reference Vigário2003: 86). However, I found no data with the alternation from stressed [e] to unstressed [ɛ] in the description. For /o/ and /ɔ/, they show some variability (Andrade Reference Andrade1980, cited in Vigário Reference Vigário2003: 368). First, the reduction of /o/ is blocked and surfaces as [o], as shown in [ˈsoɫ.tɐ] ‘(he) sets free’ and [soɫ.ˈtaɾ] ‘to set free’. Second, /ɔ/ can surface as [o] or [u] for some words, as in [i.moɫ.du.ˈɾaɾ]∼[i.muɫ.du.ˈɾaɾ] ‘to frame’ (compare [ˈmɔɫd] ‘mold’). For the four mid vowels, only /ɛ/ and /ɔ/ are included in this study (see Section 3.1). Thus, it is possible that unstressed /ɔ/ in lateral-ending syllables has different realizations (i.e. [ɔ], [o], or [u]) in the nonce word experiment. For unstressed vowels in final syllables closed by [ɾ], see the discussion in Vigário (Reference Vigário2003).
Finally, unstressed vowels [ɨ] and [u] are reported to frequently undergo deletion. Mateus & d’Andrade (Reference Mateus and d’Andrade2000) claim that [ɨ] is deleted in colloquial speech in most cases, e.g. [iˈziʒɨ]∼[iˈziʒ] and [pɾɨsiˈzɐ˜w˜]∼[pɾsiˈzɐ˜w˜]. Unstressed [u] is often deleted when it is in word-final position (e.g. [ʃˈtudu]∼[ʃˈtud]) or when it follows a labial (e.g. [funuluˈʒiɐ]∼[fnulˈʒiɐ]). Freitas (Reference Freitas, van Kampen and Baauw2004) also reports that neutralized vowels [ɨ] and [u] are often optionally deleted in spontaneous speech. Vigário (Reference Vigário2003, Reference Vigário2010) provides a detailed discussion of unstressed vowels in prosodic word-final position. For example, the deletion of [ɨ] in prosodic word-final position is obligatory, unless it bears a high boundary tone or a rising boundary tone under tonal crowding, or if followed by a stressed vowel, within a prosodic word group.
2.3 Phonetic realization of stress
Cross-linguistically, stress can be phonetically realized in a variety of ways (Gordon & Roettger Reference Gordon and Roettger2017). Stressed vowels can be realized with an excursion in fundamental frequency (f0), greater intensity, or increased duration. Other potential acoustic correlates of stress include spectral attributes such as an increased weighting in favor of higher frequencies and vocalic peripheralization (or centralization of unstressed vowels).
Evidence for stress correlates in EP comes from three sources: impressionistic descriptions, production experiments, and perception experiments.
In both EP impressionistic descriptions and production experiments, duration is reported to be the main acoustic cue for word stress. That is, stressed syllables are longer than unstressed syllables (d’Andrade & Viana 1989).
For f0, Silva (Reference Silva1997: 83) asserts that stress is clearly marked by an increase in pitch and volume; however, this is an impressionistic observation – no instrumental data is provided to support the claim. More generally, Correia et al. (Reference Correia, Frota, Butler and Vigário2013, Reference Correia, Butler, Vigário and Frota2015) observe that pitch has not been considered in EP production experiments as a potential correlate of word stress (though see their perception experiments below). The challenge in relating f0 to stress is that pitch accents may associate with stressed syllables in EP (Frota Reference Frota2000, Reference Frota and Sun-An2014). Pitch accents signal phrase-level prominence and are used to differentiate sentence types and pragmatic or discursive meanings (Frota Reference Frota2000, Reference Frota and Sun-An2014). In Standard EP, there is low co-variation between stress and pitch accent due to a sparse pitch accent distribution: less than 20% of prosodic words internal to the intonational phrase carry a pitch accent (Vigário & Frota Reference Vigário and Frota2003). In other words, not every stressed syllable gets a pitch accent, and stressed syllables tend to be accented almost always only when in the nuclear position. Due to the low co-variation between word stress and pitch accent, pitch variation seems not to be a robust cue for word stress in EP. Finally, it is not clear whether F1 and F2 play any roles in EP stress even though unstressed vowels undergo reduction (see Section 2.2).
Studies on stress perception can also give insight into the roles of acoustic cues in EP stress, though the cues for perception are not necessarily the same as the cues for production. Correia et al. (Reference Correia, Frota, Butler and Vigário2013, Reference Correia, Butler, Vigário and Frota2015) demonstrate that EP speakers show a stress ‘deafness’ effect when vowel reduction is absent. Using two different paradigms (an ABX discrimination task and a sequence recall task), EP speakers had significantly higher error rates in identifying stress contrast when duration alone, or duration and pitch accents, were present in the stimuli. In other words, suprasegmental cues alone are not enough for stress perception in EP. When vowel reduction was added in the stimuli, EP speakers were able to detect stress contrasts. Delgado-Martins (Reference Delgado-Martins1982, Reference Delgado-Martins1986) argues that duration, but not intensity, is the relevant cue for stress identification in EP.
The goal of the following experiment is to examine the acoustic correlates of stress in EP, from a production perspective. Therefore, duration, intensity, f0, F1, and F2 are the focus of this paper. Based on the discussion above, I hypothesize that duration signals stress while f0 and intensity do not.
3 Methodology
3.1 Experiment design
Three frame sentences were created to manipulate stress alternation, as in (4). For example, for /ʒɔɡaɾ/ ‘to play’:

While three sentences were elicited, only two were measured. For the first sentence, the target word was expected to be produced with focus effects because it is new information. Focus can bring with it special pitch accents and prosodic phrasing. Thus, to avoid the phonological influences of focus, only the nonce words in the second and third frame sentences were analyzed. The same frame sentences were used throughout the experiment to keep the prosodic location of the nonce words constant. The words in each frame sentence were also kept identical to avoid any potential emphasis effects. See Garellek & White (Reference Garellek and White2015) and Shih (Reference Shih2018) for the same method.
The sentences differed in terms of stress-influencing suffixes so that the same verb root could be observed with both stressed and unstressed vowels. Note that the verb in the first two sentences has stress on the penultimate syllable, whereas the uninflected infinitive verb in the third sentence has stress on the final syllable (see Section 2.1). Vowel reduction of /ɔ/→[u] occurred in the unstressed syllable.
Two sets of nonce words were constructed in consultation with one native speaker of EP. Disyllabic nonce words with the shape /CiCa/, /CuCa/, /CɛCa/, /CɔCa/, and /CaCa/ were used and treated as a verb in the experiment. Another set of disyllabic nonce words /CilCa/, /CulCa/, /CɛlCa/, /CɔlCa/, and /CalCa/ was also included in the same environment as verbs. The purpose of adding the lateral /l/ was to test whether participants used different acoustic cues for stress when vowel reduction was blocked (see Section 2.2). On consulting with the native speaker, it was found that there were native words containing the syllable shape /Cɛl/, /Col/, and /Cɔl/. In particular, the native speaker reported that most of these words contained the vowels /ɛ/ and /ɔ/. Therefore, words with the vowels /e/ and /o/ were excluded from this study. The vowel in the second syllable was restricted to /a/ so that all the stimuli belonged to the first conjugation (see Section 2.1).
Hence, stress alternated on the penultimate and final syllable: ![]() ∼
∼![]() and
and ![]() ∼
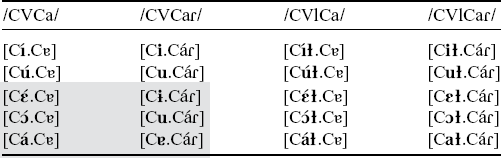
∼![]() . Each pair allowed direct comparison of vowels in both stressed and unstressed states. Note that words with the shape /CɛCa/, /CɔCa/, and /CaCa/ were excluded in the acoustic analyses because the stressed vowels and their unstressed counterparts were distinct in their quality, as shown in Table 3. Nonetheless, /CɛCa/, /CɔCa/, and /CaCa/ words were still included in the experiment for three reasons. First, the vowel quality of stressed and unstressed vowels allowed us to assess whether participants treated nonce words as native words. Second, the f0 patterns of /CɛCa/, /CɔCa/, and /CaCa/ words were compared with those of /CiCa/ and /CuCa/ words to check if there were any inconsistencies (see Section 4.3). Third, /CaCa/ words were used to determine whether f0 had an influence on vowel duration (see Section 4.4).
. Each pair allowed direct comparison of vowels in both stressed and unstressed states. Note that words with the shape /CɛCa/, /CɔCa/, and /CaCa/ were excluded in the acoustic analyses because the stressed vowels and their unstressed counterparts were distinct in their quality, as shown in Table 3. Nonetheless, /CɛCa/, /CɔCa/, and /CaCa/ words were still included in the experiment for three reasons. First, the vowel quality of stressed and unstressed vowels allowed us to assess whether participants treated nonce words as native words. Second, the f0 patterns of /CɛCa/, /CɔCa/, and /CaCa/ words were compared with those of /CiCa/ and /CuCa/ words to check if there were any inconsistencies (see Section 4.3). Third, /CaCa/ words were used to determine whether f0 had an influence on vowel duration (see Section 4.4).
Table 3 Vowel reduction patterns. Shading indicates words excluded in the acoustic analyses.
The initial consonants were limited to [p t k b d], while the second consonants were [p t k s f]. Except for the lateral /l/, the segmental content of /CVlCa/ words was identical to that of their /CVCa/ counterparts: e.g. /tɛpa/ and /tɛlpa/. All the consonants used in this experiment are admitted in word-initial (#_V) and word-medial (V_V) positions (Mateus & d’Andrade Reference Mateus and d’Andrade2000). Moreover, they are frequently attested in existing prosodic words in EP – i.e. they are not uncommon segments (Vigário, Frota & Martins Reference Vigário, Frota and Martins2011).Footnote 4 All the consonants were unaspirated in order to reduce influence on the following vowel’s duration (van Santen Reference van Santen1992). The second consonants were voiceless in order to keep influence on the preceding vowel’s duration relatively constant (Peterson & Lehiste Reference Peterson and Lehiste1960). For the first consonants, bilabials (i.e. /p/ and /b/) and alveolars (i.e. /t/ and /d/) were mainly used to keep the place of articulation relatively close; only one stimuli had /k/ as the initial consonant. Since the second consonants were required to be voiceless, two fricatives, [s] and [f], were included to allow for more combinations with the initial syllable. This stimulus structure not only facilitated identification of vowel boundaries but also minimized segmental effects on vowels (e.g. vowel lengthening before voiced consonants).
All the stimuli were created in accordance with the EP writing system. In particular, diacritics were not used on vowels, because participants might interpret them as marking stress. In the pilot study, the letters é and ó were adopted, with the hope that without explicit instructions, participants could produce [ɛ] and [ɔ] instead of [e] and [o] when these two vowels were stressed. However, the participants reported that the acute accent somehow forced them to maintain the same vowel quality even when these vowels were unstressed (i.e. in the third frame sentence). Thus, the participants were informed that the letters e and o always corresponded to [ɛ] and [ɔ] when stressed.
There were six stimuli for /CiCa/, /CuCa/, /CɛCa/, /CɔCa/, and /CaCa/ words. There were six stimuli for /CilCa/, /CulCa/, /CɛlCa/, /CɔlCa/, and /CalCa/ words. With two stress-alternating forms for each word type, there were 120 stimuli in the experiment. The final word list was further verified by two native speakers of EP to ensure that none of the words were native words. A full list of stimuli is provided in Appendix.
There were three recording sessions for each experiment. Ten common native verbs were employed as fillers to encourage the participants to speak in their vernacular speech style. Each verb had two stress-alternating forms (e.g. [ˈtapɐ] ‘(he) covers’ and [tɐˈpaɾ] ‘to cover’). These forms were placed in four colloquial filler sentences. Fillers were interspersed among the stimuli, with a spacing of 15 stimuli. Three fillers were introduced at the beginning of each session to take into account the effects of any initial nervousness the participant might have about the task. The order of the stimuli was pseudo-randomized and counter-balanced in each session. In sum, each participant produced 360 tokens for the experiment (5 vowels × 6 stimuli × 2 word shapes × 2 frame sentences × 3 repetitions).
3.2 Participants
Six male and two female native EP speakers participated in the experiment. Their ages ranged from 29 to 44 years old. Four participants (three males and one female) had lived in the United States for four years on average (male 1: five years, male 2: four years, male 3: three years, female 1: five years), and four participants (three males and one female) had lived in Taiwan for four years on average (male 4: three years, male 5: eight years, male 6: five years, female 2: two years). All the participants still communicated in EP with their family and friends on a daily basis. Three male participants (male 1, male 4, male 6) were from Lisbon, two female participants (female 1, female 2) were from Coimbra, and three male participants (male 2, male 3, male 5) were from Porto. Note that there is prosodic variation across the regions where participants come from (Frota et al. Reference Frota, Marisa Cruz, Gisela Collischonn, Serra, Oliveira, Vigário, Frota and Prieto2015 and references therein). For example, in the Northern variety of Braga not only are intonational phrases smaller but most phrase-internal prosodic words get a pitch accent (Vigário & Frota Reference Vigário and Frota2003). Thus, Porto speakers, which also belong to the Northern variety, are expected to show higher tonal density: more words within the sentence bear pitch accent than in Standard EP. See Section 4.3 for the discussion of different intonation groups. The participants were naïve as to the goal of the experiment, and none had any linguistic training or history of speech impairments. They received nominal monetary compensation for their participation.
3.3 Procedure
Three male participants and one female participant were recorded in a recording studio at the University of California, Santa Barbara in the summer of 2019, and the remaining participants were recorded in a quiet room at National Taiwan University in early 2021. The same recording devices were used in different locations to keep the recording condition constant. The participants were recorded while wearing a Shure SM35 head-worn microphone with behind-the-neck headband in order to keep the microphone at a constant distance from the mouth (thereby limiting inadvertent intensity variation). The participants were recorded using a Zoom H4n Pro at a 44.1k Hz sampling rate and 16-bit quantizing rate in mono. All the experiments were carried out by the author.
Prior to the experiment, participants were asked when they felt at their best – i.e. when they felt most alert and awake. The experiment sessions were scheduled based on their reports. Participants were asked to keep their usual daily routines for the day before the experiment.
Before the recording sessions began, a training session was provided to familiarize the participants with the task. Initially, the participants were provided with three native verbs and asked to produce the frame sentences. Next, the participants were presented with three nonce words and asked to repeat the same task. The three nonce words had /i/, /e/, and /o/, respectively. All the participants performed the expected conjugation for each verb and reported that they had no issues with the task.
Participants were presented with the first frame sentence (with the stimuli) on a computer screen. Participants had to generate the second and third frame sentences from memory during the experiment. The purpose was to ensure that the participants applied the correct vowel reduction pattern without any influences from the Latin letters. Participants received sufficient training in the training session and generated the three frame sentences with roughly 0.5-second intervals between them in the test phase.Footnote 5 Participants had to perform a proper verb conjugation based on the stimuli presented in the first frame sentence: e.g. [ˈbɔ.pɐ] and [bu.ˈpaɾ] for the nonce word bopam.
The recording sessions were conducted individually. Participants read the sentences when they were ready, at a normal conversational speed. Breaks were given after each recording session. The author had conversations with the participants during the breaks about the culture of Portugal and mundane daily activities. The author specifically asked the participants how to say certain words in EP, though the author is not a native speaker of EP. The goal was to ensure that the speech was generated using the participants’ vernacular L1 phonological modules (de Lacy Reference de Lacy and van der Hulst2014: 13–16). Participants completed the experiment in one day. The experiment was structured so that the potential effect of intra-speaker differences in separate sessions was minimized.
3.4 Measurements
Acoustic correlates of stressed and unstressed vowels were measured, including duration, f0, F1, F2, and intensity. Vowels were labeled using Praat TextGrids (Boersma & Weenink Reference Boersma and Weenink2020). Four intervals were labeled for each file: the extent of the first and second vowels of the target word in the second frame sentence, and the extent of the /Vl/ sequence and the second vowel of the target word in the third frame sentence.
The left boundary of each vowel was marked at the zero crossing of the first non-deformed periodic waveform. The right boundary was identified as the end of the second formant, with the help of the third formant when the end of the second formant continued into closure (Turk, Nakai & Sugahara Reference Turk, Nakai, Sugahara, Stefan Sudhoff, Roland Meyer, Petra Augurzky, Richter and Schließer2006). For /CVlCa/ words, the lateral was velarized, with clear formant structure. The boundary between the first vowel and the velarized lateral was less clear because the oral constriction was often absent and difficult to identify. Thus, the right boundary of the first vowel was extended to include the velarized lateral, with the end of the second formant as the boundary indicator. Moreover, it was found that the velarized lateral made the second formant of [i] and [ɛ] gradually lower toward the end. For F1 and F2, the one-fourth point of the /Vl/ interval was calculated in order to minimize the influences of the following velarized lateral (and the preceding consonant).
The segmentation was performed by the author and two well-trained undergraduate students. All audio files and TextGrids were further double-checked by the author and the undergraduate students after the segmentation was finished with the goal of minimizing human error. Cohen’s kappa was computed to assess the agreement between the author and the undergraduate students in evaluating the segmentation of the target vowels. There was substantial agreement between the author and the undergraduate student, who segmented the data from the participants who had lived in the United States, kappa = .66 (95% CI, .47–.86). There was almost perfect agreement between the author and the undergraduate student, who segmented the data from the participants who had lived in Taiwan, kappa = .80 (95% CI, .67–.92). Finally, the author examined the TextGrids and made corrections only when (i) wrong vowels were labeled, (ii) consonants were mislabeled as part of a vowel, and (iii) the right boundary of vowels was noted by the undergraduate assistants as uncertain; otherwise no changes were made.
The labeled sound files were then run through customized Praat scripts to obtain acoustic measures. Duration and mean intensity were extracted from the TextGrids. For f0, F1, and F2, the midpoint of each vowel was measured. The purpose was to identify the steady point of the vowel. The results were saved to a Microsoft Excel (.xlsx) file for subsequent analysis, though they were analyzed in R (R Core Team 2020).
3.5 Statistical methods
In the following sections, I determine whether each of the acoustic measures was a statistically significant correlate of stress in EP. The values of each measure were analyzed using linear mixed-effects models (following Garellek & White Reference Garellek and White2015 for Tongan stress, and Shih Reference Shih2018 for Gujarati stress). The acoustic measures (duration, f0, F1, F2, intensity) were the dependent variable. These were implemented in R using the lmer() function of the lme4 package (Bates et al. Reference Bates, Maechler, Bolker and Walker2015).
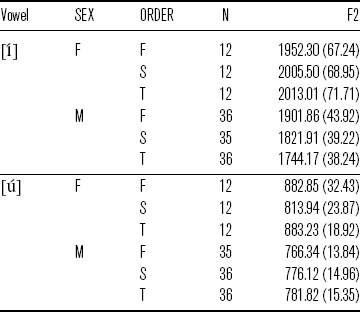
For the duration, intensity, F1, and F2 models, VOWEL (e.g. [í] in [Cí.Cɐ] vs. [i] in [Ci. Cáɾ]) and ORDER (first repetition, second repetition, third repetition) were set as fixed effects. For the F1 and F2 models, SEX (male and female) was included as a fixed effect. For the duration, F1, and F2 models for /CVCa/ words, two additional variables, POAC1 (the place of articulation of the first consonant: labial, coronal, dorsal) and POAC2 (the place of articulation of the second consonant: labial, coronal, dorsal), were included as fixed effects. For the duration, F1, and F2 models for /CVlCa/ words, one additional variable, POAC1, was included as a fixed effect; POAC2 was not included due to the existence of the syllable-final lateral. Note that for ![]() and
and ![]() words, the low vowel /a/ and the mid vowels /ɛ ɔ/ had distinct qualities in stressed and unstressed positions, so they were excluded in the analyses of F1, F2, duration, and intensity. For the f0 models, the f0s of all the vowels were included in the analyses to determine the overall intonation contour of the target words. Finally, SPEAKER and WORD were included as random effects for all the models. These random effects significantly improved model fit according to likelihood ratio tests comparing models with and without the effect (using the anova() function, see Baayen Reference Baayen2008), suggesting that there was indeed variation across individual speakers and words. However, by including these factors as random effects, we effectively controlled for any effect that they may have had on the results.
words, the low vowel /a/ and the mid vowels /ɛ ɔ/ had distinct qualities in stressed and unstressed positions, so they were excluded in the analyses of F1, F2, duration, and intensity. For the f0 models, the f0s of all the vowels were included in the analyses to determine the overall intonation contour of the target words. Finally, SPEAKER and WORD were included as random effects for all the models. These random effects significantly improved model fit according to likelihood ratio tests comparing models with and without the effect (using the anova() function, see Baayen Reference Baayen2008), suggesting that there was indeed variation across individual speakers and words. However, by including these factors as random effects, we effectively controlled for any effect that they may have had on the results.
Interaction between the fixed effects was tested in the model by using the anova() function mentioned above to compare likelihood between models. Random slopes for the by-speaker and by-word effects of the fixed effects were specified for each model (Barr et al. Reference Barr, Levy, Scheepers and Tily2013), and likelihood ratio tests were run to evaluate the models. The basis for removing factors was set at a p-value of the likelihood ratio test of p < .05. When the random slope models failed to converge, the next-best models were chosen by using the likelihood-ratio test mentioned above. Visual inspection of residual plots did not reveal any obvious deviations from homoscedasticity or normality. Crucially, I report multiple pairwise comparisons for the target vowels, which is obtained using the pairwise() function of the emmeans package (Lenth Reference Lenth2020). These estimates were based on the Tukey Honestly Significant Difference (Tukey HSD) method. I report t-values as well as p-values provided in the model output.
4 Results
4.1 F1 and F2
This section explores whether F1 and F2 make a distinction between stressed and unstressed vowels in /CVCV/ and /CVlCV/ words. To achieve this, stressed and unstressed vowels are compared under the condition that unstressed vowels do not undergo reduction.
4.1.1  and words
Recall that the first vowel in ![]() words should be stressed while the first vowel in
words should be stressed while the first vowel in ![]() words should be unstressed. If unstressed vowels show phonetic vowel reduction, their quality (F1 and F2) should be different from their stressed counterparts. Figure 1 shows the vowel plot for the stressed and unstressed high vowels.
words should be unstressed. If unstressed vowels show phonetic vowel reduction, their quality (F1 and F2) should be different from their stressed counterparts. Figure 1 shows the vowel plot for the stressed and unstressed high vowels.
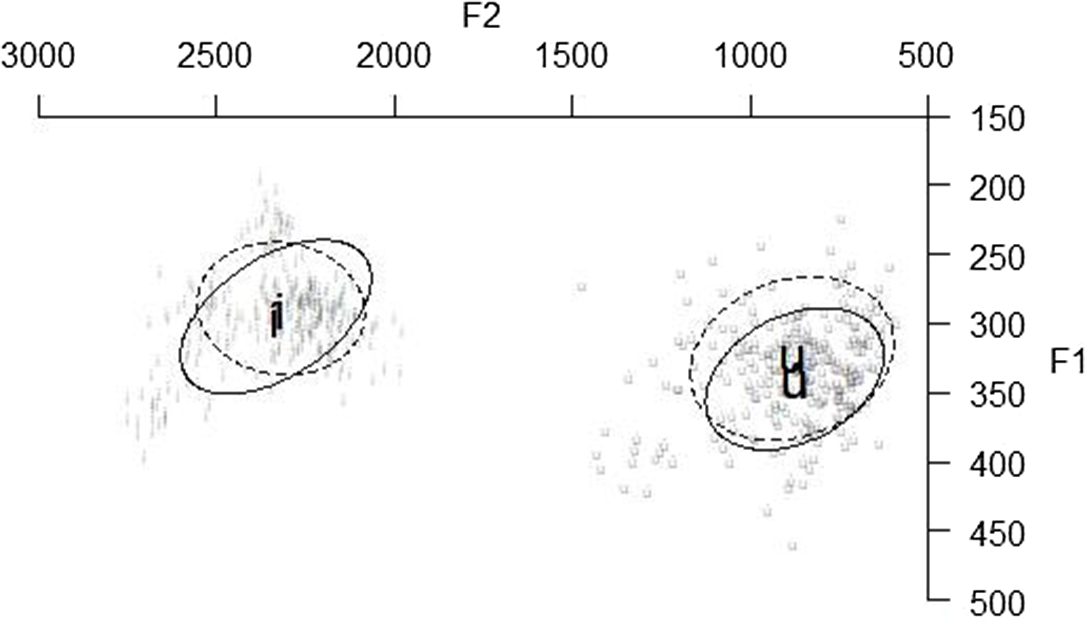
Figure 1 Vowel plot for the first vowel in ![]() (solid circles) and
(solid circles) and ![]() (dashed circles) words. The ellipsis delineates one standard deviation from the mean value.
(dashed circles) words. The ellipsis delineates one standard deviation from the mean value.
The F1 model for ![]() and
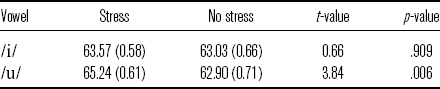
and ![]() words is summarized in (5). As shown in Table 4, unstressed high vowels have the same height as their stressed counterparts. In every table below, all figures are rounded to two decimal places, except for p-values, which are rounded to three decimal places.
words is summarized in (5). As shown in Table 4, unstressed high vowels have the same height as their stressed counterparts. In every table below, all figures are rounded to two decimal places, except for p-values, which are rounded to three decimal places.
Table 4 Mean F1 (in Hz; standard errors in parentheses) for vowels with stress and no stress in ![]() and
and ![]() words.
words.
![]()
For F2, it was found that a three-way interaction between VOWEL, POAC1, and SEX significantly improved the model fit, as summarized in (6).
![]()
The interaction term suggests that the influence of sex and preceding consonants varies across vowels, as shown in Table 5. For example, [í] preceded by a coronal has a similar F2 value compared with [í] preceded by a labial. This pattern is consistent among male and female participants. However, [ú] preceded by a coronal is more fronted than [ú] preceded by a labial. Notably, the difference for female participants is greater (262.05 Hz) than that for male participants (202.14 Hz).
Table 5 Mean F2 (in Hz; standard errors in parentheses) for [í] and [ú] by SEX (F = female, M = male) and POAC1 (C = coronal, D = dorsal, L = labial).
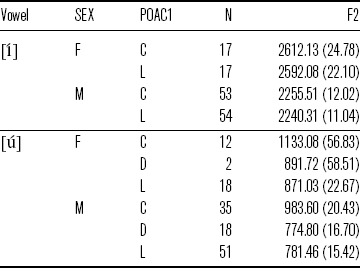
Crucially, both [i] and [u] consistently have the same backness as their stressed counterparts in different conditions, as illustrated in Table 6.
Table 6 Mean F2 (in Hz; standard errors in parentheses) for vowels with stress and no stress in ![]() and
and ![]() words by SEX (F = female, M = male) and POAC1 (C = coronal, D = dorsal, L = labial).
words by SEX (F = female, M = male) and POAC1 (C = coronal, D = dorsal, L = labial).
In summary, the F1/F2 results indicate that there is no phonetic vowel reduction for high vowels in ![]() and
and ![]() words.
words.
4.1.2 and words
It is not possible to compare F1 and F2 for non-high vowels using ![]() and
and ![]() words because the vowels undergo phonological neutralization when unstressed. However, recall that phonological vowel reduction is expected to be blocked when the syllable ends with a lateral, with the possibility that /ɔ/ might surface as [ɔ], [o], or [u] in some words (see Section 2.2). Hence, the comparisons between stressed vowels and their unstressed counterparts in
words because the vowels undergo phonological neutralization when unstressed. However, recall that phonological vowel reduction is expected to be blocked when the syllable ends with a lateral, with the possibility that /ɔ/ might surface as [ɔ], [o], or [u] in some words (see Section 2.2). Hence, the comparisons between stressed vowels and their unstressed counterparts in ![]() and
and ![]() words allow us to determine whether there is phonetic vowel reduction – i.e. centralization. Figure 2 shows the vowel plot for the stressed vowels and their unstressed counterparts.
words allow us to determine whether there is phonetic vowel reduction – i.e. centralization. Figure 2 shows the vowel plot for the stressed vowels and their unstressed counterparts.
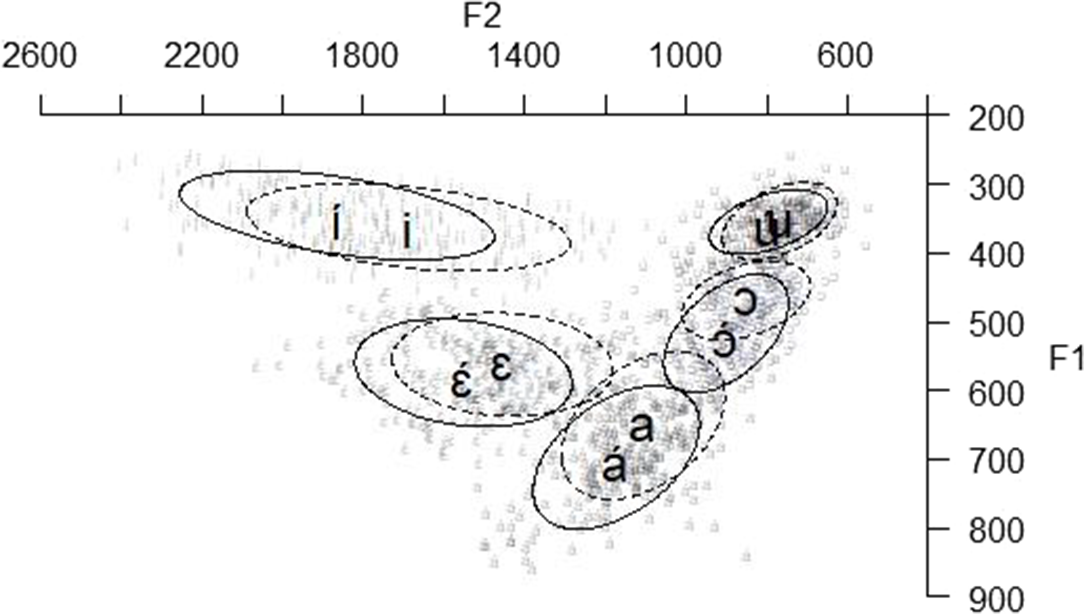
Figure 2 Vowel plot for the first vowel in ![]() (solid circles) and
(solid circles) and ![]() (dashed circles) words. The ellipsis delineates one standard deviation from the mean value.
(dashed circles) words. The ellipsis delineates one standard deviation from the mean value.
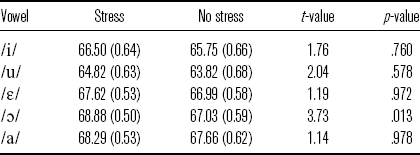
The F1 model is summarized in (7). As with the ![]() and
and ![]() comparison, unstressed high vowels were found to have the same height as their stressed counterparts, and mid vowels show the same pattern (see Table 7).
comparison, unstressed high vowels were found to have the same height as their stressed counterparts, and mid vowels show the same pattern (see Table 7).
Table 7 Mean F1 (in Hz; standard errors in parentheses) for vowels with stress and no stress in ![]() and
and ![]() words.
words.
![]()
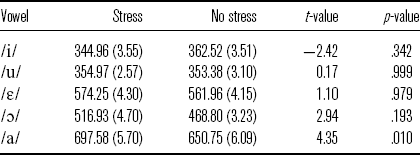
The unstressed low vowel is significantly higher than its stressed counterpart. However, the unstressed low vowel is significantly lower than the stressed and unstressed mid vowels (t = 6.56, p < .001 for [a] vs. [ɛ́]; t = 5.579, p = .003 for [a] vs. [ɛ]; t = 6.45, p = .001 for [a] vs. [ɔ́]; t = 9.542, p < .001 for [a] vs. [ɔ]). This suggests that the unstressed low vowel is raised but still lowered than the mid vowels.
At first glance, this finding seems to be similar to Oh’s (Reference Oh2021) study of Brazilian Portuguese. Oh examines the phonetic and phonological status of vowel reduction in Brazilian Portuguese by testing the influence of duration on the realization of /a/ in five prosodic positions: word-initial pretonic, word-medial pretonic, tonic, word-medial posttonic, and word-final posttonic. The results revealed that, while both phonetic duration and prosodic position had effects on F1 values for /a/, the categorical effect of prosodic position was much stronger and more reliable. In particular, F1 values for /a/ were best predicted by a two-way distinction between posttonic and non-posttonic syllable positions. Correlations between a vowel’s duration and its F1 frequency were statistically significant but generally weak in all positions. Based on the findings, Oh argues that vowel reduction in Brazilian Portuguese primarily reflects phonological patterning rather than phonetic undershoot, although there was also evidence for some amount of undershoot.
In this study, it is not clear that the lower F1 of unstressed [a] is a result of the low vowel’s duration. As I will show in Section 4.4, [a] is indeed shorter than [á] in all the duration groups even though the durational difference is not statistically significant in Group 3 and Group 4. Note that participants were placed into different groups based on their f0 patterns (see Section 4.3). However, this centralization effect is not seen for mid vowels. In particular, the mid vowel /ɔ/ has a similar duration pattern compared with the low vowel /a/: [ɔ] is shorter than [ɔ́] in all groups even if the durational difference is not statistically significant in Group 3 and Group 4. Even so, unstressed mid vowels do not have a reduced vowel space compared with their stressed counterparts. On the other hand, there are studies showing that a reduced vowel space is not a necessary result of phonetic undershoot. For example, Shih (Reference Shih2018) found that unstressed [a] is significantly more centralized than stressed [a] in Gujarati, and this pattern persists even when phrase-final lengthening adds extra duration to the unstressed [a].
Another possible source for the F1 lowering effect is co-articulation with surrounding consonants with a coronal primary or secondary articulation. Gordon & Applebaum (Reference Gordon and Applebaum2010) argue that in Turkish Kabardian, the unstressed schwa is raised because [s] precedes the target schwa in the root [bəsəm] ‘host’. The tongue is raised for the coronal, and must lower to assume the canonical position for schwa. Therefore, Gordon & Applebaum conclude that changes in vowel quality in Turkish Kabardian do not function as cues for stress. To assess this possibility, an unpaired t-test analysis was performed to determine whether unstressed [a] has a lower F1 when the onset is a coronal, rather than a labial (i.e. [a] with a coronal onset: 605.08 Hz (SD = 70.12); [a] with a labial onset: 622.03 Hz (SD = 84.5)). Note that the coda is always [ɫ], so it was excluded from the analysis. The result shows that there is no significant difference between [a]’s F1 with different onsets: t(135) = 1.23, p = .219. Therefore, the possibility that the F1 lowering of [a] is due to co-articulation with adjacent coronal consonants is excluded.
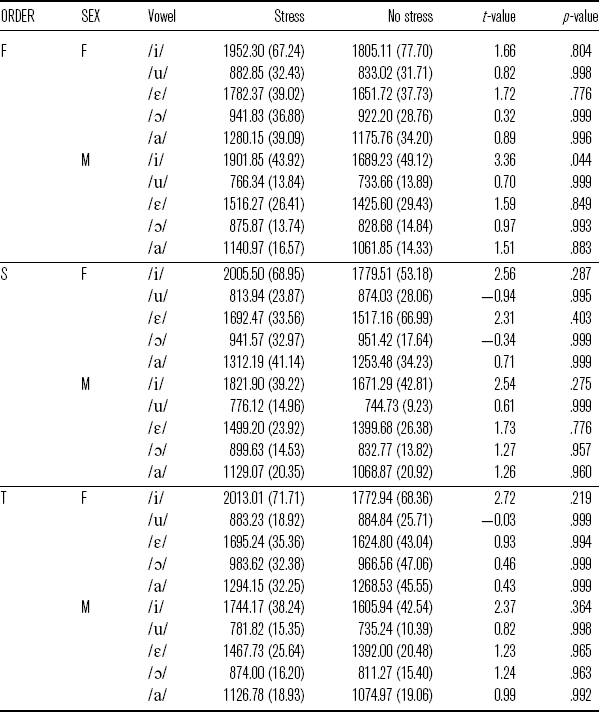
For F2, it was found that a three-way interaction between VOWEL, ORDER, and SEX significantly improved the model fit, as summarized in (8).
![]()
The interaction term suggests that the influence of sex and repetition order varies across vowels. For example, [í] has different F2 values in different conditions, as shown in Table 8. That is, [í] is more and more fronted toward the third repetition for female participants. In contrast, [í] is more and more back toward the third repetition for male participants. On the other hand, [ú] in the second repetition is more back than that in the first and third repetitions for female participants. However, [ú] is more and more front toward the third repetition for male participants. This subject is not pursued further here, and the comparisons below are on vowels in the same condition.
Table 8 Mean F2 (in Hz; standard errors in parentheses) for [í] and [ú] by SEX (F = female, M = male) and ORDER (F = first repetition, S = second repetition, T = third repetition).
The multiple pairwise comparisons in Table 9 show no significant differences for the stressed and unstressed vowels in all the repetitions, though the statistical difference between [í] and [i] for male participants is borderline in the first repetition. Note that female participants have a more fronted vowel space than male participants do.
Table 9 Mean F2 (in Hz; standard errors in parentheses) for vowels with stress and no stress in ![]() and
and ![]() words by ORDER (F = first repetition, S = second repetition, T = third repetition) and SEX (F = female, M = male).
words by ORDER (F = first repetition, S = second repetition, T = third repetition) and SEX (F = female, M = male).
Notice that the front vowels have a wider F2 distribution than other vowels, given their relatively larger standard errors. This is due to the influence of the velarized lateral [ɫ]: the second formant of the target vowel is gradually lowered toward the velarized lateral. This F2 lowering effect is particularly remarkable for the front vowels because they have high F2 values. Even though the measuring point for F2 is at the one-fourth point of the /Vl/ sequence (see Section 3.4), the exact starting point of the lowering effect varies token by token. See Andrade (Reference Andrade1999) for similar findings.
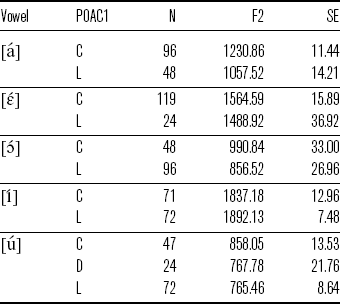
F2 was also found to be influenced by POAC1. Specifically, vowels preceded by a coronal are significantly more fronted than vowels preceded by a labial (t = 2.9, p = .014). Presumably, the coronal onset causes the vowels to be more fronted. As shown in Table 10, stressed vowels generally have a higher F2 value when the preceding consonant is a coronal. However, this effect is not clearly seen for [í]. It is possible that the tongue position is already close to the coronal region for [í], so the fronting effect is attenuated. It would be more revealing if a three-way place contrast is there for the central vowel [a]. I leave this issue for future investigation.
Table 10 The influences of POAC1 (C = coronal, D = dorsal, L = labial) on F2 (in Hz).
In short, the F1/F2 results show that [á] and [a] differ significantly in terms of mean F1. However, there is no F1 distinction for any other vowel. F2 is not relevant for stress.
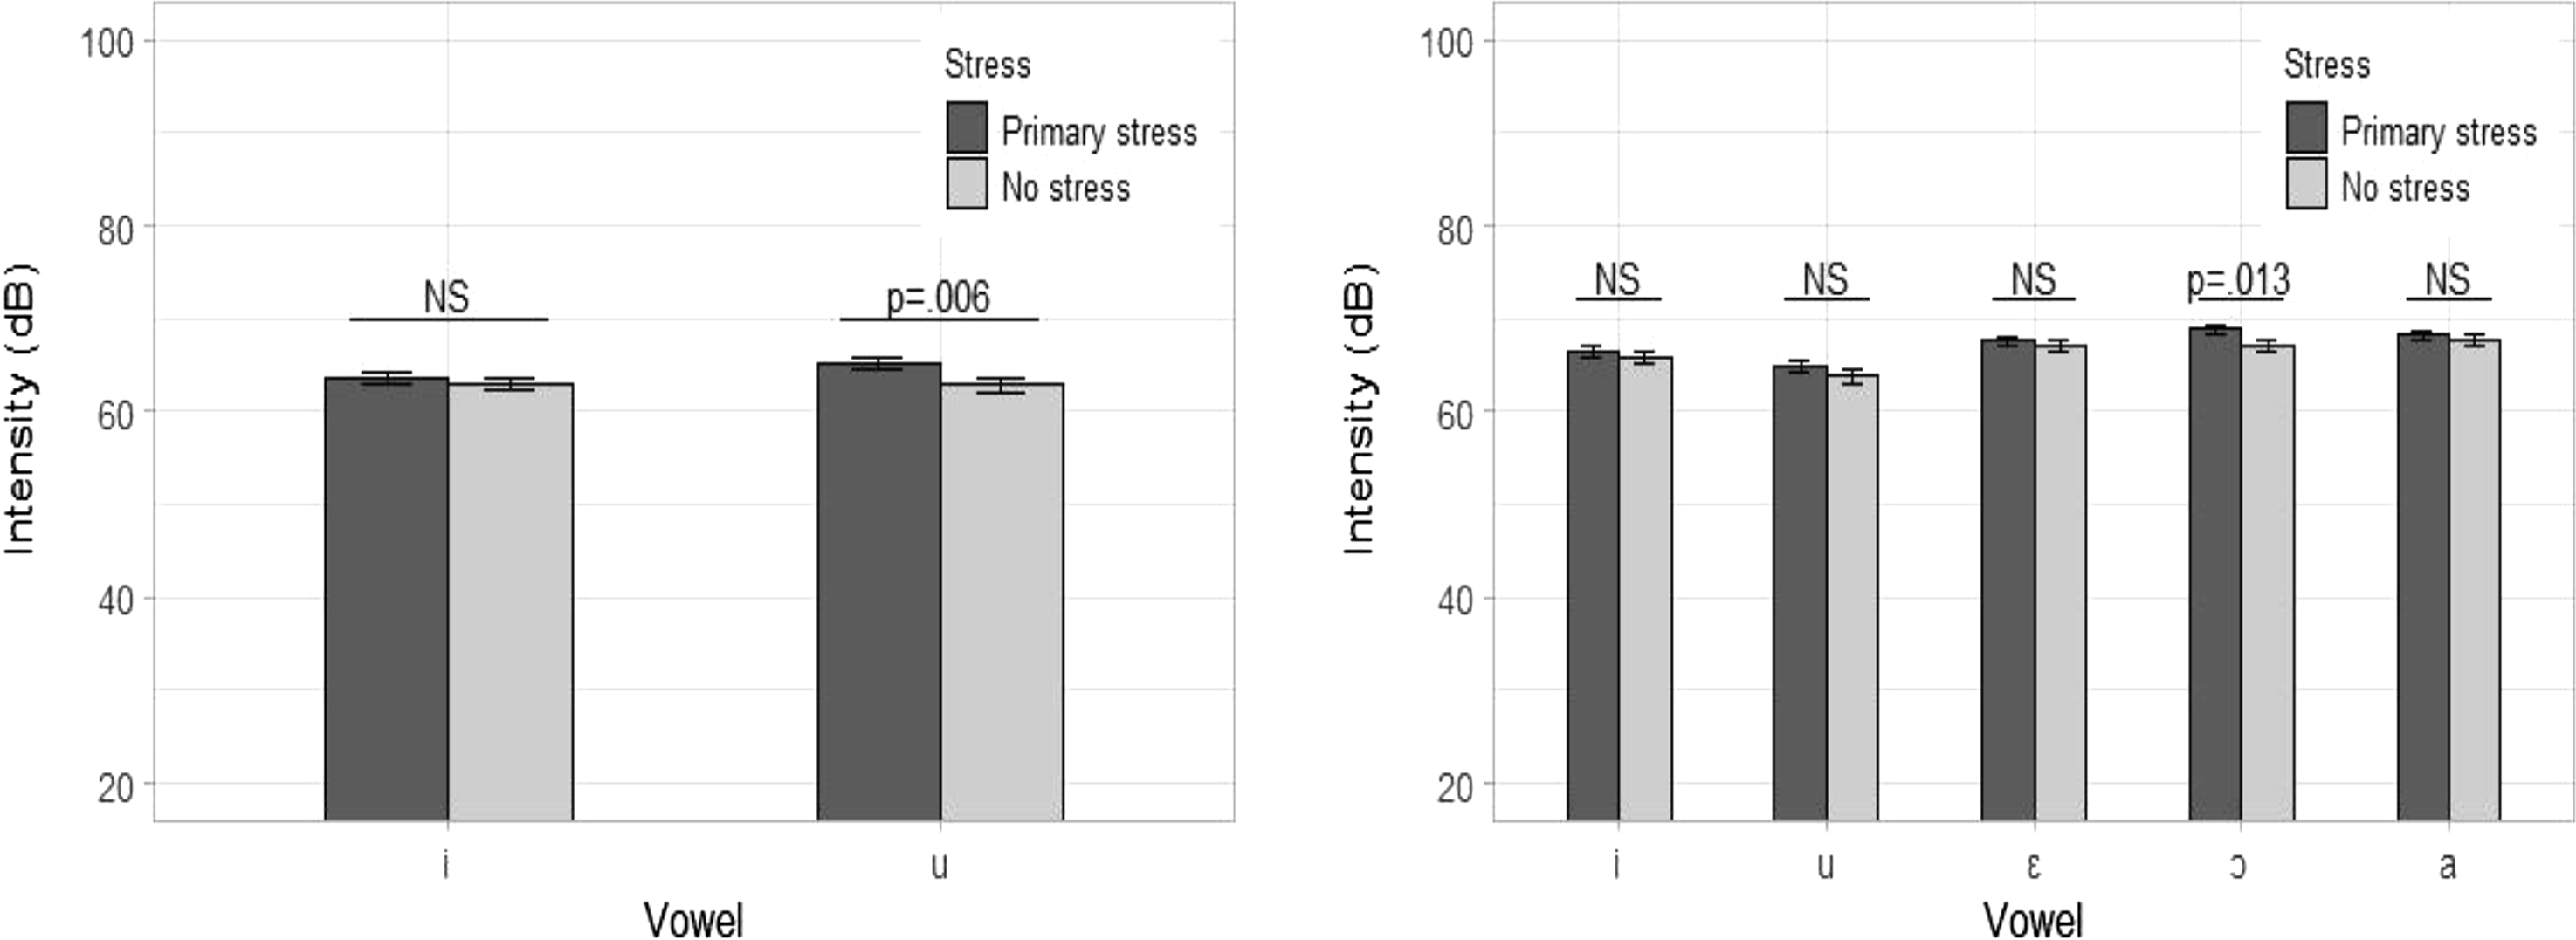
Figure 3 Mean intensity by vowel, for ![]() ∼
∼![]() (left panel) and
(left panel) and ![]() ∼
∼![]() (right panel). Error bars represent standard error of the mean.
(right panel). Error bars represent standard error of the mean.
4.2 Intensity
This section explores whether stressed and unstressed vowels are distinguished by intensity. Figure 3 presents the mean intensity values for the target vowels.
According to the hypothesis (see Section 2.3), intensity does not serve a cue for stress. On this prediction, the first vowels in ![]() and
and ![]() words should not be distinguished by intensity when they have the same vowel quality.
words should not be distinguished by intensity when they have the same vowel quality.
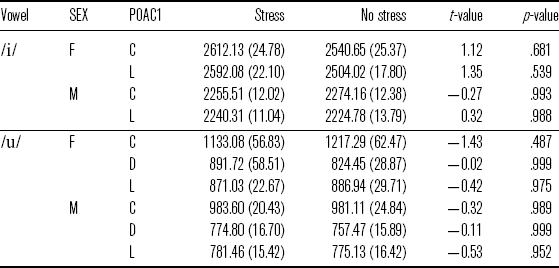
The intensity model for ![]() and
and ![]() words is summarized in (9). The intensity pattern of /i/ in different contexts supports the hypothesis: there is no significant intensity difference between [í] and [i], as shown in Table 11. If intensity is a correlate of stress, [í] is expected to have a higher intensity value than [i]. However, this is not the case.
words is summarized in (9). The intensity pattern of /i/ in different contexts supports the hypothesis: there is no significant intensity difference between [í] and [i], as shown in Table 11. If intensity is a correlate of stress, [í] is expected to have a higher intensity value than [i]. However, this is not the case.
![]()
Table 11 Mean intensity (in dB; standard errors in parentheses) for vowels with stress and no stress in ![]() and
and ![]() words.
words.
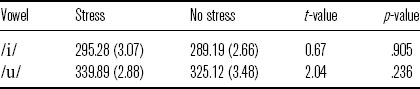
The results for [u] seem to be inconsistent with the hypothesis: [ú] has a higher intensity value than [u]. It is possible that [u] is weak in its nature. Recall that [u] is reported to be frequently deleted (e.g. Mateus & d’Andrade Reference Mateus and d’Andrade2000), suggesting that [u] is very reduced so it is subject to deletion. In this study, [u] has the lowest intensity among all the unstressed vowels ([u]: 62.9 dB (SE = 0.71); [ɨ]: 65.5 dB (SE = 1.06); [ɐ]: 66.76 dB (SE = 0.62); [i]: 63.03 dB (SE = 0.66); [u] (reduced from /ɔ/: 63.25 (SE = 0.79))). Moreover, the just noticeable difference (JND) in sound intensity for the human ear is about 1 dB (Harris Reference Harris1963). It is possible that the intensity difference between [ú] and [u] is perceptually significant, given the mean and standard deviation for the pair ([ú]: 65.24 dB (SD = 7.38); [u]: 62.9 dB (SD = 8.17)). To confirm this, 104 pairs where [ú] has a higher intensity value than [u] were extracted from the data to calculate the average intensity difference. The average intensity difference is 3 dB.
Intensity is also influenced by ORDER. Vowels in the first repetition have the highest intensity, followed by vowels in the third repetition, and lastly by vowels in the second repetition (first repetition: 64.19 dB (SE = 0.55); second repetition: 63.39 dB (SE = 0.58); third repetition: 63.53 dB (SE = 0.54)). No statistical distinctions were found between the first and second repetitions (t = 0.84, p = .688), the second and third repetitions (t = −0.13, p = .99), or the first and third repetitions (t = 0.76, p = .735). It is likely that participants decreased their intensity due to the fatigue after the first repetition.
The intensity model for ![]() and
and ![]() words is summarized in (10). If stress is not distinguished by intensity, the first vowels in
words is summarized in (10). If stress is not distinguished by intensity, the first vowels in ![]() and
and ![]() words should show no intensity difference. Results from the multiple pairwise comparisons support the hypothesis. Except for the pair [ɔ́] vs. [ɔ], none of the comparisons reach statistical significance, as shown in Table 12.
words should show no intensity difference. Results from the multiple pairwise comparisons support the hypothesis. Except for the pair [ɔ́] vs. [ɔ], none of the comparisons reach statistical significance, as shown in Table 12.
Table 12 Mean intensity (in dB; standard errors in parentheses) for vowels with stress and no stress in ![]() and
and ![]() words.
words.
![]()
To check if the intensity difference between [ɔ́] and [ɔ] is perceptually significant, 116 pairs where [ɔ́] has a higher intensity value than [ɔ] were extracted from the data to calculate the average intensity difference. The result, 2.45 dB, suggests that the intensity difference between [ɔ́] and [ɔ] is probably perceptible, given the mean and standard deviation for the pair ([ɔ́]: 68.88 dB (SD = 5.96); [ɔ]: 67.03 dB (SD = 6.94)). Note that [ɔ́] has the highest intensity among all the stressed vowels. A similar pattern is found in Garellek & White’s (Reference Garellek and White2015) work on Tongan stress: [o] with primary stress has the highest mean RMS energy compared with other vowels with primary stress.
In summary, comparing the intensity values of stressed and unstressed vowels confirms the hypothesis; in most cases, vowels in stressed and unstressed positions do not display intensity distinctions. Based on the multiple vowel-intensity comparisons, I conclude that intensity does not serve as a cue for stress in EP.
4.3 Fundamental frequency (f0)
As discussed in Section 2.3, the primary determinant of f0 in EP is intonation. Among the eight speakers, four distinct intonation groups were established based on f0 comparisons, as summarized in Table 13.
Table 13 Four intonation groups.
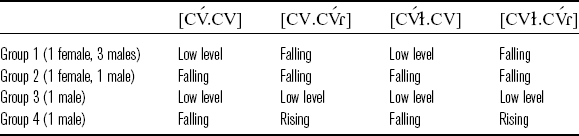
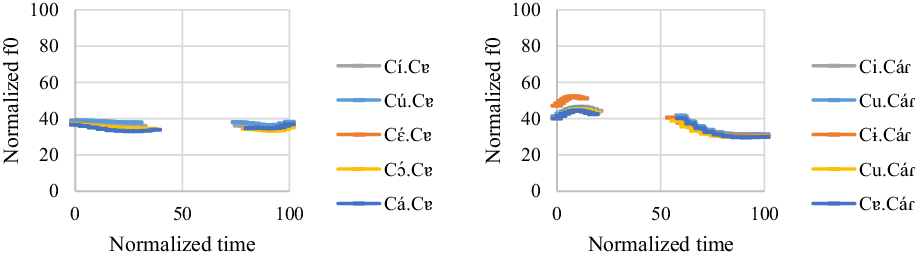
Figure 4 Intonation on ![]() and
and ![]() words. The x-axis is the normalized time (arbitrary units). The y-axis is the normalized f0 (arbitrary units).
words. The x-axis is the normalized time (arbitrary units). The y-axis is the normalized f0 (arbitrary units).
According to Escudero et al. (Reference Escudero, Boersma and Ricardo2009), f0 is influenced by vowel height in EP: high vowels have a higher f0 than low vowels, with a ratio of 1.095. Thus, words that have vowels with the same height (i.e. [Cɛ́.Cɐ], [Cɔ́.Cɐ], [Cɛ́ɫ.Cɐ], [Cɔ́ɫ.Cɐ], [Caɫ.Cáɾ]) are crucial in determining the intonation contours of the target words. For the rest of the section, I first present evidence for the four intonation groups and then discuss whether f0 functions as a cue for stress.
4.3.1 Group 1
Four participants (one female and three males) were found to have the same intonation pattern. The f0 model for ![]() and
and ![]() words is summarized in (11). A vowel by ORDER interaction effect significantly improves model fit, suggesting that the magnitude of this effect varies across vowels. Even so, the overall pattern is quite consistent in each repetition. Figure 4 shows the normalized pitch tracks of the
words is summarized in (11). A vowel by ORDER interaction effect significantly improves model fit, suggesting that the magnitude of this effect varies across vowels. Even so, the overall pattern is quite consistent in each repetition. Figure 4 shows the normalized pitch tracks of the ![]() and
and ![]() words.
words.
![]()
For [Cɛ́.Cɐ], [Cɔ́.Cɐ], and [Cá.Cɐ] words, the multiple comparisons indicate that there is no significant f0 distinction between the first and second vowels in each repetition (for [ɛ́] vs. [ɐ]: t = −0.29, p = .999 in the first repetition, t = −0.17, p = .999 in the second repetition, t = 0.7, p = .999 in the third repetition; for [ɔ́] vs. [ɐ]: t = 0.35, p = .999 in the first repetition, t = −0.22, p = .999 in the second repetition, t = 1.11, p = .994 in the third repetition; for [á] vs. [ɐ]: t = −1.89, p = .765 in the first repetition, t = −0.22, p = .999 in the second repetition, t = −1.11, p = .994 in the third repetition). For [Cí.Cɐ] words, the first vowel has a significantly higher f0 value than the second vowel in the first repetition but not so in the second and third repetitions (for [í] vs. [ɐ]: t = 3.46, p = .027 in the first repetition, t = 2.93, p = .132 in the second repetition, t = 1.63, p = .9 in the third repetition). For [Cú.Cɐ] words, the first vowel has a significantly higher f0 value than the second vowel in the first and second repetitions but not so in the third repetition (for [ú] vs. [ɐ]: t = 4.09, p = .003 in the first repetition, t = 3.38, p = .036 in the second repetition, t = 2.62, p = .271 in the third repetition). The fact that the high vowels [í] and [ú] have higher f0s than the mid vowel [ɐ] in some repetitions is perhaps due to the vowel-intrinsic f0 difference.
For ![]() words, the first vowel has a significantly higher f0 value than the second vowel. This pattern is consistent across all the repetitions, with all p < .001.
words, the first vowel has a significantly higher f0 value than the second vowel. This pattern is consistent across all the repetitions, with all p < .001.
The f0 model for ![]() and
and ![]() words is summarized in (12). Figure 5 shows the normalized pitch tracks of the
words is summarized in (12). Figure 5 shows the normalized pitch tracks of the ![]() and
and ![]() words.
words.
![]()

Figure 5 Intonation on ![]() and
and ![]() words. The x-axis is the normalized time (arbitrary units). The y-axis is the normalized f0 (arbitrary units).
words. The x-axis is the normalized time (arbitrary units). The y-axis is the normalized f0 (arbitrary units).
For [Cɛ́ɫ.Cɐ] and [Cɔ́ɫ.Cɐ] words, there is no significant f0 difference between the first and second vowels (t = −1.91, p = .751 for [ɛ́] vs. [ɐ]; t = −0.74, p = .999 for [ɔ́] vs. [ɐ]). For [Cíɫ.Cɐ] and [Cúɫ.Cɐ] words, the first vowel has a significantly higher f0 value than the second vowel (t = 5.89, p < .001 for [í] vs. [ɐ]; t = 6.65, p < .001 for [ú] vs. [ɐ]). For [Cáɫ.Cɐ] words, the first vowel has a lower f0 value than the second vowel, though the difference is borderline (t = −3.31, p = .047). Similarly, the discrepancy observed here is likely due to the vowel-intrinsic f0 difference: the low vowel [á] has a lower f0 value than the mid vowel [ɐ], and the high vowels [í] and [ú] have a higher f0 value than the mid vowel [ɐ].
For ![]() words, the first vowel has a significantly higher f0 value than the second vowel. This pattern is consistent regardless of the vowel quality in the first syllable, with all p < .001.
words, the first vowel has a significantly higher f0 value than the second vowel. This pattern is consistent regardless of the vowel quality in the first syllable, with all p < .001.
For the order effect, vowels in the second repetition have the highest f0, followed by vowels in the first repetition and vowels in the third repetition. The f0 difference between each repetition is significant (t = −5.38, p < .001 for the first repetition vs. the second repetition; t = 4.3, p < .001 for the first repetition vs. the third repetition; t = 9.69, p < .001 for the second repetition vs. the third repetition).
Overall, the results suggest that the words with penultimate stress have a low level contour, whereas the words with final stress have a falling contour. The fact that the high vowels [í] and [ú] have higher f0s than the mid vowel [ɐ] in ![]() and
and ![]() words is perhaps due to the vowel-intrinsic f0 difference. One might also wonder whether the f0 peak in
words is perhaps due to the vowel-intrinsic f0 difference. One might also wonder whether the f0 peak in ![]() and
and ![]() words results from the same effect. If this is the case, [Caɫ.Cáɾ] words should have a level contour or at least a distinct f0 contour compared with other
words results from the same effect. If this is the case, [Caɫ.Cáɾ] words should have a level contour or at least a distinct f0 contour compared with other ![]() words because both vowels have the same height. However, the fact that [Caɫ.Cáɾ] words have the same f0 pattern with other
words because both vowels have the same height. However, the fact that [Caɫ.Cáɾ] words have the same f0 pattern with other ![]() words suggests that the f0 peak is not a by-product of intrinsic f0 difference.
words suggests that the f0 peak is not a by-product of intrinsic f0 difference.
4.3.2 Group 2
Two participants (one female and one male) were found to have the same intonation pattern. The f0 model for ![]() and
and ![]() words is summarized in (13). Figure 6 shows the normalized pitch tracks of the
words is summarized in (13). Figure 6 shows the normalized pitch tracks of the ![]() and
and ![]() words.
words.
![]()
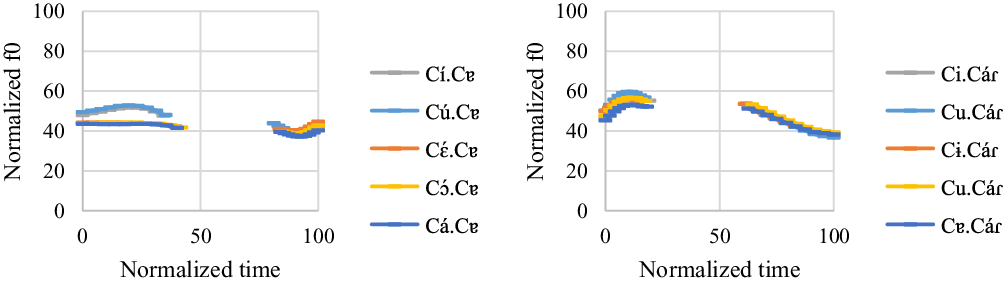
Figure 6 Intonation on ![]() and
and ![]() words. The x-axis is the normalized time (arbitrary units). The y-axis is the normalized f0 (arbitrary units).
words. The x-axis is the normalized time (arbitrary units). The y-axis is the normalized f0 (arbitrary units).
For ![]() words, the first vowel has a significantly higher f0 value than the second vowel in each word type (t = 11.56, p < .001 for [í] vs. [ɐ]; t = 12.48, p < .001 for [ú] vs. [ɐ]; t = 5.39, p < .001 for [ɛ́] vs. [ɐ]; t = 4.48, p < .001 for [ɔ́] vs. [ɐ]; t = 4.74, p < .001 for [á] vs. [ɐ]). The same pattern is also found for
words, the first vowel has a significantly higher f0 value than the second vowel in each word type (t = 11.56, p < .001 for [í] vs. [ɐ]; t = 12.48, p < .001 for [ú] vs. [ɐ]; t = 5.39, p < .001 for [ɛ́] vs. [ɐ]; t = 4.48, p < .001 for [ɔ́] vs. [ɐ]; t = 4.74, p < .001 for [á] vs. [ɐ]). The same pattern is also found for ![]() words (t = 13.71, p < .001 for [i] vs. [á]; t = 15.63, p < .001 for [u] vs. [á]; t = 13.87, p < .001 for [ɨ] vs. [á]; t = 11.66, p < .001 for [u] (reduced from /ɔ/) vs. [á]; t = 10.1, p < .001 for [ɐ] vs. [á]).
words (t = 13.71, p < .001 for [i] vs. [á]; t = 15.63, p < .001 for [u] vs. [á]; t = 13.87, p < .001 for [ɨ] vs. [á]; t = 11.66, p < .001 for [u] (reduced from /ɔ/) vs. [á]; t = 10.1, p < .001 for [ɐ] vs. [á]).
For the order effect, vowels in the third repetition have the highest f0, followed by vowels in the first repetition and vowels in the second repetition. However, only the f0 difference between the second and third repetitions reaches statistical significance (t = 2.18, p = .075 for the first repetition vs. the second repetition; t = −1.11, p = .511 for the first repetition vs. the third repetition; t = −3.26, p = .003 for the second repetition vs. the third repetition).
The f0 model for ![]() and
and ![]() words is summarized in (14). Figure 7 shows the normalized pitch tracks of the
words is summarized in (14). Figure 7 shows the normalized pitch tracks of the ![]() and
and ![]() words.
words.
![]()
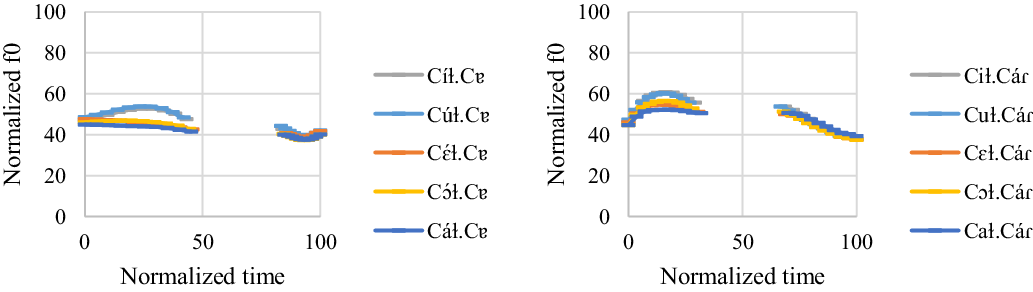
Figure 7 Intonation on ![]() and
and ![]() words. The x-axis is the normalized time (arbitrary units). The y-axis is the normalized f0 (arbitrary units).
words. The x-axis is the normalized time (arbitrary units). The y-axis is the normalized f0 (arbitrary units).
For ![]() words, the first vowel has a significantly higher f0 value than the second vowel in each word type (t = 13.32, p < .001 for [í] vs. [ɐ]; t = 14.04, p < .001 for [ú] vs. [ɐ]; t = 7.15, p < .001 for [ɛ́] vs. [ɐ]; t = 7.95, p < .001 for [ɔ́] vs. [ɐ]; t = 5.74, p < .001 for [á] vs. [ɐ]).
words, the first vowel has a significantly higher f0 value than the second vowel in each word type (t = 13.32, p < .001 for [í] vs. [ɐ]; t = 14.04, p < .001 for [ú] vs. [ɐ]; t = 7.15, p < .001 for [ɛ́] vs. [ɐ]; t = 7.95, p < .001 for [ɔ́] vs. [ɐ]; t = 5.74, p < .001 for [á] vs. [ɐ]).
The same pattern is also found for ![]() words (t = 15.37, p < .001 for [i] vs. [á]; t = 15.17, p < .001 for [u] vs. [á]; t = 10.25. p < .001 for [ɛ] vs. [á]; t = 11.6, p < .001 for [ɔ] vs. [á]; t = 8.16, p < .001 for [a] vs. [á]).
words (t = 15.37, p < .001 for [i] vs. [á]; t = 15.17, p < .001 for [u] vs. [á]; t = 10.25. p < .001 for [ɛ] vs. [á]; t = 11.6, p < .001 for [ɔ] vs. [á]; t = 8.16, p < .001 for [a] vs. [á]).
For the order effect, vowels in the first repetition have the highest f0, followed by vowels in the third repetition and vowels in the second repetition. However, the f0 difference between the second and third repetitions is not statistically significant (t = 3.9, p < .001 for the first repetition vs. the second repetition; t = 2.76, p = .016 for the first repetition vs. the third repetition; t = − 1.15, p = .486 for the second repetition vs. the third repetition).
Overall, the results suggest that all the target words have a falling contour regardless of the stress position. As shown in Figures 6 and 7, high vowels do have a higher f0 than mid and low vowels. However, this vowel-intrinsic f0 difference does not affect the overall pattern. Moreover, the f0 trough does not result from the influence of [ɐ] in ![]() and
and ![]() words or [á] in
words or [á] in ![]() and
and ![]() words. If [ɐ] lowers the f0, we should expect [Cɛ́.Cɐ], [Cɔ́.Cɐ], [Cɛ́ɫ.Cɐ], and [Cɔ́ɫ.Cɐ] words to have a level contour. If [á] lowers the f0, we should expect to see [Caɫ.Cáɾ] words have a level f0 contour, too. However, this is not the case. The first vowel in those words has a significantly higher f0 value than the second vowel.
words. If [ɐ] lowers the f0, we should expect [Cɛ́.Cɐ], [Cɔ́.Cɐ], [Cɛ́ɫ.Cɐ], and [Cɔ́ɫ.Cɐ] words to have a level contour. If [á] lowers the f0, we should expect to see [Caɫ.Cáɾ] words have a level f0 contour, too. However, this is not the case. The first vowel in those words has a significantly higher f0 value than the second vowel.
4.3.3 Group 3
One male participant was found to have a distinct intonation pattern compared with other participants. The f0 model for ![]() and
and ![]() words is summarized in (15). Figure 8 shows the normalized pitch tracks of the
words is summarized in (15). Figure 8 shows the normalized pitch tracks of the ![]() and
and ![]() words.
words.
![]()
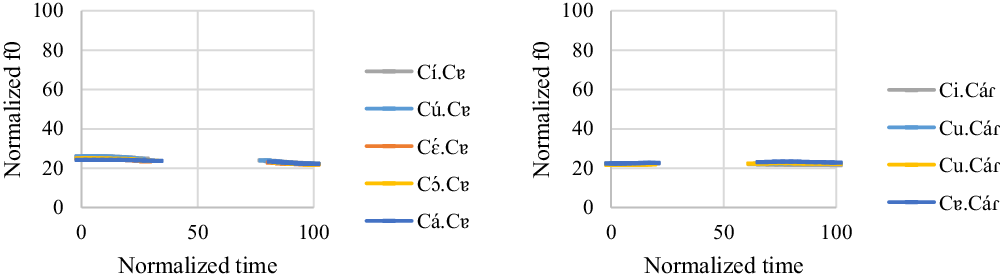
Figure 8 Intonation on ![]() and
and ![]() words. The x-axis is the normalized time (arbitrary units). The y-axis is the normalized f0 (arbitrary units).
words. The x-axis is the normalized time (arbitrary units). The y-axis is the normalized f0 (arbitrary units).
For [Cí.Cɐ], [Cú.Cɐ], and [Cɔ́.Cɐ] words, the first vowel has a significantly higher f0 than the second vowel (t = 7.26, p < .001 for [í] vs. [ɐ]; t = 9.77, p < .001 for [ú] vs. [ɐ]; t = 4.81, p < .001 for [ɔ́] vs. [ɐ]). For [Cɛ́.Cɐ] and [Cá.Cɐ] words, there is no significant f0 difference between the first and second vowels (t = 3.01, p = .227 for [ɛ́] vs. [ɐ]; t = 2.1, p = .832 for [á] vs. [ɐ]).
For ![]() words, none of the pairwise comparisons show any differences (t = 2.53, p = .538 for [i] vs. [á]; t = −0.47, p = .999 for [u] vs. [á]; t = 1.49, p = .993 for [u] (reduced from /ɔ/) vs. [á]; t = −1.94, p = .905 for [ɐ] vs. [á]). Note that [Cɨ.Cáɾ] words are not listed here because the male participant deleted all the [ɨ]s in the stimuli.
words, none of the pairwise comparisons show any differences (t = 2.53, p = .538 for [i] vs. [á]; t = −0.47, p = .999 for [u] vs. [á]; t = 1.49, p = .993 for [u] (reduced from /ɔ/) vs. [á]; t = −1.94, p = .905 for [ɐ] vs. [á]). Note that [Cɨ.Cáɾ] words are not listed here because the male participant deleted all the [ɨ]s in the stimuli.
For the order effect, vowels in the third repetition have the highest f0, followed by vowels in the second repetition and vowels in the first repetition. Only the f0 difference between the second and third repetitions is significant (t = −7.25, p < .001 for the first repetition vs. the second repetition; t = −6.99, p < .001 for the first repetition vs. the third repetition; t = −1.05, p = .551 for the second repetition vs. the third repetition).
The f0 model for ![]() and
and ![]() words is summarized in (16). Figure 9 shows the normalized pitch tracks of the
words is summarized in (16). Figure 9 shows the normalized pitch tracks of the ![]() and
and ![]() words. A vowel by ORDER interaction effect significantly improves model fit, suggesting that the magnitude of this effect varies across vowels.
words. A vowel by ORDER interaction effect significantly improves model fit, suggesting that the magnitude of this effect varies across vowels.
![]()
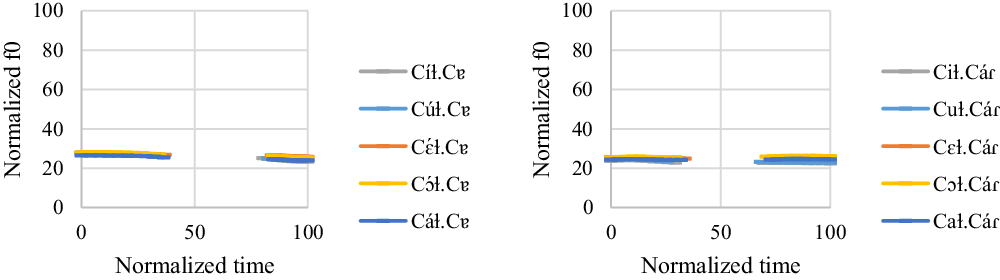
Figure 9 Intonation on ![]() and
and ![]() words. The x-axis is the normalized time (arbitrary units). The y-axis is the normalized f0 (arbitrary units).
words. The x-axis is the normalized time (arbitrary units). The y-axis is the normalized f0 (arbitrary units).
For [Cíɫ.Cɐɾ] and [Cúɫ.Cɐɾ] words, the first vowel consistently has a higher f0 value than the second vowel in all the repetitions, with all p < .001. For [Cɛ́ɫ.Cɐɾ] and [Cɔ́ɫ.Cɐɾ] words, there is no significant f0 difference between the first and second vowels in almost all the repetitions, with all p > .815. The exceptions include [Cɛ́ɫ.Cɐɾ] words in the third repetition (t = 3.69, p = .037) and [Cɔ́ɫ.Cɐɾ] words in the first repetition (t = 3.6, p = .048), but the differences are marginal. For [Cáɫ.Cɐɾ] words, the first and second vowels do not show any significant distinctions in all the repetitions, with all p > .117.
For almost all the ![]() words, there is no significant f0 differences between the first and second vowels, with all p > .073. The exceptions are [Cuɫ.Cáɾ] words in the second and third repetitions, though the differences between [u] and [á] are marginal (t = 3.6, p = .05 for the second repetition; t = 3.77, p = .029 for the third repetition).
words, there is no significant f0 differences between the first and second vowels, with all p > .073. The exceptions are [Cuɫ.Cáɾ] words in the second and third repetitions, though the differences between [u] and [á] are marginal (t = 3.6, p = .05 for the second repetition; t = 3.77, p = .029 for the third repetition).
Overall, the results suggest that all the target words have a level contour regardless of the stress position. The fact that some high vowels have a higher f0 can be attributed to the vowel-intrinsic f0 effect, as seen in Group 1 and Group 2.
4.3.4 Group 4
One male participant was found to have a unique intonation pattern compared with other participants. The f0 model for ![]() and
and ![]() words is summarized in (17). Figure 10 shows the normalized pitch tracks of the
words is summarized in (17). Figure 10 shows the normalized pitch tracks of the ![]() and
and ![]() words.
words.
![]()
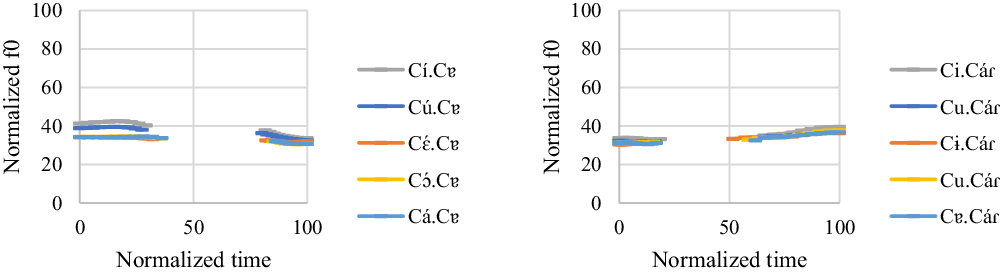
Figure 10 Intonation on ![]() and
and ![]() words. The x-axis is the normalized time (arbitrary units). The y-axis is the normalized f0 (arbitrary units).
words. The x-axis is the normalized time (arbitrary units). The y-axis is the normalized f0 (arbitrary units).
For ![]() words, the first vowel consistently has a significantly higher f0 value than the second vowel (t = 9.92, p < .001 for [í] vs. [ɐ]; t = 8.03, p < .001 for [ú] vs. [ɐ]; t = 5.16, p < .001 for [ɔ́] vs. [ɐ]; t = 4.29, p = .004 for [á] vs. [ɐ]), except for that there is no f0 difference in [Cɛ́.Cɐ] words (t = 2.88, p = .31 for [ɛ́] vs. [ɐ]). For
words, the first vowel consistently has a significantly higher f0 value than the second vowel (t = 9.92, p < .001 for [í] vs. [ɐ]; t = 8.03, p < .001 for [ú] vs. [ɐ]; t = 5.16, p < .001 for [ɔ́] vs. [ɐ]; t = 4.29, p = .004 for [á] vs. [ɐ]), except for that there is no f0 difference in [Cɛ́.Cɐ] words (t = 2.88, p = .31 for [ɛ́] vs. [ɐ]). For ![]() words, the second vowel consistently has a significantly higher f0 value than the first vowel (t = −4.65, p = .001 for [i] vs. [á]; t = −4.09, p = .01 for [u] vs. [á]; t = −4.19, p = .007 for [u] (reduced from /ɔ/) vs. [á]; t = −5.07, p < .001 for [ɐ] vs. [á]), except that there is no f0 difference in [Cɨ.Cáɾ] words (t = −1.77, p = .966 for [ɨ] vs. [á]).
words, the second vowel consistently has a significantly higher f0 value than the first vowel (t = −4.65, p = .001 for [i] vs. [á]; t = −4.09, p = .01 for [u] vs. [á]; t = −4.19, p = .007 for [u] (reduced from /ɔ/) vs. [á]; t = −5.07, p < .001 for [ɐ] vs. [á]), except that there is no f0 difference in [Cɨ.Cáɾ] words (t = −1.77, p = .966 for [ɨ] vs. [á]).
As for the order effect, vowels in the third repetition have the highest f0, followed by vowels in the second repetition and vowels in the first repetition. The f0 difference between each repetition is significant (t = −4.09, p < .001 for the first repetition vs. the second repetition; t = −9.91, p < .001 for the first repetition vs. the third repetition; t = −6.49, p < .001 for the second repetition vs. the third repetition).
The f0 model for ![]() and
and ![]() words is summarized in (18). Figure 11 shows the normalized pitch tracks of the
words is summarized in (18). Figure 11 shows the normalized pitch tracks of the ![]() and
and ![]() words.
words.
![]()
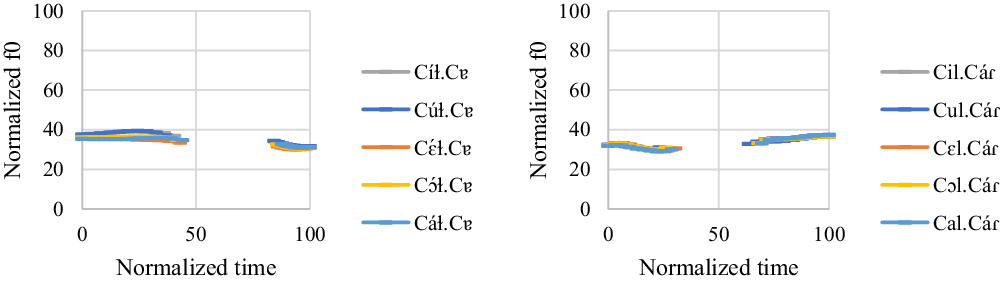
Figure 11 Intonation on ![]() and
and ![]() words. The x-axis is the normalized time (arbitrary units). The y-axis is the normalized f0 (arbitrary units).
words. The x-axis is the normalized time (arbitrary units). The y-axis is the normalized f0 (arbitrary units).
For ![]() words, the first vowel always has a significantly higher f0 value than the second vowel (t = 8.52, p < .001 for [í] vs. [ɐ]; t = 8.71, p < .001 for [ú] vs. [ɐ]; t = 5.64, p < .001 for [ɛ́] vs. [ɐ]; t = 6.61, p < .001 for [ɔ́] vs. [ɐ]; t = 5.36, p < .001 for [á] vs. [ɐ]). For
words, the first vowel always has a significantly higher f0 value than the second vowel (t = 8.52, p < .001 for [í] vs. [ɐ]; t = 8.71, p < .001 for [ú] vs. [ɐ]; t = 5.64, p < .001 for [ɛ́] vs. [ɐ]; t = 6.61, p < .001 for [ɔ́] vs. [ɐ]; t = 5.36, p < .001 for [á] vs. [ɐ]). For ![]() words, the second vowel always has a significantly higher f0 value than the first vowel (t = −5.67, p < .001 for [i] vs. [á]; t = −4.41, p = .003 for [u] vs. [á]; t = −6.28, p < .001 for [ɛ] vs. [á]; t = −5.04, p < .001 for [ɔ] vs. [á]; t = −6.64, p < .001 for [a] vs. [á]).
words, the second vowel always has a significantly higher f0 value than the first vowel (t = −5.67, p < .001 for [i] vs. [á]; t = −4.41, p = .003 for [u] vs. [á]; t = −6.28, p < .001 for [ɛ] vs. [á]; t = −5.04, p < .001 for [ɔ] vs. [á]; t = −6.64, p < .001 for [a] vs. [á]).
As for the order effect, vowels in the third repetition have the highest f0, followed by vowels in the second repetition and vowels in the first repetition. The f0 difference between each repetition is significant (t = −8.27, p < .001 for the first repetition vs. the second repetition; t = −15.15, p < .001 for the first repetition vs. the third repetition; t = −6.44, p < .001 for the second repetition vs. the third repetition).
Overall, the results suggest the target words with penultimate stress have a falling contour, whereas the target words with final stress have a rising contour. As can be seen in Figures 10 and 11, high vowels do have a higher f0 than mid and low vowels. However, this effect does not affect the overall pattern here.
4.3.5 The role of f0 in EP stress
To determine whether f0 is an acoustic cue for stress in EP, this study focuses on Group 2 and Group 3 as the target syllables have the same f0 shape. The target syllables consistently have a f0 peak in Group 2 and a f0 trough in Group 3, respectively.
For Group 2, the stressed high vowels in /CiCV/ and /CuCV/ words have a significantly lower f0 value than their unstressed counterparts (t = −4.13, p = .003 for [í] vs. [i]; t = −4.9, p < .001 for [ú] vs. [u]). Similarly, stressed vowels in ![]() words have a significantly lower f0 value than their unstressed counterparts in
words have a significantly lower f0 value than their unstressed counterparts in ![]() words (t = −5.03, p < .001 for [í] vs. [i]; t = −4.32, p = .001 for [ú] vs. [u]; t = −5.85, p < .001 for [ɛ́] vs. [ɛ]; t = −6.45, p < .001 for [ɔ́] vs. [ɔ]; t = −5.32, p < .001 for [á] vs. [a]).
words (t = −5.03, p < .001 for [í] vs. [i]; t = −4.32, p = .001 for [ú] vs. [u]; t = −5.85, p < .001 for [ɛ́] vs. [ɛ]; t = −6.45, p < .001 for [ɔ́] vs. [ɔ]; t = −5.32, p < .001 for [á] vs. [a]).
From a cross-linguistic point of view, f0 is less likely to function as an acoustic cue for stress in Group 2. In Gordon & Roettger’s (Reference Gordon and Roettger2017) survey of 110 studies on 75 stress languages, they discover that in most studies in which fundamental frequency diagnoses stress, f0 values are greater in stressed than unstressed syllables. There are only a pair of studies in which lowered f0 was symptomatic of stress: the speakers from Lahore (but not the one from Karachi) in Hussain’s (Reference Hussain1997) study of Urdu and the isolation words (but not those in context) in Eriksson et al.’s (Reference Eriksson, Pier Marco Bertinetto, Nodari and Lenoci2016) research on Italian.
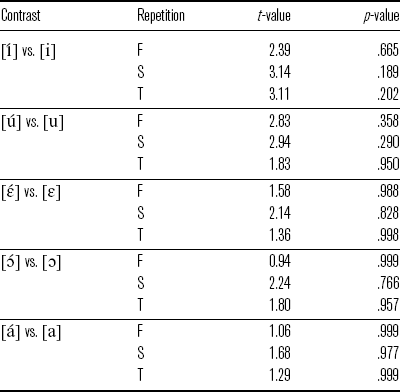
For Group 3, there is no significant f0 difference between [í] and [i] in /CiCV/ words (t = 3.38, p = .097). However, [ú] has a higher f0 value than [u] in /CuCV/ words (t = 4.15, p = .007). Note that the male participant had seven [u]-deletions out of 18 stimuli. The deletion rate is close to 40%. This suggests that [u] is already acoustically weak so it is prone to undergo deletion (also see Section 4.4 for the duration results). For ![]() and
and ![]() words, there is no statistical significance between stressed vowels and their unstressed counterparts in each repetition, as summarized in Table 14. In short, stressed and unstressed vowels are not distinguished by f0 in almost all the cases. I conclude that f0 does not function as an acoustic cue for stress for Group 3.
words, there is no statistical significance between stressed vowels and their unstressed counterparts in each repetition, as summarized in Table 14. In short, stressed and unstressed vowels are not distinguished by f0 in almost all the cases. I conclude that f0 does not function as an acoustic cue for stress for Group 3.
Table 14 Comparisons between stressed and unstressed vowels in ![]() and
and ![]() words in different repetitions (F = first repetition, S = second repetition, T = third repetition).
words in different repetitions (F = first repetition, S = second repetition, T = third repetition).
Finally, the variable intonation contours cannot be attributed to dialectal differences. Specifically, the participants in Group 1 belong to two different EP varieties: the Northern dialect (Porto × 2) and the Central-Southern dialect (Coimbra × 1 and Lisbon × 1). The participants in Group 2 all speak the Central-Southern dialect (Coimbra × 1 and Lisbon × 1). The participant in Group 3 speaks the Central-Southern dialect (Lisbon). The participant in Group 4 speaks the Northern dialect (Porto).
4.4 Duration
This section explores whether stressed and unstressed vowels are distinguished by duration. According to Escudero et al. (Reference Escudero, Boersma and Ricardo2009), duration is influenced by vowel height in EP: lower vowels are longer than higher vowels, with a ratio of low to high vowels of 1.339. Hence, comparison of vowels with the same height is crucial in the analysis of duration. Also, f0 might have an influence on the duration of the syllable; for example, Gandour (Reference Gandour1977) reports that low-toned vowels are longer than high-toned vowels in Thai. The analyses are therefore based on the four intonation groups discussed in Section 4.3.
4.4.1 Group 1
Recall that Group 1 has a low level contour on words with penultimate stress and a falling contour on words with final stress. To determine the influence of f0 on vowel duration, the [ɐ]s in [Cá.Cɐ] and [Cɐ.Cáɾ] are crucial because they are unstressed and have identical quality. However, the [ɐ] with a f0 trough (57.42 ms, SE = 1.8) is found to be shorter than the [ɐ] with a f0 peak (61.57 ms, SE = 1.71), the opposite of what is expected. An unpaired t-test analysis shows that the comparison between the [ɐ] with a f0 trough and the [ɐ] with a f0 peak is not significant: t(141) = 1.67, p = .097. Therefore, I assume the influence of f0 on duration, if any, is minimal for Group 1. Figure 12 shows the mean durations for the target vowels.
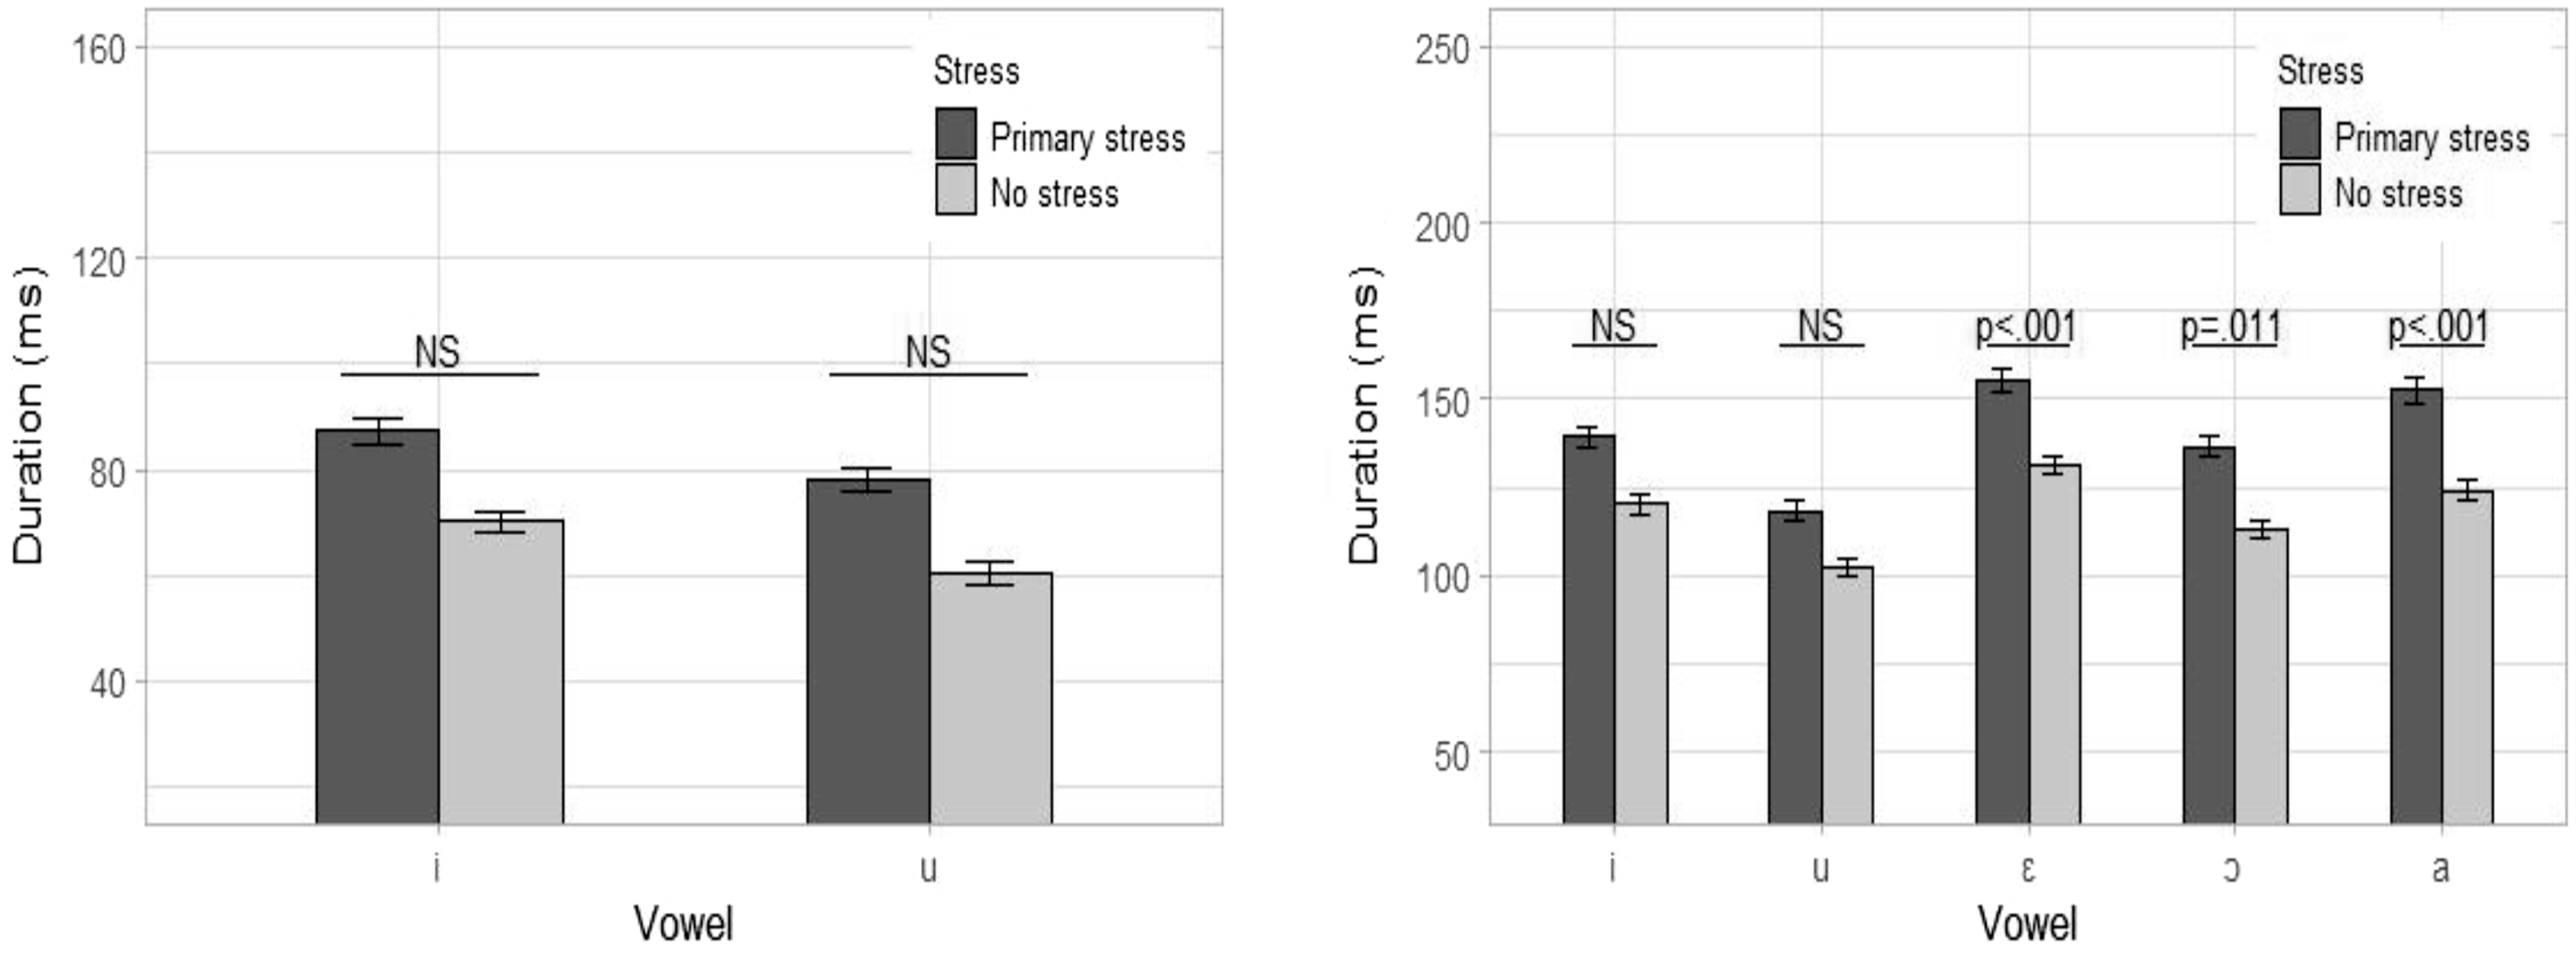
Figure 12 Duration by vowel, for ![]() ∼
∼![]() (left panel) and
(left panel) and ![]() ∼
∼![]() (right panel). Error bars represent standard error of the mean.
(right panel). Error bars represent standard error of the mean.
The duration model for ![]() and
and ![]() words is summarized in (19). It is found that stressed high vowels are not significantly longer than their unstressed counterparts, as shown in Table 15.
words is summarized in (19). It is found that stressed high vowels are not significantly longer than their unstressed counterparts, as shown in Table 15.
![]()
Table 15 Mean duration (in ms; standard errors in parentheses) for vowels with stress and no stress in ![]() and
and ![]() words.
words.
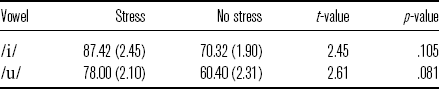
For the order effect, vowels in the first repetition have the longest duration (78.05 ms (SE = 2.4)), followed by vowels in the second repetition (72.71 ms (SE = 2.01)) and vowels in the third repetition (71.83 ms (SE = 2.02)). The durational differences between the first and second repetitions and between the first and third repetitions are found to be significant (t = 3.32, p = .002 for the first repetition vs. the second repetition; t = 4.11, p < .001 for the first repetition vs. the third repetition). In addition, vowels preceded by a labial have the longest duration (79.38 ms (SE = 1.64)), compared with vowels preceded by a coronal (70.24 ms (SE = 1.96)) and a dorsal (63.32 ms (SE = 3.92)). Only the comparison between vowels preceded by a labial and vowels preceded by a coronal is found to be marginally significant (t = −2.49, p = .048).
The duration model for ![]() and
and ![]() words is summarized in (20). Similar to
words is summarized in (20). Similar to ![]() and
and ![]() words, stressed high vowels are not significantly longer than their unstressed counterparts, as in Table 16. Other vowels, however, do show statistical differences.
words, stressed high vowels are not significantly longer than their unstressed counterparts, as in Table 16. Other vowels, however, do show statistical differences.
![]()
Table 16 Mean duration (in ms; standard errors in parentheses) for vowels with stress and no stress in ![]() and
and ![]() words.
words.
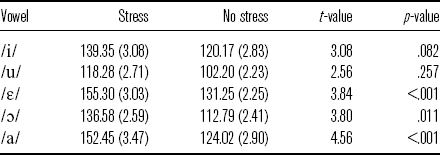
For the order effect, vowels in the first repetition have the longest duration (135.68 ms (SE = 2.13)), followed by vowels in the second repetition (127.76 ms (SE = 1.75)) and vowels in the third repetition (124.95 ms (SE = 1.57)). No statistical distinction is found for each comparison, with all p > .271.
In short, within-vowel comparisons reveal that the effect of stress on duration is only significant for the vowels /ɛ/, /ɔ/, and /a/ in ![]() and
and ![]() words. Based on the findings, I conclude that duration signals stress in a limited way for Group 1.
words. Based on the findings, I conclude that duration signals stress in a limited way for Group 1.
4.4.2 Group 2
Recall that Group 2 has a falling contour on all the target words. The f0 peak is consistently on the initial syllable, so the influence of f0 on duration is potentially minimized. Figure 13 shows the mean durations for the target vowels.

Figure 13 Duration by vowel, for ![]() ∼
∼![]() (left panel) and
(left panel) and ![]() ∼
∼![]() (right panel). Error bars represent standard error of the mean.
(right panel). Error bars represent standard error of the mean.
The duration model for ![]() and
and ![]() words is summarized in (21). First, stressed vowels are significantly longer than their unstressed counterparts, as shown in Table 17. Moreover, vowels preceded by a labial have the longest duration (87.22 ms (SE = 3.39)), followed by vowels preceded by a dorsal (74.5 ms (SE = 9.16)) and vowels preceded by a coronal (70.97 ms (SE = 2.72)). In particular, vowels preceded by a labial are significantly longer than vowels preceded by a coronal (t = −3.56, p = .004).
words is summarized in (21). First, stressed vowels are significantly longer than their unstressed counterparts, as shown in Table 17. Moreover, vowels preceded by a labial have the longest duration (87.22 ms (SE = 3.39)), followed by vowels preceded by a dorsal (74.5 ms (SE = 9.16)) and vowels preceded by a coronal (70.97 ms (SE = 2.72)). In particular, vowels preceded by a labial are significantly longer than vowels preceded by a coronal (t = −3.56, p = .004).
![]()
Table 17 Mean duration (in ms; standard errors in parentheses) for vowels with stress and no stress in ![]() and
and ![]() words.
words.
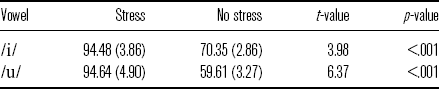
The duration model for ![]() and
and ![]() words is summarized in (22). For /u/, /ɛ/, and /ɔ/, stressed vowels are significantly longer than their unstressed counterparts. For /i/ and /a/, there is no statistical significance between stressed vowels and their unstressed counterparts, as shown in Table 18.
words is summarized in (22). For /u/, /ɛ/, and /ɔ/, stressed vowels are significantly longer than their unstressed counterparts. For /i/ and /a/, there is no statistical significance between stressed vowels and their unstressed counterparts, as shown in Table 18.
![]()
Table 18 Mean duration (in ms; standard errors in parentheses) for vowels with stress and no stress in ![]() and
and ![]() words.
words.
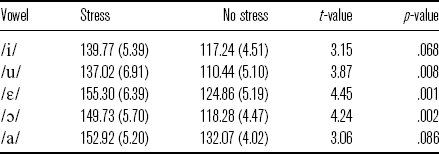
For the order effect, vowels in the first repetition have the longest duration (140.74 ms (SE = 2.9)), followed by vowels in the second repetition (132.69 ms (SE = 3.17)) and vowels in the third repetition (128.21 ms (SE = 3.48)). No statistical distinction is found for each pair, with all p > .548. In addition, vowels preceded by a coronal (136.04 ms (SE = 2.58)) or labial (133.59 ms (SE = 2.77)) have longer duration than vowels preceded by a dorsal (103.06 ms (SE = 5.75)). The distinctions are significant (t = 2.6, p = .03 for coronal vs. dorsal; t = −2.7, p = .023 for labial vs. dorsal).
In short, within-vowel comparisons reveal that the effect of stress on duration is significant for the vowels /i/ and /u/ in ![]() and
and ![]() words. The effect is also significant for the vowels /u/, /ɛ/, and /ɔ/ in
words. The effect is also significant for the vowels /u/, /ɛ/, and /ɔ/ in ![]() and
and ![]() words. Based on the findings, I conclude that duration signals stress in a limited way for Group 2.
words. Based on the findings, I conclude that duration signals stress in a limited way for Group 2.
4.4.3 Group 3
Recall that Group 3 has a level contour on all the target words, so the influence of f0 on duration is potentially minimized. Figure 14 shows the mean durations for the target vowels.

Figure 14 Duration by vowel, for ![]() ∼
∼![]() (left panel) and
(left panel) and ![]() ∼
∼![]() (right panel). Error bars represent standard error of the mean.
(right panel). Error bars represent standard error of the mean.
The duration model for ![]() and
and ![]() words is summarized in (23). As shown in Table 19, there is no significant durational difference between [í] and [i]. However, [ú] is significantly longer than [u]. Recall that the male participant had seven [u]-deletions out of 18 stimuli. This suggests that [u] is already acoustically very weak so it is prone to undergo deletion (also see Section 4.2 for the intensity results).
words is summarized in (23). As shown in Table 19, there is no significant durational difference between [í] and [i]. However, [ú] is significantly longer than [u]. Recall that the male participant had seven [u]-deletions out of 18 stimuli. This suggests that [u] is already acoustically very weak so it is prone to undergo deletion (also see Section 4.2 for the intensity results).
![]()
Table 19 Mean duration (in ms; standard errors in parentheses) for vowels with stress and no stress in ![]() and
and ![]() words.
words.
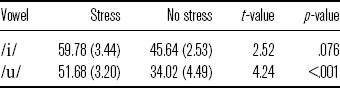
As for the order effect, vowels in the first repetition have the longest duration (54.42 ms (SE = 4.3)), followed by vowels in the second repetition (47.64 ms (SE = 3.2)) and vowels in the third repetition (43.49 ms (SE = 2.25)). The durational difference between the first and second repetitions reaches statistical significance (t = 3.54, p = .003), so as the difference between the first and third repetitions (t = 4.51, p < .001). In addition, vowels preceded by a labial have the longest duration (52.87 ms (SE = 2.78)), compared with vowels preceded by a coronal (41.72 ms (SE = 2.56)) and dorsal (41.15 ms (SE = 1.8)). However, no statistical distinction is found for each pair, with all p > .071.
The duration model for ![]() and
and ![]() words is summarized in (24). A vowel by ORDER interaction effect significantly improves model fit, suggesting that the magnitude of this effect varies across vowels. For example, [í] is consistently longer than [i] in each repetition, as shown in Table 20. On the other hand, [ɔ́] is only longer than [ɔ] in the first repetition but shorter than [ɔ] in the second and third repetitions. However, the multiple comparisons show that there is no significant durational difference between stressed vowels and their unstressed counterparts in each repetition, with all p > .332.
words is summarized in (24). A vowel by ORDER interaction effect significantly improves model fit, suggesting that the magnitude of this effect varies across vowels. For example, [í] is consistently longer than [i] in each repetition, as shown in Table 20. On the other hand, [ɔ́] is only longer than [ɔ] in the first repetition but shorter than [ɔ] in the second and third repetitions. However, the multiple comparisons show that there is no significant durational difference between stressed vowels and their unstressed counterparts in each repetition, with all p > .332.
![]()
Table 20 Mean duration (in ms; standard errors in parentheses) for vowels with stress and no stress in ![]() and
and ![]() words (F = first repetition, S = second repetition, T = third repetition).
words (F = first repetition, S = second repetition, T = third repetition).
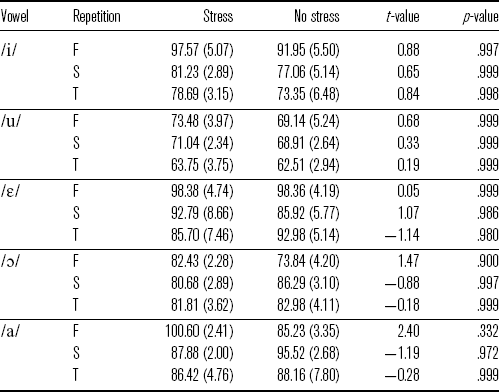
In short, within-vowel comparisons reveal that the effect of stress on duration is not significant for all the vowels except for /u/ in ![]() and
and ![]() words. Based on the findings, I conclude that duration does not function as a stress cue for Group 3.
words. Based on the findings, I conclude that duration does not function as a stress cue for Group 3.

Figure 15 Duration by vowel, for ![]() ∼
∼![]() (left panel) and
(left panel) and ![]() ∼
∼![]() (right panel). Error bars represent standard error of the mean.
(right panel). Error bars represent standard error of the mean.
4.4.4 Group 4
Recall that Group 4 has a falling contour on words with penultimate stress and a rising contour on words with final stress. It is impossible to adopt the analysis in Group 1 to determine the influence of f0 on vowel duration because the unstressed vowels in [Cá.Cɐ] and [Cɐ.Cáɾ] words all have a f0 trough. Thus, the results reported here might be influenced by f0. Figure 15 shows the mean durations for the target vowels.
The duration model for ![]() and
and ![]() words is summarized in (25). It is found that stressed vowels are not significantly longer than their unstressed counterparts, as shown in Table 21. In addition, vowels preceded by a labial have the longest duration (81.09 ms (SE = 2.84)), compared with vowels preceded by a coronal (69.01 ms (SE = 2.8)) and dorsal (56.11 ms (SE = 6.25)). However, no statistical distinction is found for each pair, with all p > .122.
words is summarized in (25). It is found that stressed vowels are not significantly longer than their unstressed counterparts, as shown in Table 21. In addition, vowels preceded by a labial have the longest duration (81.09 ms (SE = 2.84)), compared with vowels preceded by a coronal (69.01 ms (SE = 2.8)) and dorsal (56.11 ms (SE = 6.25)). However, no statistical distinction is found for each pair, with all p > .122.
![]()
Table 21 Mean duration (in ms; standard errors in parentheses) for vowels with stress and no stress in ![]() and
and ![]() words.
words.
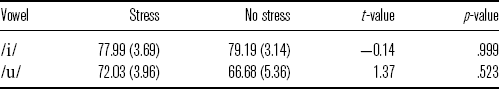
The duration model for ![]() and
and ![]() words is summarized in (26). As shown in Table 22, the multiple comparisons of stressed and unstressed vowels show no significant difference.
words is summarized in (26). As shown in Table 22, the multiple comparisons of stressed and unstressed vowels show no significant difference.
![]()
Table 22 Mean duration (in ms; standard errors in parentheses) for vowels with stress and no stress in ![]() and
and ![]() words.
words.
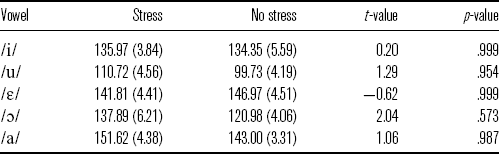
There are two possible interpretations of the duration result. One is that stress increases the duration of the stressed vowels in ![]() and
and ![]() words, whereas the f0 trough in the rising contour increases the duration of the unstressed vowels in
words, whereas the f0 trough in the rising contour increases the duration of the unstressed vowels in ![]() and
and ![]() words. As a result, there is no durational distinction between the stressed and unstressed vowels. The other interpretation is that neither stress nor f0 increases the duration of the relevant vowels. Consequently, there is no durational distinction between the stressed and unstressed vowels. Unfortunately, there is no crucial evidence to determine which scenario is correct. Therefore, it is not clear whether Group 4 uses duration to signal stress.
words. As a result, there is no durational distinction between the stressed and unstressed vowels. The other interpretation is that neither stress nor f0 increases the duration of the relevant vowels. Consequently, there is no durational distinction between the stressed and unstressed vowels. Unfortunately, there is no crucial evidence to determine which scenario is correct. Therefore, it is not clear whether Group 4 uses duration to signal stress.
5 Discussion
The results from the nonce word experiment suggest that no single acoustic measure consistently correlates with stress for all the vowels in EP. For example, F1 is significant for /a/ in /CVlCa/ words but not for other vowels. Moreover, the acoustic correlates are not always present to signal stress. For example, intensity is significant for /u/ in /CVCa/ words, but not significant for /u/ in /CVlCa/ words. Nonetheless, duration is found to be the most robust correlate of stress among the five cues examined in this study. However, the effect of duration is found to be limited to certain vowels and speakers (i.e. Group 1, Group 2, and Group 3), and sometimes obscured by intonation contours (i.e. Group 4). F0, F1, F2, and intensity, for almost all the cases, do not signal stress. The finding about the roles of f0, duration, and intensity in EP stress is broadly consistent with the literature.
Cross-linguistically, duration is frequently reported to be an acoustic cue for stress in several languages. In Gordon & Roettger’s (Reference Gordon and Roettger2017) survey, they found that a large number of parameters potentially signal stress, including duration, fundamental frequency (f0), intensity, vowel quality (F1 and F2), and spectral tilt. Even though studies vary considerably in which subset of these potential stress correlates are examined, duration was statistically the most reliable exponent of stress across languages.
Moreover, duration is also found to be a reliable cue in languages that use multiple properties to distinguish stress levels. Gordon & Roettger found eleven different languages in their database that use statistical analyses to assess the relative capacity of different acoustic dimensions to predict stress level. In five of the eleven languages, duration emerged as the most predictive of stress, including Thai, Dutch, Ma’ya, Papiamentu, and Hebrew.
The inconsistency of the duration results suggests that stress might not be perceived in a stable way when vowel reduction is absent. Correia et al. (Reference Correia, Frota, Butler and Vigário2013, Reference Correia, Butler, Vigário and Frota2015) investigate the perception of word stress in EP, both in nuclear and post-nuclear positions, by means of three experiments. Their results show that when vowel reduction is absent from the stimuli, EP speakers show a stress ‘deafness’ effect. That is, EP speakers show significantly higher error rates in the stress contrast condition than in the phoneme contrast condition when either duration alone, or both duration and pitch accents are present in the stimuli. The result is consistent in both the ABX task (i.e. experiment 1) and sequence recall task (i.e. experiment 2). Crucially, when vowel reduction is added in the stimuli, EP speakers are able to perceive stress contrasts.
It is also possible that the durational inconsistency stems from syllable position. In Delgado-Martins’s (Reference de Lacy and van der Hulst1982, Reference Delgado-Martins1986) perception experiment, EP speakers were asked to identify the stressed syllable in the triplet: [ʃˈplisitu] ‘explicit’, [ʃpliˈsitu] ‘I make explicit’, and [ʃplisiˈto] ‘(s/he) made explicit.’ The three words were placed in three different contexts: in isolation, in a fixed sentence, and in a free sentence. It was found that a decrease in duration in the case of penultimate stress did not induce stress displacement, but if the duration of the antepenultimate or final stressed syllable was reduced, stress was perceived as being elsewhere. So, duration is the relevant cue for stress perception if stress is on the antepenultimate or final syllable, rather than penultimate syllable. In this study, the target vowels are always in the penultimate syllable. However, they are also in the initial syllable, a confounding factor which can be solved by examining trisyllabic words. I leave this issue for future research.
The results also suggest that the acoustic cues for stress production are not necessarily the same for stress perception. From the production side, duration functions as an acoustic correlate for stress in EP (though in a limited way). From the perception side, EP speakers are not able to perceive stress contrast when the effect of duration is present, thus showing a stress ‘deafness’ effect (see the discussion above).Footnote 6 The mismatch between the acoustic cues used for stress production and perception is also found in other languages. For example, Gonzalez (Reference Gonzalez1970) reports that Tagalog uses f0, duration, and intensity to signal lexical stress. However, Hwang, Nagaya & Villegas (Reference Hwang, Nagaya and Villegas2019) argue that intensity does not play a crucial role in stress perception. Crucially, Chrabaszcz et al. (Reference Chrabaszcz, Winn, Lin and Idsardi2014) argue that acoustic cues are generally free to vary, and their utility for determining word stress is likely constrained to relative change across the word given a particular speech context. For example, a short duration is short only in the context of a longer duration. Therefore, the acoustic cues to stress must be derived from comparisons across syllables. Lastly, it is possible that vowel reduction (or vowel quality) serves as a dominant cue in the production and perception of word stress in EP because vowel quality is more independent from the influence of other incidental speech characteristics (see Correia et al. Reference Correia, Frota, Butler and Vigário2013, Reference Correia, Butler, Vigário and Frota2015). I leave this issue for future investigation.
One limitation of the study is the use of disyllabic words. In EP, prosodic word-initial position is the locus of potential phonological processes, including initial stress, emphatic stress, and initial /ɾ/-strengthening (Vigário Reference Vigário2003: Chapter 3 and references cited therein). The nonce words in this study are all disyllabic, and the syllables acoustically analyzed are in prosodic word-initial position. Thus, it is possible that the target vowels are influenced by the processes mentioned above. Note that both initial stress and emphatic stress are optional. Initial stress is more frequent in Intonational Phrase-initial position (Frota & Vigário Reference Frota2000). Domain-initial strengthening is also more likely initially in higher prosodic domains (Georgeton & Fougeron Reference Georgeton and Fougeron2014 and references cited therein). In the current experiment, the frame sentences were designed to avoid target words in Intonational Phrase-initial position. In this way, it is hoped that the effects of initial stress and initial strengthening have been minimized.
Finally, the discussion and results above underscore the importance and challenges of teasing apart the influence of stress-referring phonological processes (like vowel neutralization and intonation) on the same acoustic factors that realize stress (as emphasized by Roettger & Gordon Reference Roettger and Gordon2017). For EP, it was crucial to find environments where phonological vowel reduction did not occur, and speakers who did not mark stressed syllables with pitch accents.
6 Conclusion
This study has determined which acoustic measures correlate with stress in EP. The results indicate that stressed vowels can have greater duration relative to their unstressed counterparts. However, participants differ as to whether they use duration to signal stress, and for which vowels. In addition to its implications for our understanding of how stress is realized cross-linguistically, this study provides a foundation for future work on languages which realize stress at both phonetic and phonological levels. Though limited to disyllabic words, this study controlled the phonological environment of the stimuli to avoid obscuring effects of phonological processes so that stressed and unstressed vowels with the same quality could be directly compared. Finally, this study attempted to disentangle word-level stress and phrase-level influences to reflect genuine word stress rather than phrasal prominence.
Acknowledgements
I wish to thank Paul de Lacy for helpful discussion at various stages of this research. I am grateful to the associate editor Oliver Niebuhr and two anonymous reviewers for their very thorough and insightful reviews. I want to thank Matt Gordon and Yi-Yang Cheng for hosting me while I conducted the experiment at the University of California, Santa Barbara. I thank my research assistants Angela Chen, Lily Xu, and Tzu-Ping Hung for contributing to the acoustic analysis. This research was supported by the National Science and Technology Council, Taiwan (grant number: 110-2410-H-002-003). All errors are my own.
Appendix. Experiment stimuli
Table A1 /CVCa/ words. Note that each word has two stress-alternating forms: ![]() and
and ![]() . Vowel reduction occurs in unstressed syllables.
. Vowel reduction occurs in unstressed syllables.

Note: Pota is a native word in EP. However, data from the Corpus do Português database (Davies Reference Davies2016), containing 326,648,351 words from web pages, shows that pota occurs only 77 times in the corpus. So, pota is considered a low-frequency word.
Table A2 /CVlCa/ words. Note that each word has two stress-alternating forms: ![]() and
and ![]() . Vowel reduction is blocked when a syllable ends with /l/.
. Vowel reduction is blocked when a syllable ends with /l/.
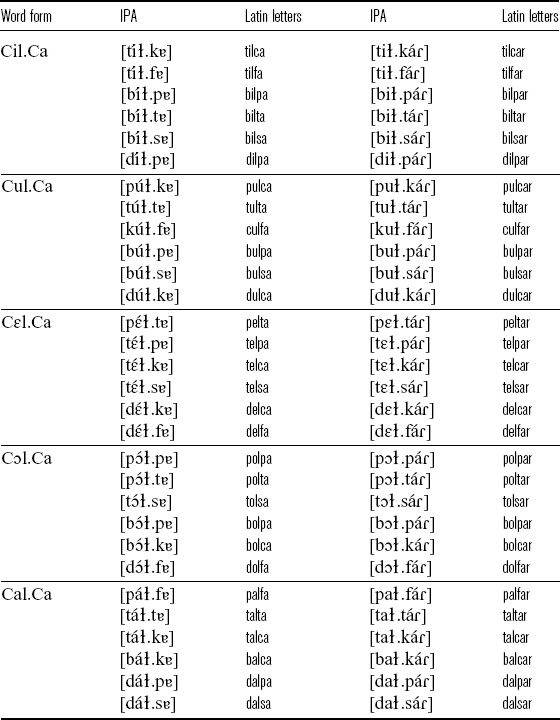


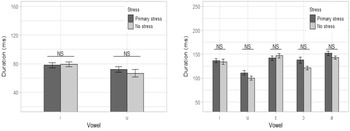


 Open access