


Introduction
A visual scene can be perceived feature-by-feature or as a whole. Healthy people typically show a global processing bias: the “whole” is processed before its parts (Han & Humphreys, Reference Han and Humphreys2002; Kimchi, Reference Kimchi1992; Lamb et al., Reference Lamb, Robertson and Knight1989; Robertson et al., Reference Robertson, Lamb and Knight1988). This global bias changes with age, reducing the size of the ‘attentional spotlight’ and/or the ability to process local and global information simultaneously (Oken et al., Reference Oken, Kishiyama, Kaye and Jones1999; Slavin et al., Reference Slavin, Mattingley, Bradshaw and Storey2002; Roux & Ceccaldi, Reference Roux and Ceccaldi2001; Scailquin & Bruyer, Reference Scailquin and Bruyer2000). The ability to process information at either the local or global level, or to process local and global information simultaneously, can be impaired following brain damage. Typically, associations have been found between right hemisphere pathology and impaired global processing, and left hemisphere pathology and impaired local processing (Delis et al., Reference Delis, Robertson and Efron1986; Lamb et al., Reference Lamb, Robertson and Knight1989, Reference Lamb, Robertson and Knight1990; Lux et al., Reference Lux, Thimm, Marshall and Fink2006; Robertson et al., Reference Robertson, Lamb and Knight1988; Robertson & Delis, Reference Robertson and Delis1986; see for a review Robertson & Lamb, Reference Robertson and Lamb1991). Changes in local or global processing could have implications for higher cognitive functioning, and can in extreme cases result in visuo-perceptual disorders such as simultanagnosia or prosopagnosia (Dalrymple et al., Reference Dalrymple, Kingstone and Barton2007; Doricchi & Incoccia, Reference Doricchi and Incoccia1998; Morihara et al., Reference Morihara, Higashiyama, Asano, Matsunaga, Takahashi, Miyake, Tanaka, Joki, Doi, Takeuchi and Tanaka2021; Rentschler et al., Reference Rentschler, Treutwein and Landis1994). Nevertheless, local and global processing biases are not evaluated as part of standard cognitive assessment, and it is unknown how often such impairments occur or how they relate to more commonly assessed cognitive impairments.
The primary aims of this exploratory study were to first assess the prevalence of abnormal local and global biases in a stroke population admitted to inpatient rehabilitation, and second to assess the previously reported relations between right hemisphere pathology and global processing deficits, and left hemisphere pathology and local processing deficits.
A secondary aim was to explore potential implications of abnormal local and global interference by assessing their associations to other cognitive domains, such as lateralized attention (visuospatial neglect), visual search organization, search speed, visuo-construction, executive functioning, and verbal (working) memory. Even though some relations have been reported between global or local processing impairments and visuospatial neglect (Lux et al., Reference Lux, Thimm, Marshall and Fink2006), spatial visualization (Kramer et al., Reference Kramer, Blusewicz, Kaplan and Preston1991; Delis et al., Reference Delis, Massman, Butters, Salmon, Shear, Demadura and Filoteo1992), visuo-spatial orientation (Basso & Lowery, Reference Basso and Lowery2004), and visuo-construction (Deckersbach et al., Reference Deckersbach, Savage, Henin, Mataix-cols, Otto, Wilhelm, Rauch, Baer and Jenike2000; Lange et al., Reference Lange, Waked, Kirshblum and DeLuca2000; Savage et al., Reference Savage, Baer, Keuthen, Brown, Rauch and Jenike1999; Shorr et al., Reference Shorr, Delis and Massman1992), there are no insights on the relations between local and global interference effects and the different cognitive domains in a large sample, using a within-subject design.
Whether a particular element is considered a whole or a detail depends on the perspective. In studying local and global processing, nested hierarchical structures such a Navon figures are typically used (Robertson & Delis, Reference Robertson and Delis1986). Navon figures consist of a large letter or shape (i.e., global level) composed of smaller letters or shapes (i.e., local level; Navon, Reference Navon1977). In the current study, local and global bias and interference were measured by briefly presenting a Navon figure after which participants were asked to identify a target letter at either the global or local level (i.e., directed attention). We additionally measured divided attention by having participants identify targets that could appear at either the local and global level, to assess the ability to allocate attention to local and global information simultaneously. We included a larger sample of stroke patients (N = 192) compared to previous studies (i.e., N = 12 to 24), allowing us to control for potential confounders (i.e., age and sex; Kramer et al., Reference Kramer, Ellenberg, Leonard and Share1996; Oken et al., Reference Oken, Kishiyama, Kaye and Jones1999; Slavin et al., Reference Slavin, Mattingley, Bradshaw and Storey2002).
Method
Participants
We retrospectively used routinely collected data of stroke patients who were admitted for inpatient rehabilitation in De Hoogstraat Rehabilitation center, the Netherlands, between September 2014 and July 2017. Inclusion criteria for the current study were (1) clinical diagnosed symptomatic stroke, first or recurrent, verified by magnetic resonance imaging (MRI) and/or computed tomography (CT) data, (2) sufficient comprehension of task instructions (as assessed by a rehabilitation physician), (3) normal or corrected-to-normal visual acuity, and (4) availability of data for at least one of the hierarchical processing tasks.
Healthy participants were recruited among relatives and friends of the staff. They were given a reimbursement of (travel) expenses. Inclusion criteria were (1) being ≥40 years, aiming to obtain a control group with a similar age distribution as the stroke group, (2) no history of neurological or psychological disorders, and (3) normal or corrected-to-normal visual acuity. Data of the healthy control group were used to determine cut-off scores for the hierarchical processing tasks.
Procedure and tests
At admission, a rehabilitation physician noted demographic and stroke-related characteristics. Patients were invited for a neglect assessment (including the hierarchical processing tasks) and a general neuropsychological assessment, both as part of usual care. From these assessments, the tasks that were administered in most patients were selected for the current study. Not all tasks were administered in each patient due to, for example, fatigue or language impairments. The research was performed in accordance with the standards of the Declaration of Helsinki. Data was collected as usual care. Upon admission, patients were aware that their anonymized clinical data may be used for research purposes and had the option to ‘opt out’.
Demographic and stroke-related characteristics
The following data were obtained on admission to the rehabilitation centre: age, sex, handedness, days post-stroke at the time of admission to rehabilitation (with respect to the latest stroke), stroke history (first, recurrent), stroke type (ischaemic, intracerebral haemorrhagic, subarachnoid haemorrhagic), lesioned hemisphere (left, right, both), level of independence during daily life activities (Barthel Index; Collin et al., Reference Collin, Wade, Davies and Horne1988), strength in the upper and lower extremities (Motricity Index; Collin & Wade, Reference Collin and Wade1990), global cognitive functioning (Montreal Cognitive Assessment [MoCA]; Nasreddine et al., Reference Nasreddine, Phillips, Bédirian, Charbonneau, Whitehead, Collin, Cummings and Chertkow2005), and quality of communication (“Stichting Afasie Nederland”; Deelman et al., Reference Deelman, Koning-Haanstra, Liebrand and van den Burg1981).
Hierarchical processing tasks
Hierarchical visual processing was assessed by a divided and directed attention task, based on the study of Bultitude et al. (Reference Bultitude, Rafal and List2009). Stimuli were Navon figures that consisted of one large letter composed of smaller letters. Participants were presented with a printed example stimulus while the task was being explained.
In the divided attention task, participants were instructed to indicate whether the letter ‘A/a’ or ‘S/s’ was present on the screen regardless of the level (either the large letter or the small letters). There were eight unique stimuli in the divided attention task: four for the local (Ha, Ea, Hs, Es) and four for the global condition (Ae, Ah, Sh, Se; Figure 1a). Conditions were randomized within blocks. All participants started with the divided attention task, to prevent any carry-over effects which could cause a bias in which level was attended most.
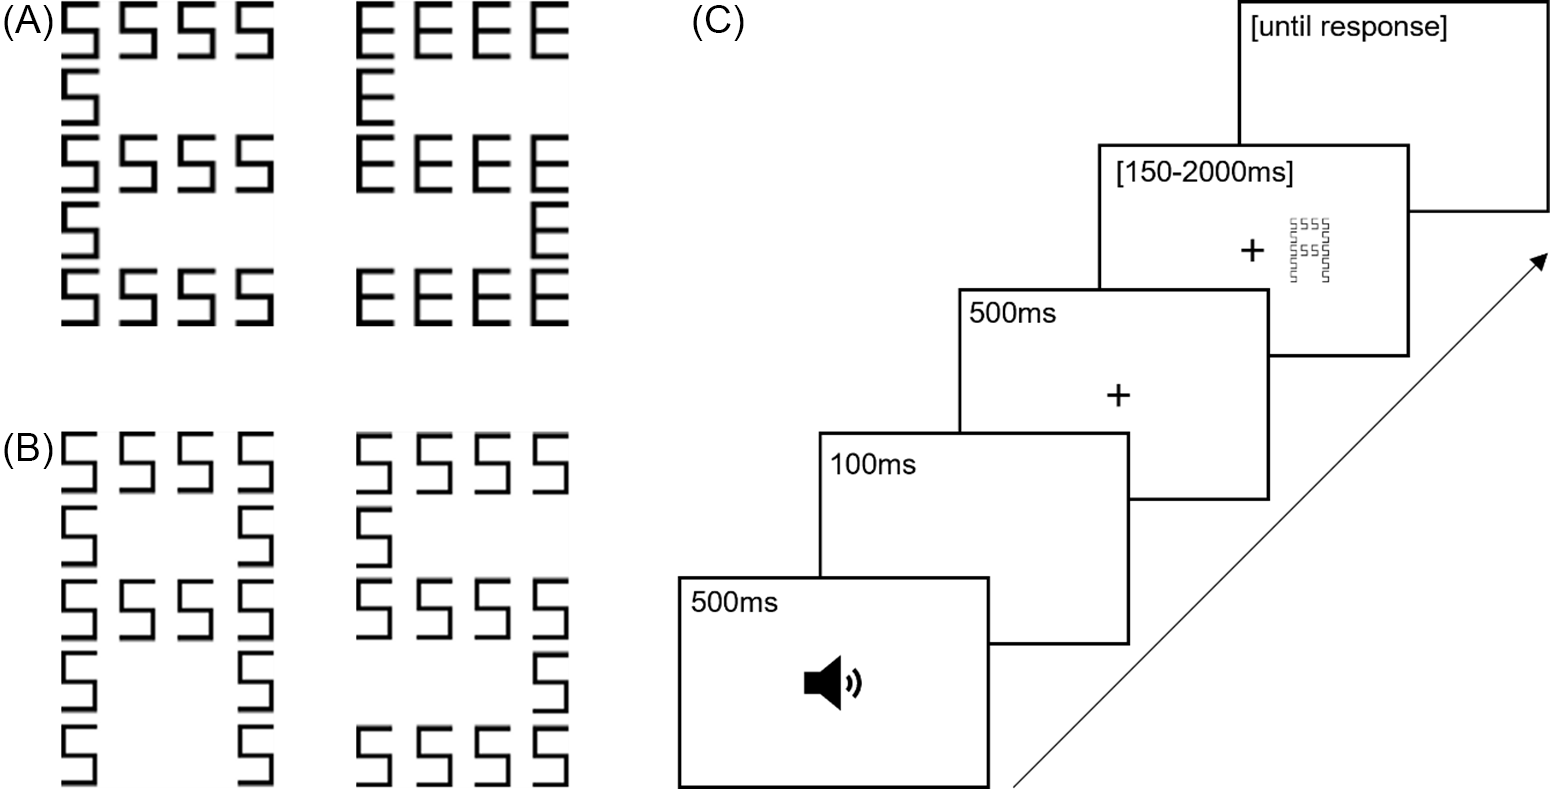
Fig. 1. (a) Example stimuli used in the divided attention task. (b) Example incongruent (left-hand figure) and congruent (right-hand figure) stimuli used in the directed attention task. (c) Time course of one trial in the hierarchical processing tasks.
In the local and global conditions of the directed attention task, participants were asked to attend to local and global levels in separate blocks. In the local condition, participants had to indicate whether the small letters consisted of letters ‘a’ or ‘s’. In the global condition, participants had to indicate whether the large letter was a letter ‘A’ or ‘S’. There were four unique stimuli in the directed attention task: two congruent (i.e., same letters on both the global and local level; Aa, Ss) and two incongruent (i.e., different letters on the global and local level; As, Sa; Figure 1b). The order of the local and global conditions in the directed attention task was counterbalanced between participants.
A computer screen was positioned 60 cm from the participant’s eyes. Stimuli were black on a white background. Eye movements were allowed during the entire task. A trial started with a 500-Hz tone presented for 500 ms (Figure 1c). After a delay of 100 ms, a central fixation cross (3 × 3 mm) appeared. After 500 ms, the stimulus was presented left or right with respect to central fixation, in such way that there was 2.4 cm between the fixation cross edge and the inner edge of the stimulus. The stimuli consisted of 14 small letters (4 × 6 mm; local letters) arranged to form one large letter (25 × 38 mm; global letter). A trial ended by a response, followed by an inter-trial interval of 1000 ms. Participants had to provide a response by pressing a green or red button (i.e., the ‘b’ and ‘n’ keys on a keyboard with green and red stickers). Which key belonged to which letter was counterbalanced between participants, and did not change between tasks or conditions. A piece of paper with the letters on it and an arrow pointing out the key that belonged to this letter was present above the keyboard as a reminder throughout the task. Participants were instructed to respond as accurately as possible. There was unlimited time to make a response.
Prior to each task, there were 12 practice trials with randomly chosen stimuli which remained on screen until a response was made. The divided task, and each of the two conditions in the directed task consisted of 6 blocks with 8 trials, resulting in a total of 48 trials. Per block, each unique stimulus of the divided attention task was presented once, for each condition of the directed attention task each unique stimulus was presented twice. Within each block, half of the stimuli were presented left and the other half right relative to the fixation cross, in a random order.
A staircase procedure was used to determine the stimulus duration. The staircase eliminated some of the differences in processing speed between participants to ensure that all patients had enough time to identify the target letter. In the first block, the stimulus duration was 1000 ms. The stimulus duration in a consecutive block decreased if <3 errors were made, and increased if ≥3 errors were made. Possible stimulus durations were fixed: 2000, 1500, 1000, 750, 500, 250, and 150 ms. When ≥3 errors were made during two consecutive blocks with the longest stimulus duration (i.e., 2000 ms), the task was terminated. Each participant therefore completed at least four blocks (32 trials) up to a maximum of six blocks (48 trials). See Supplementary Tables 1–3 for the minimum stimulus durations. Per task (i.e., divided attention, directed attention) and condition (i.e., local, global) the percentage of errors was computed based upon all available blocks.Footnote 1
For both the directed and divided attention tasks, a bias score was computed (=% errors local condition-% errors global condition), resulting in a bias score ranging from −100% to 100%. Positive scores indicated that more errors were made in the local versus global condition (i.e., global bias), negative scores indicated that more errors were made in the global versus local condition (i.e., local bias).
For the directed attention task, global interference was computed by assessing the difference between the percentage of errors for the congruent and incongruent trials in the local condition (=% errors incongruent local condition-% errors congruent local condition), and local interference was computed by assessing the difference between the percentage of errors for the congruent and incongruent trials in the global condition (=% errors incongruent global condition-% errors congruent global condition). Higher scores indicated more interference from the irrelevant level.
Neuropsychological assessment
A selection of conventional neuropsychological tasks was used. Visuospatial neglect/lateralized inattention was assessed with the Catherine Bergego scale (total score; Azouvi et al., Reference Azouvi, Olivier, de Montety, Samuel, Louis-Dreyfus and Tesio2003; Ten Brink et al., Reference Ten Brink, Nijboer, Van Beekum, Van Dijk, Peeters, Post and Visser-Meily2013), line bisection test in near and far space (deviation; Van der Stoep et al., Reference Van der Stoep, Visser-Meily, Kappelle, de Kort, Huisman, Eijsackers, Kouwenhoven, Van der Stigchel and Nijboer2013), Balloons Test (laterality score of subtest B; Edgeworth et al., Reference Edgeworth, Robertson and McMillan1998), and shape cancellation task with and without feedback (Centre of Cancellation; CoC-X). The shape cancellation task was additionally used to assess search organization (intersections rate; Dalmaijer et al., Reference Dalmaijer, Van der Stigchel, Nijboer, Cornelissen and Husain2015; Ten Brink et al., Reference Ten Brink, Van der Stigchel, Visser-Meily and Nijboer2016, Reference Ten Brink, Visser-Meily and Nijboer2018). The Trail Making Test (TMT)-A and TMT-B subtests were used to examine search speed (duration), and a corrected score for the TMT-B subtest to assess switching (TMT-ratio; Bouma et al., Reference Bouma, Mulder, Lindeboom and Schmand2012). Visuospatial perception/visuo-construction was asssessed with the Rey Complex Figure Test copy (total score; Bouma et al., Reference Bouma, Mulder, Lindeboom and Schmand2012; Rey, Reference Rey1941), the Tower Test to assess spatial planning (total score; Delis et al., Reference Delis, Kaplan and Kramer2007), the Brixton Spatial Anticipation Test (‘Brixton Test’) to assess rule switching/spatial prediction (errors; Burgess & Shallice, Reference Burgess and Shallice1997), the Digit Span Forward to asses short-term verbal memory, and Backward to assess verbal working memory (longest sequence; Wechsler, Reference Wechsler2012). The Rey Auditory Verbal Learning Test (RAVLT) was used to measure long-term verbal memory (immediate recall score, delayed recall score, and recognition score; Bouma et al., Reference Bouma, Mulder, Lindeboom and Schmand2012). See Supplementary Material (Appendix A) for detailed task descriptions.
Statistical analyses
Analyses were carried out in IBM SPSS Statistics version 23. The level of significance was set at alpha = .05. Eta-squared (η2) was reported as effect size for ANOVA’s. Effect sizes for Mann Whitney tests were computed with the Pearson correlation coefficient using the following formula: r = Z/√N (Rosenthal, Reference Rosenthal, Cooper and Hedges1994). Effect sizes of >.10 were considered to reflect a small, >.30 a medium, and >.50 a large effect (Field, Reference Field2013). Spearman’s rho was interpreted as small, >.10, moderate, >.30, large, >.50, or very large, >.70 (Dancey & Reidy, Reference Dancey and Reidy2004).
Demographic and stroke-related characteristics
Age, sex, and handedness were compared between stroke patients and healthy controls using t-tests and Chi-square tests. Descriptive data were provided regarding stroke-related characteristics.
Local and global bias in stroke patients
The local and global bias scores of healthy controls were used to define normal ranges. Because there is no existing standard for what constitutes normal ranges for this task, we calculated these based on two commonly used margins: the mean ±2 SD and the mean ±3 SD. Bias scores outside these ranges were labeled as ‘abnormal local bias’ (i.e., more errors in the global versus local condition) or ‘abnormal global bias’ (i.e., more errors in the local versus global condition). Descriptive data were provided on the percentages of stroke patients with an abnormal local or global bias in the directed and divided attention tasks, based upon both cut-offs.
Spearman correlations were conducted between the bias scores at the directed and divided attention tasks to obtain insight into whether performances in the directed and divided attention tasks were related to each other.
Local and global bias and interference in left- versus right-brain damaged stroke patients
Patients with left- and right-brain damage were compared regarding their local and global bias score in the directed and divided attention tasks, and regarding their local and global interference scores in the directed attention task. Only a subset of the population, namely stroke patients with unilateral lesions and no known recurrent stroke, was included in this analysis (left-sided lesion: n = 46, 67; right-sided lesion: n = 48, 66; for the directed and divided attention tasks respectively).
For the bias scores at the directed and divided attention tasks, we conducted two one-way ANOVAs with lesion side (left, right) as between subjects-factor. For the interference scores at the directed attention task, a repeated measures ANOVA was conducted with lesion side (left, right) as between subjects-factor and interference level (local, global) as within-subjects factor. A supplementary repeated measures ANOVA was conducted with presentation side (left, right) as additional within-subjects factor. Finally, a supplementary repeated measures ANOVA was conducted with RT as dependent variable. Age and sex were included as covariates for all analyses.
Sensitivity analyses were performed using non-parametric Mann–Whitney U tests, for all blocks and for the first block only (i.e., with a stimulus duration of 1000 ms for all patients).
Relations between local and global interference with other cognitive functions
To obtain insight into implications of local and global interference, and implications of inability to simultaneously attend the local and global level, we conducted Spearman correlations between the local and global interference scores in the directed attention task,Footnote 2 the absolute bias score in the divided attention task (as a measure of inability to simultaneously attend the local and global level, regardless of whether there was a local or global bias), and neuropsychological outcome measures. Because for many patients data on one or more tasks was missing, we used the option ‘Exclude cases pairwise’. Correlations were interpreted before and after Bonferroni correction for 19 comparisons.
Results
Demographic and stroke-related characteristics
A total of 489 stroke patients received a neglect assessment within the specified time frame. Of these, 204 were excluded because they did not complete any of the hierarchical processing tasks.
A subset of patients (n = 22, 7.75%) made a relatively large number of errors in the congruent trials of the directed attention task. This suggests that these patients were not able to perform the task according to the provided instructions. This is likely not, or not only, due to a global or local processing bias, in which case no or little errors are expected in congruent trials. Possibly, other cognitive deficits interfered with task performance, such as deficits in primary visual perception, language, or executive functioning. We decided to exclude patients who made ≥20% errors in the congruent trials of either the local or global condition of the directed attention task. Of the remaining 263 patients, 192 completed the directed, and 258 the divided attention task. For our second aim, we included a subset of patients with first ever, unilateral stroke (left-sided: n = 69; right-sided: n = 67).
A total of 35 healthy participants were included, of whom one only completed the directed attention task. Stroke patients and controls did not differ regarding sex, χ2(1) = 2.41, p = .121, handedness, χ2(1) = 1.27, p = .260, or age, t(295) = −1.68, p = .094 (Table 1).
Table 1. Demographic and stroke-related characteristics, mean (SD) or percentage (n), split for healthy controls (n = 35), all stroke patients (n = 263), stroke patient with left-sided unilateral damage after a first stroke (n = 69) and patients with right-sided unilateral damage after a first stoke (n = 67)
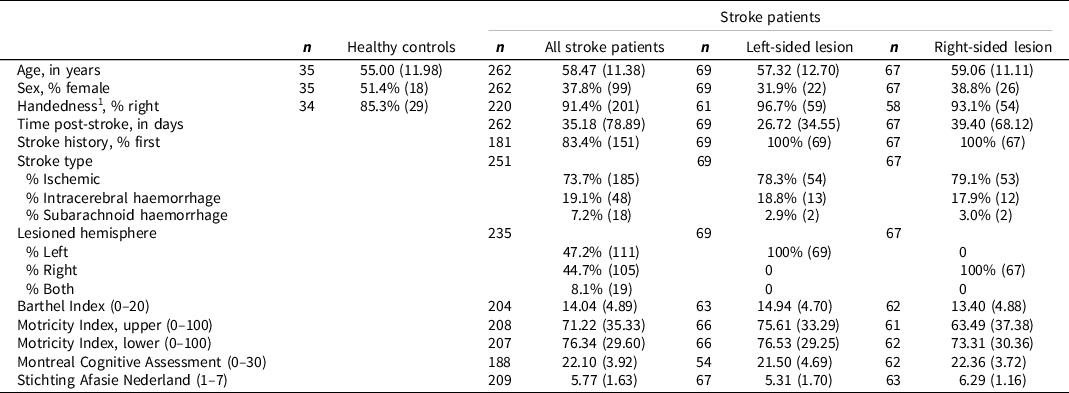
1 None of the controls and four stroke patients were ambidextrous. They were combined with the left-handed group for the statistical comparison because of the small group size.
Local and global bias in stroke patients
The bias scores and interference scores for the directed and divided attention tasks are listed in Table 2, split for controls and stroke patients.
Table 2. Bias scores in the directed and divided attention tasks, and interference scores in the directed attention task, split for healthy controls, stroke patients, and stroke patients with unilateral left-sided and right-sided lesions after a first stroke. Means (SD) are depicted, and percentages (n) stroke patients who obtained abnormal scores based upon the mean ±2 SD or ±3 SD of healthy controls. Positive bias scores indicate a global bias, negative bias scores indicate a local bias. Positive interference scores indicate more interference for the given level. None of the scores are corrected for age and sex
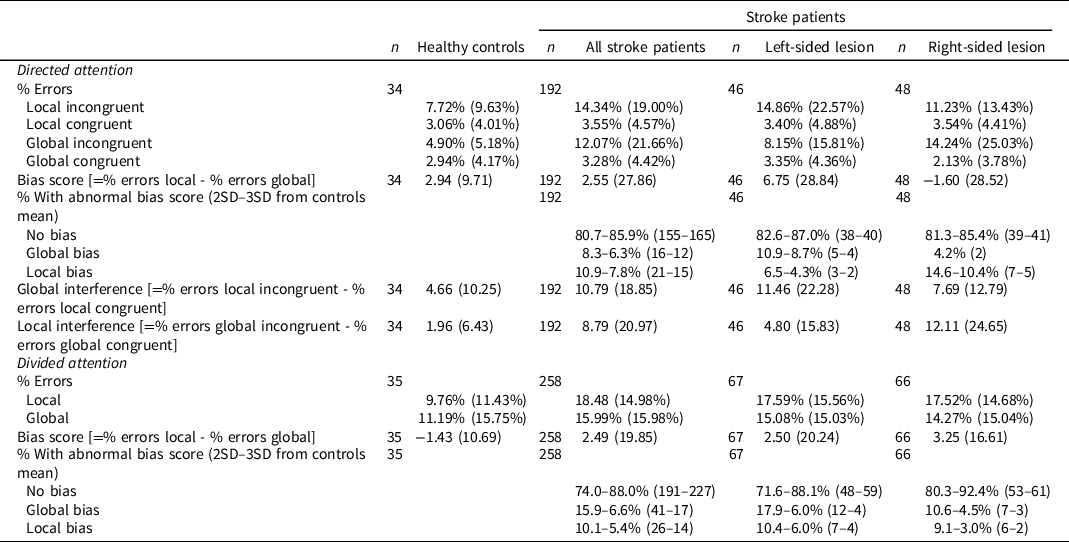
In the directed attention task, 155–165 (80.7–85.9%) stroke patients did not show any abnormal bias, 15–21 (7.8–10.9%) showed an abnormal local bias, and 12–16 (6.3–8.3%) showed an abnormal global bias (Figure 2A). In the divided attention task, 191–227 (74.0–88.0%) stroke patients did not show any abnormal bias, 14–26 (5.4–10.1%) showed an abnormal local bias, and 17–41 (6.6–15.9%) showed an abnormal global bias (Figure 2B). Boxplots depicting the error rates for the different conditions per bias group are provided in Supplementary Figure 1.
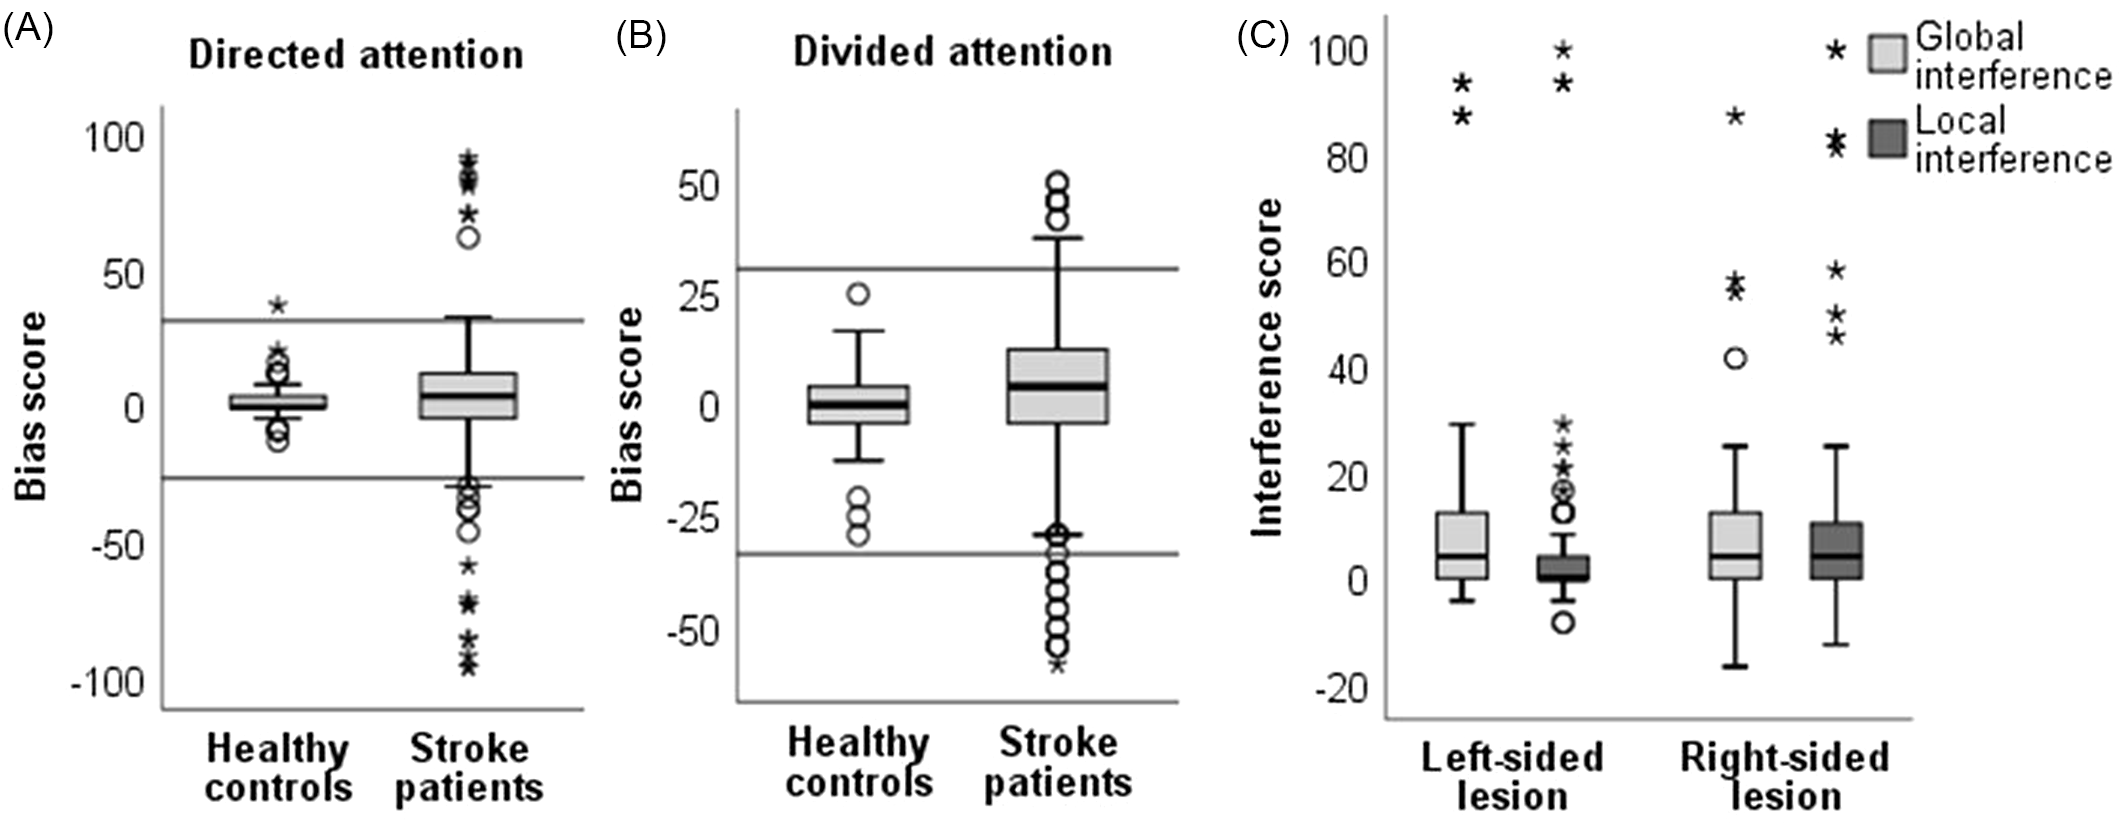
Fig. 2. Boxplots depicting bias scores (= % errors local condition – % errors global condition) for (A) the directed attention task, split for healthy controls (n = 34) and stroke patients (n = 192), and (B) the divided attention task, split for healthy controls (n = 35) and stroke patients (n = 258). Positive bias scores reflect more errors in the local vs. global condition (i.e., global bias), negative scores reflect more errors in the global vs. local condition (i.e., local bias). The horizontal lines indicate the normal range based on the mean ± 3 SD of scores obtained by healthy controls. (c) Boxplots depicting interference scores (= % errors incongruent – % errors congruent; either for the local or global condition) in the directed attention task. Scores are split for stroke patients with left-sided (n = 77) and right-sided lesions (n = 80). None of the scores are corrected for age and sex. The thick line in the middle is the median. The top and bottom box lines show the first and third quartiles. The whiskers show the maximum and minimum values, with the exceptions of outliers (circles) and extremes (asterisks).
Having a local or global bias when attention had to be directed towards one level was moderately related to having a local or global bias when attention had to be divided between levels, r = .42, p < .001 (n = 221).
Local and global bias and interference in left- versus right-sided brain damaged stroke patients
In the directed attention task, there was no main effect of lesion side, i.e., there were no differences in the ability to direct attention towards local or global information between patients with left- versus right-sided brain damage, F(1) = 3.51, p = .064, η2 = 0.04 (i.e., based on the bias score). Sensitivity analyses based on data from the entire task (U = 1031, z = −0.56, p = .579, r = −0.06), or the first block (U = 976.5, z = −1.14, p = .253, r = −0.12), showed similar results.
In the directed attention task, there was no main effect of level of interference (i.e., local vs. global), F(1) = 2.13, p = .148, η2 = 0.02, and no main effect of lesion side, F(1) = 0.004, p = .948, η2= 0. There was an interaction effect between lesion side and level of interference, F(1) = 4.72, p = .032 (Figure 2C). Descriptively, there was more global interference (i.e., in line with a global bias) in patients with left-sided brain damage, and more local interference (i.e., in line with a local bias) in patients with right-sided brain damage. Post-hoc tests did not, however, show significant main effects for level of interference for patients with left-sided lesions, F(1) = 0.19, p = .665, η2 = 0, nor for patients with right-sided lesions, F(1) = 3.47, p = .069, η2 = 0.07. Supplementary analyses showed that there was no interaction with presentation side (see Supplementary Material; Appendix C). Supplementary analyses of RT did not yield differences between groups, although these should be interpreted with caution because the task was not designed to optimally measure RT (see Supplementary Material, Appendix C).
In the divided attention task, there was no main effect of lesion side, i.e., patients with left- and right-sided brain damage showed similar patterns in the ability to divide attention between local and global information, F(1) = 0.06, p = .802, η2 = 0 (i.e., based on the bias score). Sensitivity analyses based on data from the entire task (U = 2190, z = −0.10, p = .924, r = −0.01), or the first block (U = 2089.5, z = −0.57, p = .567, r = −0.05), showed similar results.
Relations between local and global interference with other cognitive functions
Global interference in the directed attention task showed a moderate positive correlation with slower visual search, which survived the Bonferroni correction (Table 3). There were small positive correlations, that did not survive the correction, between global interference and lateralized inattention, disorganized search, reduced rule switching/spatial prediction, and reduced verbal working memory. The relation with lateralized inattention seemed to be driven by a leftward attention bias (Supplementary Table 4).
Table 3. Spearman correlation coefficients between local and global interference scores derived from the directed attention task, the absolute bias score derived from the divided attention task, and performance at several neuropsychological tasks. Higher interference scores indicated more interference from the irrelevant level in the directed attention task (i.e., higher local interference scores indicate a stronger local bias; higher global interference scores indicate a stronger global bias). Higher absolute bias scores in the divided attention task indicate more difficulties with attending the local and global level simultaneously. For the neuropsychological tasks, higher scores indicate poorer performance (except for the Balloons Test, Rey Complex Figure Test, Tower Test, WAIS Digit Span, and RAVLT; for which lower scores indicate poorer performance)
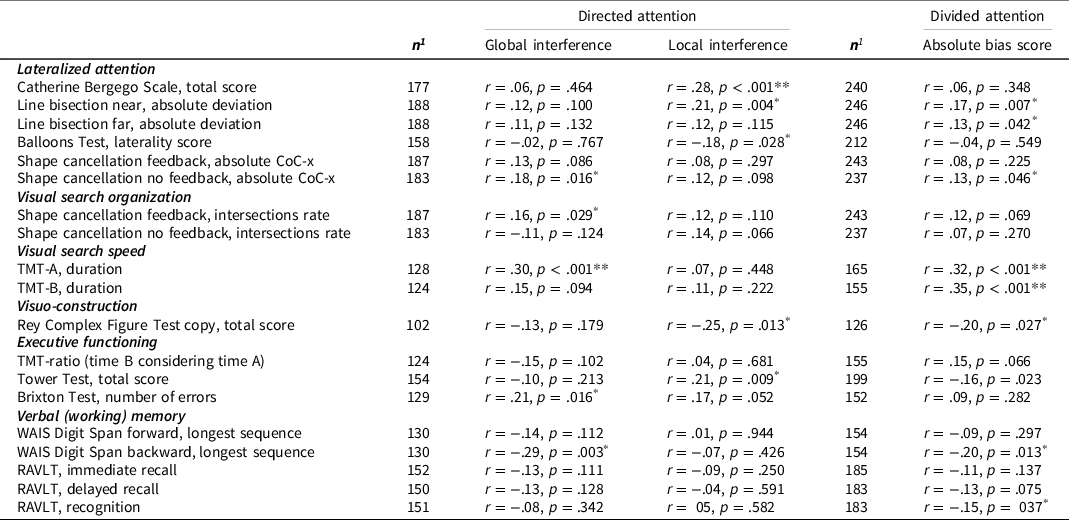
Abbreviations. CoC-x, horizontal centre of cancellation; RAVLT, Rey Auditory Verbal Learning Test; TMT, Trail Making Test; WAIS, Wechsler Adult Intelligence Scales.
1 Group sizes differ between measures since not all patients performed all neuropsychological tasks.
* Significant with alpha = 0.05; ** significant with alpha = 0.05 after Bonferroni correction (alpha of .05/19 correlations = .0026).
Local interference in the directed attention task showed small positive correlations with neglect in daily life, lateralized inattention, poorer visuo-construction, and spatial planning. The correlation between local interference and neglect in daily life was the only correlation surviving the Bonferroni correction.
Inability to attend the local and global level simultaneously showed moderate positive correlations with slower visual search, which survived the Bonferroni correction. There were small positive correlations, that did not survive the correction, between inability to attend the local and global level simultaneously and lateralized inattention (line bisection, shape cancellation), poorer visuo-construction, reduced verbal working memory, and reduced recognition.
Discussion
The size of the ‘attentional spotlight’ can change as a result of brain damage following stroke. In the current study, based upon directed attention performance, 7.8–10.9% of stroke patients showed an abnormal local bias and 6.3–8.3% an abnormal global bias. Regarding divided attention, 5.4–10.1% of stroke patients showed an abnormal local bias and 6.6–15.9% an abnormal global bias. In the latter task, difficulty in switching between levels could have caused abnormal performance for divided attention, in addition to, or rather than a deficit in local or global processing per se (Flevaris et al., Reference Flevaris, Bentin and Robertson2011; Robertson, Reference Robertson1996).
Although left and right hemisphere damaged patients experienced the same degree of interference on the local and global conditions of the directed attention task, descriptively, there was a significant interaction between lesion side and level of interference (i.e., global vs. local), with more global interference observed after left-sided brain damage and more local interference observed after right-sided brain damage, although post-hoc tests were not significant. The pattern is in line with the previously found associations between right hemisphere pathology and impaired global processing, and left hemisphere pathology and impaired local processing (Delis et al., Reference Delis, Robertson and Efron1986; Lamb et al., Reference Lamb, Robertson and Knight1989, Reference Lamb, Robertson and Knight1990; Lux et al., Reference Lux, Thimm, Marshall and Fink2006; Robertson et al., Reference Robertson, Lamb and Knight1988; Robertson & Delis, Reference Robertson and Delis1986; see for a review Robertson & Lamb, Reference Robertson and Lamb1991), and a similar lateralization in healthy people (Christie et al., Reference Christie, Ginsberg, Steedman, Fridriksson, Bonilha and Rorden2012; Flevaris & Robertson, Reference Flevaris and Robertson2016; although not always found; Kimchi, Reference Kimchi1992; Lamb et al., Reference Lamb, Robertson and Knight1989). The fact that we did not replicate previous findings might relate to differences between studies in the selection criteria of patients and/or stimuli used. For instance, Delis et al. (Reference Delis, Robertson and Efron1986) and Robertson and Delis (Reference Robertson and Delis1986) studied local and global processing bias in left and right brain damaged patients (3 weeks post-trauma) using both linguistic and non-linguistic hierarchical figures, but did not look at particular lesion locations. Lesion locations were taken into account by Robertson, Lamb, and Knight (Lamb et al., Reference Lamb, Robertson and Knight1989, Reference Lamb, Robertson and Knight1990; Robertson et al., Reference Robertson, Lamb and Knight1988), who used Navon figures to study global and local processing, but included patients at least 1 year post-trauma. Other studies included patients not only based upon lesioned hemisphere, but also based upon the presence of visuospatial neglect (Lux et al., Reference Lux, Thimm, Marshall and Fink2006; Peru & Chelazzi, Reference Peru and Chelazzi2008) or specific lesion locations that are related to visuospatial neglect (Bultitude et al., Reference Bultitude, Rafal and List2009). The findings in these studies can, therefore, not be solely attributed to the lesioned hemisphere because they could be related to visuospatial neglect.
The current results, based upon a much larger, and more representative sample as compared to previous studies, show that the relation between local or global processing bias and lesioned hemisphere is not robust and warrants further investigation. A reason for the inconsistency of the current results compared to observed patterns in previous studies could be the heterogeneity of lesion locations in the current sample. Possibly, due to involvement of broad neural networks in hierarchical processing, patterns of local and global processing deficits arise from a broad range of damage and are not restricted to one hemisphere. To provide more insight into the neural substrates of local and global processing, it would be informative to link global and local processing deficits to specific lesion locations (e.g., using lesion symptom mapping or lesion subtraction), the vascular territory involved, and/or lesion volume.
A secondary aim was to explore potential associations of local and global interference effects, and inability to simultaneously attend the local and global level, with other cognitive functions. Interestingly, patients who showed more global interference and/or the inability to simultaneously attend the local and global level were slower in their visual search. This relation could be explained in two directions. Possibly, reduced processing speed caused both an abnormal global processing bias (i.e., leading to global interference) and slow visual search. The global processing bias seen in healthy participants is often explained by the order of processing: information at the global level is processed first, at the initial stage of normal visual processing, and local information is processed thereafter (Han & Humphreys, Reference Han and Humphreys2002; Kimchi, Reference Kimchi1992; Lamb et al., Reference Lamb, Robertson and Knight1989; Navon, Reference Navon1977; Robertson et al., Reference Robertson, Lamb and Knight1988). If processing speed is reduced due to brain damage, it could be expected that more time is needed before local elements of a stimulus are processed. Since the viewing time of the stimulus was limited in the current study, reduced processing speed might result in abnormal global interference, whereas no relation between processing speed and local interference is expected. Contrary, slowed visual search might have been caused by abnormal global interference. Abnormal global interference might hamper the identification of individual local stimuli, resulting in longer completion times. Difficulties in systematically identifying local stimuli might also explain that patients with more global interference showed less organized search in a shape cancellation task.
When looking at the relations between local and global processing and lateralized spatial attention, our results were partly consistent with previous literature. Patients with more global and/or local interference, and or inability to attend the local and global level simultaneously, showed more lateralized inattention. This was not related to a leftward or rightward attention bias specifically, except for the relation between global interference and a leftward attention bias as measured with a cancellation task. In addition, patients with more local interference showed more neglect behavior in daily life, which was the only robust relation. Interestingly, impaired global processing has previously been hypothesized to contribute to the neglect syndrome, where patients fail to disengage from information at the local level and therefore not perceive the bigger picture (Bultitude et al., Reference Bultitude, Rafal and List2009; Lux et al., Reference Lux, Thimm, Marshall and Fink2006).
Trends for small positive relations were found between local and global interference, and the inability to attend the local and global level simultaneously, with other neuropsychological outcomes. Patients who showed more global interference showed more deficits in rule switching/spatial prediction, and reduced verbal working memory capacity; whereas patients with more local interference showed poorer visuo-construction, and reduced spatial planning. Patients with inability to attend the local and global level simultaneously showed poorer visuo-construction, reduced verbal working memory, and reduced recognition of verbal information. The relation between local interference and reduced visuo-construction is in line with previous studies. Copying a complex figure, for example the Rey Complex Figure, can be done according to a global-to-local approach versus drawing details one by one without an organization structure. More organizational approaches (i.e., global-to-local) are related to better performance, both for copying as for memory (Deckersbach et al., Reference Deckersbach, Savage, Henin, Mataix-cols, Otto, Wilhelm, Rauch, Baer and Jenike2000; Lange et al., Reference Lange, Waked, Kirshblum and DeLuca2000; Savage et al., Reference Savage, Baer, Keuthen, Brown, Rauch and Jenike1999; Shorr et al., Reference Shorr, Delis and Massman1992). It should be noted, however, that none of these relations survived the correction for multiple comparisons and should, therefore, be interpreted with caution.
Importantly, local or global processing biases, or problems with simultaneously attending the local and global level, are not considered to be unique disorders in isolation of other cognitive disorders or syndromes. Processing biases are behavioral phenomena that are the outcome of various processes and most likely related to a range of other syndromes, disorders, and conditions. For example, local or global biases could be manifestations of syndromes such as neglect, aphasia, dysexecutive syndrome, or Balint’s syndrome; or consequences of impaired visual search or processing speed. Alternatively, local or global biases might enhance, or result in, reduced processing speed of visual information, impaired visual search, or impaired visuo-construction. Investigating the relations between cognitive functions sheds lights on mechanisms of selective attention and consequences of stroke.
Strengths and limitations
A strength of the current study is the large sample size, which allowed us to study the frequency of abnormal local and global processing biases, and the associations between local and global interference effects and other cognitive functions. Furthermore, we included a sample that was representative of a stroke population admitted for inpatient rehabilitation without in- or excluding patients based upon lesion location, stroke type, cognitive functioning (e.g., presence/absence of visuospatial neglect), or mild language deficits. A drawback of including an unselected sample of patients is that it introduces variability on the aforementioned aspects, which may be particularly important when investigating cognitive deficits that may be cerebrally lateralized.
A second limitation of the study is the design of the hierarchical processing tasks. Staircase procedures were used to determine stimulus durations and thereby adjust tasks to the level of the patient. This was done to maximize task sensitivity with minimum task duration. A drawback of this procedure is that the stimulus durations differed between patients, making their performance less comparable. To overcome this, we ran sensitivity analyses using the first block in which the stimulus duration was the same for all patients, and similar results were obtained. However, this block only contained 8 trials and no firm conclusions can be drawn based upon this.
Third, the task design and task instructions did not allow computation of processing biases by using RTs. Because of the staircases, different stimulus durations were used between participants, which strongly influences RT. In addition, participants were not instructed to respond as fast as possible but to focus on accuracy. Therefore, we do not know whether participants tried to respond quickly.
Fourth, consistent information on primary visual deficits was not available. However, reduced visual acuity or visual field defects are not expected to relate to left or right hemispherical damage and would therefore not affect the comparison between left and right lesion groups.
Conclusion and future directions
Substantial prior research has investigated the lateralization and clinical relevance of global and local visual processing, however this is the first to do so in a large population. In an unselected sample of stroke patients in the subacute phase (∼1 month) post-stroke onset, 85.9%–88% of patients did not show any processing bias, 7.8%–5.4% showed an abnormal local processing bias, and 6.3%–6.6% showed an abnormal global processing bias in a directed or divided attention task, respectively. We found no significant differences between patients with left-sided versus right-sided brain damage regarding local or global interference scores, calling into question previous emphasis on the cortical lateralization of local and global processing.
There was a moderate positive relation between local interference and search speed, a moderate positive relation between the difficulty to simultaneously attend local and global levels and search speed, and a small positive relation between global interference and neglect in daily life, providing the first insights into potential clinical relevance of global and local processing deficits.
In the context of rehabilitation, a specific processing bias might require a different approach in assessment, psycho-education, and treatment. Further research is needed to scrutinize this in more detail. Future studies could include speeded tasks and evaluate RTs, and investigate neural correlates of hierarchical processing biases. To conclude, assessing processing biases after a stroke is important to understand why certain difficulties in cognitive functioning occur, but also potentially to focus on reducing any abnormal bias.
Supplementary material
The supplementary material for this article can be found at https://doi.org/10.1017/S1355617723000231
Acknowledgements
The authors declare that they have no conflict of interest. This work was supported by the NWO (Netherlands organization for Scientific Research) [Grant 451-10-013] to TCWN.
We would like to thank all participants who were willing to participate in this study, and psychologists in De Hoogstraat Rehabilitation for their time and participation. We thank the research assistants for their help in testing the participants.
Conflicts of interest
None.


 Open access