


Introduction
Despite decades of attention and research devoted to the implementation of public policies, a theory of implementation has remained elusive (O’Toole Reference O’Toole2000; Schofield Reference Schofield2001). Scholars have found little agreement on what explains success or failure in implementation, and research has become mired in an overabundance of variables and a dearth of comparable cases (Goggin Reference Goggin1986; O’Toole Reference O’Toole1986; Saetren Reference Saetren2005). The field largely abandoned the doom-and-gloom theme expressed in the case studies of the first generation of implementation research (see Pressman and Wildavsky Reference Pressman and Wildavsky1984), only to become embroiled in a persistent debate related to top-down or bottom-up models of implementation. Top-down advocates maintain that statutory characteristics and control at the top of the organisational hierarchy are responsible for implementation outcomes, whereas bottom-up scholars stress the influence of discretion at the local level for determining the ultimate shape of policies (Sabatier Reference Sabatier1986).
Attempting to break the top-down/bottom-up stalemate, several scholars have made efforts to synthesise the approaches into a unified model (Elmore Reference Elmore1985; Sabatier Reference Sabatier1986). Notably, Matland (Reference Matland1995) developed a 2×2 matrix of implementation processes based on whether policies demonstrated high or low levels of ambiguity and conflict. For each implementation process, he predicted whether top-down or bottom-up models would be superior. However, the appropriate model for policies defined by high ambiguity and high conflict was less clear. Matland suggests that a bottom-up approach would likely be superior but expresses more uncertainty than with the other implementation processes described in his typology.
Understanding implementation for these types of policies with both high conflict and ambiguity is important, however. Such policies are some of the most ambitious, resource-intensive efforts on the part of the public sector and include programmes designed to alleviate poverty and disparities and correct for historical injustices by redistributing money and influence. Determining the most appropriate implementation model for these complex policies is important for understanding what happens in the gap between policy intent and programme outcomes. This study intends to add to the implementation literature by examining a critical aspect of the Patient Protection and Affordable Care Act (ACA), which is a prominent recent example of a high-ambiguity and high-conflict policy per Matland’s classification.
I observe differences in outcomes between federally facilitated, state-based and state-federal partnership health insurance exchanges (HIE). Exchanges are online marketplaces where consumers can compare and purchase qualified health insurance plans. The ACA initially intended for each state to establish and manage its own exchange, providing state officials with considerable discretion on how exchanges would be structured and operate (Haeder and Weimer Reference Haeder and Weimer2013). The law also stipulated that the federal government would create exchanges in states that refused or chose not to do so themselves. In these types of exchanges, authority and decisionmaking were concentrated at the federal level to a much greater degree. Ultimately, when the exchanges were launched in late 2013, 27 exchanges were federally facilitated, 16 were state-based and the final seven were implemented in partnership between the federal and the state governments.
This study examines the differences in insurance plan features in these three variations of exchanges to determine which system was the most successful in creating competition among insurers, thus attracting more generous plans to the exchanges. The plan-level data are useful for analysing the different results from various implementation settings and processes because they include objective measurements of outcomes, something that is often difficult to obtain in public organisations where outcomes can be ambiguous, conflicting or both. In the case of the HIEs, plan generosity is an important outcome to both consumers and the federal government. Lower costs mean lower spending for individuals, which could help achieve the policy’s goal of reducing the number of uninsured and underinsured Americans. Lower costs also require decreased premium subsidies from the federal government for low-income individuals.
An earlier analysis of the premiums between different types of ACA exchanges found that plans in state-based exchanges had lower premiums on average (Krinn et al. Reference Krinn, Karaca-Mandic and Blewett2015). The present study significantly expands the scope of enquiry to a more complete examination of plan generosity. In addition to premium costs for younger and older beneficiaries, it explores other important dimensions of generosity, including deductible requirements and amounts and cost sharing for primary care and specialist office visits and generic and preferred brand prescription drugs. Controlling for a number of health-related, socio economic and demographic factors, in addition to competitiveness of the state insurance market, per capita healthcare spending and state capacity for managing an exchange, the results show that state exchanges were consistently the most successful at offering qualified health plans (QHP) with lower costs for consumers on a variety of dimensions. Plans in partnership exchanges were also more generous than those offered through federally facilitated exchanges, but less generous than plans in state-based exchanges.
On the basis of the analyses, it appears that state-based exchanges were better able to leverage their discretion, familiarity with their settings and relationships with stakeholders to procure better results for consumers and the federal bottom line. By extension, the implementation of HIEs provides support for Matland’s hypothesis that a bottom-up approach is advantageous for policies defined by more complexity and political contention. Tighter centralised control at the federal level seems to have been less effective at addressing the state-level needs for exchange development. Rather, lower-level discretion and policies that were tailored to the state setting were associated with greater effectiveness in this complex implementation setting.
Background
The ACA and HIEs
Few United States (US) public policies since President Lyndon B. Johnson’s Great Society have had the far-reaching and controversial effects of the ACA. Signed into law on 23 March 2010, the healthcare reform legislation created a range of new regulations and mandates for the healthcare industry, particularly the health insurance sector. One of the expressed priorities of the ACA was to make health insurance available and affordable for many of the nearly 50 million uninsured Americans and to create new standards and transparency for plans in the individual insurance market – that is, insurance purchased directly by individuals rather than obtained as a benefit through their employer (Centers for Medicare & Medicaid Services 2012).
Bringing millions of individuals into the health insurance market, with its attendant challenges of moral hazard, adverse selection and high costs, relied on a combination of reforms referred to by many analysts as the “three-legged stool” (Gruber Reference Gruber2011). First, to eliminate discrimination in the provision of coverage, the ACA set stringent requirements for QHPs regarding essential benefits, provider network adequacy, essential community providers, actuarial value, cost-sharing limits and discriminatory benefit design (e.g. preexisting condition exclusions) (Centers for Medicare & Medicaid Services 2012). Second, to reduce adverse selection and a potential market “death spiral”, the law created an insurance mandate that required most individuals to obtain coverage or pay penalties. Third, because many individuals could not afford to comply with the mandate due to the high cost of insurance coverage, the ACA provided a graduated system of means-based premium subsidies beginning for individuals and families with incomes less than 400% of the federal poverty level. The authors of the ACA hoped that, together, the legs of the three-legged stool would guarantee access to insurance coverage that was affordable but also protect insurers from a sick and expensive pool of beneficiaries.
The ACA was primarily a market-based solution to the US health insurance challenges. Rather than replacing private health insurance, it reformed the market by creating a mechanism for greater competition and comparability between plans, with hopes of driving down prices. Health insurance marketplaces or “exchanges” were the backbone of the infrastructure required to foster competition among insurers. Exchanges created a centralised location for consumers to compare and purchase available QHPs. Only QHPs purchased through the exchanges would be eligible for federal premium subsidies, thus HIEs would attract a pool of potential consumers and incentivise participation by the insurers. The ACA stipulated that individuals could purchase insurance plans through exchanges beginning 1 October 2013, for coverage beginning 1 January 2014.
State exchange implementation
Implementation of the exchanges was a complicated proposition. In addition to establishing the IT infrastructure necessary for hosting a functional website, exchanges needed to fulfil five broad categories of responsibilities (Figure 1). They were to assess individuals’ eligibility to buy coverage through the exchange and make subsidy determinations based on income, enrol eligible individuals, conduct plan management (e.g. making final determinations to review and certify QHPs), provide consumer assistance in plan choice and enrolment and manage the financial requirements for exchange operations. Although new federal regulations and requirements under the ACA were extensive, states were given responsibility for managing the exchanges, and they received significant latitude to strengthen certain rules set by the ACA or to create additional incentives or regulations to facilitate competition among insurers (Dash et al. Reference Dash, Lucia, Keith and Monahan2013a).
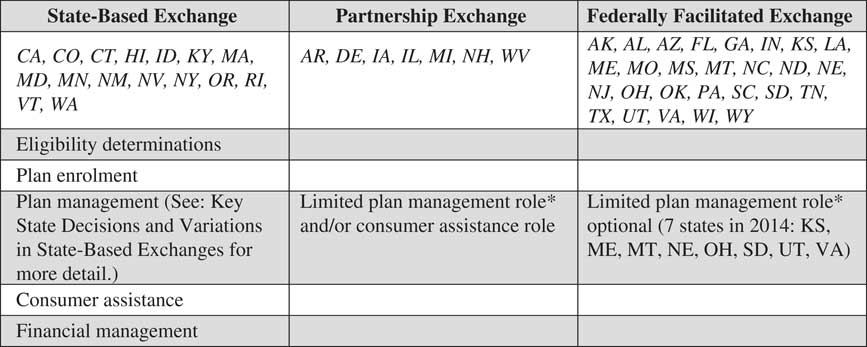
Figure 1 State responsibilities by exchange typeNote: *Limited plan management role for states in partnership and certain federally facilitated exchanges includes issuing the qualified health plan (QHP) application and collecting data in support of the application, conducting rate reviews and network adequacy assessments, transmitting such data to Centers for Medicare & Medicaid Services (CMS) for final QHP decisionmaking and approval and submitting plan information to CMS for inclusion on the healthcare.gov website. Source: Centers for Medicare & Medicaid Services (2012) and Goodell (Reference Goodell2013).
The plan management function in particular offered states the opportunity to adapt exchange rules and regulations to local circumstances (Figure 2). States could require participation in the exchanges by certain insurers or encourage it by establishing waiting periods of several years for insurers that declined to sell plans through the exchange in 2014 (Holahan et al. Reference Holahan, Peters, Lucia and Monahan2012). Rather than accept all plans meeting the minimum QHP criteria, states could engage in selective contracting and only accept entry by the most attractive plans according to price or other objectives (e.g. access to care). States could also strengthen the competitiveness of plans in the exchanges relative to plans offered on the individual insurance market outside exchanges. They could harmonise standards for plans outside the exchanges to create a level playing field – for example, by disallowing “catastrophic coverage” options that offer few benefits. They could require insurers offering a plan outside the exchange to offer a comparable one within the exchange; states could even eliminate the sale of individual plans outside the exchange altogether. States could craft exchange rules to facilitate consumer decisionmaking, thus improving transparency and comparability. Such efforts might include standardising plans according to benefits or out-of-pocket spending, limiting the number of plans available from each insurer or requiring that there be “meaningful differences” between an insurer’s plans. They could also create and publish quality ratings for insurers. Finally, states could informally communicate with insurers to encourage participation and negotiate for better plan prices and features (Dash et al. Reference Dash, Lucia, Keith and Monahan2013a).
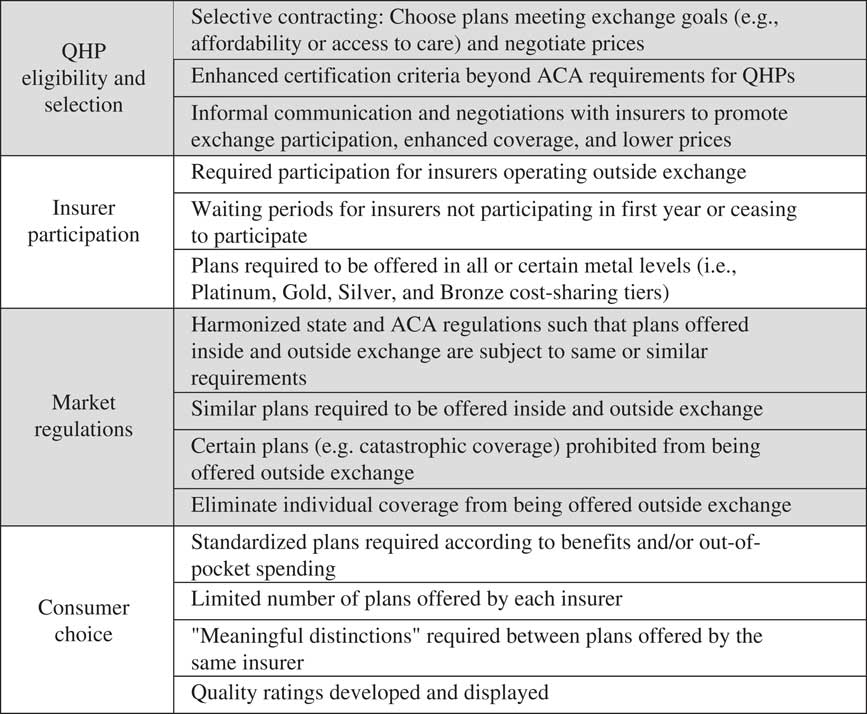
Figure 2 Key plan management variations in state-based exchanges Note: QHP=qualified health plans; ACA, Patient Protection and Affordable Care Act.Source: Dash et al. (Reference Dash, Lucia, Keith and Monahan2013a).
The federally facilitated and partnership options
Insurance regulation is traditionally a state-level function, and the authors of the ACA expected that most states would assume responsibility for creating and maintaining their own exchanges. In states that failed or chose not to do so themselves, the ACA designated the task of implementing federally facilitated exchanges and carrying out “all exchange functions” to the Centers for Medicare & Medicaid Services (CMS) in the Department of Health and Human Services (HHS) (Centers for Medicare & Medicaid Services 2012). Some states with federally facilitated exchanges could request from CMS the right to perform day-to-day plan management. This limited role entailed significantly less discretion for state officials than in state-based exchanges. The seven states that chose this option operated within federally established rules and guidelines determining which insurers could participate and what types of plans could be offered. States in this case were primarily responsible for collecting insurer data in support of QHP applications, conducting rate reviews and network adequacy analyses and submitting these data to CMS, where final approval for inclusion of QHPs on the exchange was granted at the federal level (Blumberg and Rifkin Reference Blumberg and Rifkin2013).
A final implementation option was the federal-state partnership exchange, whereby states could choose to take on responsibility for either or both the plan management and the consumer assistance functions. Seven states were state-federal partnership exchanges in 2014. As with the federally facilitated plan management option, plan management functions within partnerships were more circumscribed than in state-based exchanges, with the final authority resting with the federal government (Centers for Medicare & Medicaid Services 2012). Partnerships carried additional burdens related to the time and effort needed to coordinate between federal and state authorities. However, like state-based exchanges, the partnership exchanges did have the advantage of relying on existing state expertise and capacity in insurance regulation. Compared with federally facilitated exchanges, partnership exchanges also minimised the potential for inefficient duplication of effort for plan management functions. In federal exchanges, oversight for plans offered within the exchange was managed at the federal level, whereas states continued to be responsible for plan management functions for plans offered outside the exchange. Partnership exchanges were more likely to keep plan management responsibilities consolidated in the same agency (Blumberg and Rifkin Reference Blumberg and Rifkin2013).
Evaluating exchange outcomes is interesting from a pure policy analysis standpoint in order to gain a better understanding of which types of ACA exchanges perform effectively. However, estimating the differences in performance is also useful from a more theoretical perspective. This study will explore how variation in implementation was associated with different policy outcomes using a top-down and bottom-up framework.
Top-down versus bottom-up perspectives
The field of policy implementation has long been divided between the top-down and bottom-up camps (O’Toole Reference O’Toole1986, Reference O’Toole2000; Schofield Reference Schofield2001). The top-down tradition emerged among scholars who attributed policy outcomes to the actions of lead officials in organisational hierarchies and the centralised authority those officials could exert over the actions of the implementers below (Sabatier Reference Sabatier1986; Mazmanian and Sabatier Reference Mazmanian and Sabatier1989). The importance of hierarchical control and fidelity to the legal statutes undergirding policies are the focus of attention. These researchers also stress the importance of clearly articulated policy objectives and strict compliance from local-level implementers (Schofield Reference Schofield2001). Thus, as the name would suggest, top-down scholars regard the variables that control success or failure in policy implementation as resting squarely at the top.
The top-down argument often entails a proscriptive nature as well. Policymakers are encouraged to minimise the number of actors and decision points involved in implementing policies (Pressman and Wildavsky Reference Pressman and Wildavsky1984). In Mazmanian and Sabatier’s (Reference Mazmanian and Sabatier1989) often-cited framework, the authors recommend presenting implementers with concise goals and expectations, situating policies within “friendly” and committed agencies and maintaining clear lines of authority.
Bottom-up scholars challenge the claims that the important action of policy implementation occurs at the top and within a single, dominant organisation (Hjern and Porter Reference Hjern and Porter1981). They believe that understanding what occurs at lower levels of implementation will explain outcomes better than the concerns of the top-down proponents (Hjern Reference Hjern1982). These scholars see a need for policy innovation at the bottom that is not necessarily preordained by policymakers (Hill and Hupe Reference Hill and Hupe2009). They emphasise the importance of pragmatism and problem solving on the ground in shaping outcomes.
According to the bottom-up perspective, policies are often enmeshed in complex networks rather than straightforward single-organisation hierarchies (Hall and O’Toole Reference Hall and O’Toole2000, Reference Hall and O’Toole2004). Implementation in a multi-organisational setting may not present as many opportunities for goal clarity, simplification or enforced compliance as the top-down scholars anticipate (Torenvlied and Akkerman Reference Torenvlied and Akkerman2004). As such, Berman (Reference Berman1978) maintained that implementation depends not only on the policy as articulated at the top but also on the policy’s interaction with the local context. Successful implementation requires skills, knowledge and support from stakeholders at lower levels and across organisations; therefore, policies should be designed in order to provide more local-level discretion.
Multiple scholars have made attempts to integrate the two approaches (Elmore Reference Elmore1982, Reference Elmore1985; Goggin Reference Goggin1986; Sabatier Reference Sabatier1986). One strategy for unification has been to focus on aspects of the policy itself that affect outcomes (Sandfort and Moulton Reference Sandfort and Moulton2015). Matland (Reference Matland1995) sought to apply top-down and bottom-up principles selectively according to a policy’s degrees of ambiguity and conflict. Policies entailing well-understood technology (low ambiguity) and high political agreement on the need for action (low conflict) would, he hypothesised, benefit from a top-down implementation approach, and effectiveness would primarily depend on the presence of sufficient resources. Implementation could proceed somewhat mechanically with strong direction from the top.
At the other extreme are policies with complex, uncertain solutions (high ambiguity) and with divided, contentious political will (high conflict). Matland suggested that implementation would vary across sites depending on the coalitional strength and contextual factors at the local level, but that top-down influence was also important in order to overcome problems arising from the charged political nature of policy. For these types of policies, he hypothesised that implementers on the ground would benefit from greater latitude in interpreting the policy’s objectives and in setting strategies for putting them into action. As the ACA is a high-profile example of a policy with both high ambiguity and conflict, it provides an excellent opportunity to test whether top-down or bottom-up implementation strategies are associated with better policy outcomes in these types of cases.
Federally facilitated exchanges align most closely with the top-down models of implementation and feature more of the characteristics considered predictors of success in the top-down tradition. The coordination of exchanges at the federal level maintains more unified control (Goodell Reference Goodell2013). Federally facilitated exchanges also remove layers of administrative compliance and veto points involved with having the states implement the exchanges under the broad oversight of the federal government (Dash et al. Reference Dash, Monahan and Lucia2013b; Haeder and Weimer Reference Haeder and Weimer2013). Finally, it is more likely that officials and implementers in the HHS are consistently supportive of the ACA. Indeed, the HHS FY 2010–2015 Strategic Plan (Department of Health and Human Services 2010) defines its top strategic objective as securing and expanding insurance coverage via implementation of the ACA and insurance exchanges. HHS had responsibility for developing the final rules for the ACA and its exchanges. Keeping implementation under the same roof where rulemaking occurred is likely to produce agreement between the objectives of the statute and those of the implementers. Implementers of state-based exchanges, however, displayed widely varying degrees of support for the policy (Haeder and Weimer Reference Haeder and Weimer2013). Therefore, the evidence from the ACA will support top-down frameworks if plans in federal exchanges are more generous than in state-based and partnership exchanges.
From the bottom-up tradition, state-run exchanges have a higher probability of success. The state-based exchanges funnel more discretion to shape both the formal and informal rules that determine how exchanges operate down to individuals lower in the hierarchy (Holahan et al. Reference Holahan, Blumberg, Coughlin, Courtot, Hill, Peters, Rifkin, Wilkinson, Corlette and Lucia2014). State-based exchanges offer more opportunities for customising the policy to local conditions based on implementers’ expertise, knowledge of their environment and relationships with stakeholders (Dash et al. Reference Dash, Lucia, Keith and Monahan2013a; Goodell Reference Goodell2013). As insurance regulation has traditionally been a state function, providing more policy-making authority and leeway to state officials could lead to better outcomes. Similarly, partnership exchanges may provide a comparative advantage over federally facilitated exchanges by being able to involve knowledgeable state officials into the process, although to a more limited extent than in state-based exchanges where state authorities have more discretion (Blumberg and Rifkin Reference Blumberg and Rifkin2013). Overall, if the analysis shows state-based and partnership exchanges to have more generous plans than federal exchanges, the findings will reinforce bottom-up values.
Data
To examine the variation in plan generosity between federal, state and partnership exchanges, I use the Health Insurance Exchanges (HIX) Compare Data set (Breakaway Policy Strategies 2014) on every Silver-LevelFootnote 1 plan offered through exchanges in all 50 states for 2014. Analysing Silver plans is ideal because they are the most popular, representing 65% of plans purchased through exchanges for 2014 (Kaiser Family Foundation 2014b). In addition to affecting consumer spending, government spending is directly affected by how well the exchange can lower the cost of Silver plans as federal subsidy amounts are tied to the premium of the second-cheapest Silver-Level plan in an exchange. Therefore, managing an effective exchange that fosters competitive prices for these plans is important for controlling subsidy spending (Kaiser Family Foundation 2011).
The HIX Compare data set contains information on a number of key plan details including plan premiums, deductibles and cost-sharing requirements for different kinds of healthcare utilisation. Premiums are the monthly payments required to maintain coverage in a plan, regardless of healthcare use. The ACA allows plans to charge different premium rates based on age, geography and tobacco use but not health status or other demographic characteristics such as sex or race. I compare premium rates for plans covering nonsmoking 27-year-old and 50-year-old individuals to see whether effects differ for younger and older beneficiaries. Deductibles are amounts of healthcare spending that must be paid out-of-pocket by the beneficiary before insurance coverage begins. In some plans, office visits are subject to a deductible, whereas other plans provide coverage for office visits before a beneficiary meets his deductible for the year. I measure the amount of the annual medical deductible and whether a plan requires a beneficiary to meet the deductible before receiving coverage for primary care and specialist office visits.
After meeting a deductible, individuals usually continue to incur cost sharing through a fixed copayment amount. I analyse in-network copayment amounts for some of the most common healthcare expenses – primary care physician and specialist office visits and generic and preferred brand drugs. Primary care physicians are those who practice general, internal or family medicine. Specialists are physicians with advanced training in a particular field of medicine such as neurology. Pharmaceuticals are generally classified as generic, preferred brand, nonpreferred brand drugs. Generics are drugs whose patent exclusivity has expired and are thus typically produced by a number of competing firms and offered at a low price. Preferred and nonpreferred brand drugs are produced by a single, patent-holding manufacturer that can exploit its monopoly power to charge higher prices. However, insurers often designate select drugs as “preferred” in order to extract discounts from manufacturers. Beneficiaries deciding between similar drugs in a given therapeutic class have a choice between preferred and nonpreferred brands and will incur lower cost sharing for preferred drugs (Berndt and Newhouse Reference Berndt and Newhouse2010). Therefore, a plan’s copayment for a preferred brand drug represents the lowest price an individual could pay for a pharmaceutical if a generic treatment is not available.
Together, these variables on premiums, deductibles and copayments provide a multidimensional perspective on the degree of plan generosity across different types of exchanges. In order to compare plan features from federal, state and partnership exchanges, I use data collected from the Kaiser Family Foundation (2014c) on the types of exchanges established in each state and match them to the plan data by state (Figure 3). I control for a number of state-level variables that might influence the cost or generosity of plans offered there. First, health and healthcare costs are significantly related to demographic and socio economic characteristics. I include variables from the US Census Bureau (2013) related to racial composition, unemployment, logged household median income, poverty, percentage of the population aged 50–64 and percentage of the population that was uninsured in 2013. I also control for state per capita healthcare spending using data from the National Health Expenditures Data (Centers for Medicare & Medicaid Services 2011).
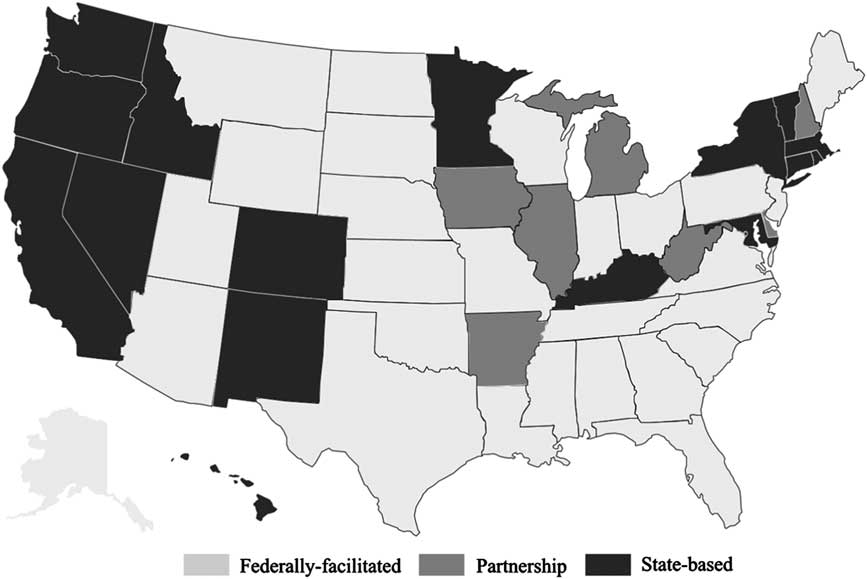
Figure 3 State health insurance exchanges by type, 2014 Source: Kaiser Family Foundation (2014c).
The overall health of the state’s population should have a significant impact on the use of healthcare services, and therefore the average cost of insurance coverage. A number of health indicators such as life expectancy or infant mortality are relevant to estimating a population’s overall health. As no one measure can capture all the aspects of a state population’s health and including several measures might introduce multicollinearity to the models, I conduct a factor analysis to produce a variable that represents the overall health of the state. Using data from the Kaiser Family Foundation, I perform the analysis using statistics on heart disease-related deaths, diabetes diagnoses, cigarette use, rate of obesity, life expectancy at birth and infant mortality as variables related to the underlying health status of the state’s population. The variables load on the first factor with an eigenvalue of 4.70. Having passed the relevant tests for a strong factor, I use the predicted values to represent a state population’s health status. Higher values are less healthy and range from −1.80 (Utah) to 2.28 (Mississippi).
Another variable that may predict exchange plan generosity is the concentration of the individual insurance market before the ACA implementation in 2013. States with more concentrated individual insurance markets will be defined by significant market share resting with a single or several firms and less opportunity for using competition to produce lower costs and better benefits. The Kaiser Family Foundation (2012a) provides the Herfindahl-Hirschman Index (HHI) values for each state’s individual health insurance market, which is calculated as the sum of the squared market share of each firm. Higher HHI values, up to a maximum of 10,000, indicate more concentrated insurance markets. In addition to the overall state HHI, I include a plan-specific indicator variable for whether the insurer sponsoring the plan was the top insurer in the state for the individual insurance market (Kaiser Family Foundation 2012b).
Finally, it is essential to recognise that exchange type is not a randomly assigned condition. Each state made the choice to adopt either a federal, state or partnership model, and its decision was likely based at least in part on its ability to implement an effective exchange relative to the federal government. The state’s administrative capacity for implementing the exchange could affect both the implementation decision and the implementation outcome. Therefore, I control for administrative capacity using three measures. The first two are from the Census Bureau’s Census of Governments. I include the ratio of state revenues to expenditures from the fiscal year 2012, which was the year when states were actively deliberating on whether to establish a state-based exchange. A higher ratio of total revenues to expenditures indicates more slack resources in the government available for implementation. Second, I use the percentage change in full-time equivalent positions employed by the state from 2011 to 2012 to measure whether state personnel was expanding or contracting at this time. Growing state employment could also indicate higher governmental capacity.
Finally, I use the 2010 data from the Kaiser Family Foundation as a direct measure of health insurance regulatory capacity within the state by including variables for the type of rate review conducted. State insurance departments usually have the authority to investigate and accept or reject proposed premium rate increases by insurers. I categorise states as requiring prior approval for rate increases (which requires more capacity from the department), responding retroactively to complaints of excessive increases from consumers (i.e. “file–and-use” authority), or not engaging in this type of regulation. States with more rate review authority and capacity before adoption of the ACA may have been better equipped to implement a state-based exchange.
Empirical model
As described above, I measure plan generosity for all Silver-Level plans offered through the exchanges for the 50 states using a number of variables related to costs consumers incur from participating in plans and using healthcare services. The actual value to a consumer of having health insurance coverage is complex, determined by a variety of factors including their healthcare use, premium, deductible and copayment/coinsurance amounts and other plan details. For example, most group plans offered through employer benefits provide coverage for primary care and specialist visits (subject to a copayment/coinsurance) without requiring that a beneficiary first meet his deductible (Breakaway Policy Strategies and Robert Wood Johnson Foundation 2014). However, in almost 28% of exchange plans, beneficiaries must meet their deductibles before getting coverage for a primary care office visit. As deductibles are typically quite high, the requirement to meet the deductible before getting coverage for office visits is an important consideration for plan generosity.
Ultimately, plan generosity is not a concept that can be captured by a single dependent variable, such as plan premiums. As such, I run nine different regressions, each with a different outcome variable. Table 1 displays the variable means and standard deviations for the dependent variables, first for the entire sample and then broken out according to exchange type. For these plans, average monthly premiums in the full sample were $261.90 for 27-year-old beneficiaries and $439.90 for 50-year-old beneficiaries. Broadly speaking, the average values of most of the dependent variables are less expensive or more advantageous in the state-based exchanges.
Table 1 Variable means and standard deviations: dependent variables
Note: PCP = primary care physician.
Table 2 displays the summary statistics for the independent variables, which are discussed above. I use the same control variables across all nine models. For the seven continuous dependent variables, I estimate the equations using ordinary least squares (OLS), where the model is specified as follows:
 $$DV_{{jks}} \,{\equals}\,\beta _{0} {\plus}STATEX_{{jks}} \beta _{1} {\plus}PARTEX_{{jks}} \beta _{2} {\plus}S_{s} \beta _{3} {\plus}X_{j} \beta _{4} {\plus}Z_{{ks}} \beta _{5} {\plus}{ε}_{{jks}} $$
where DV jks is the continuous dependent variable – premiums (for 27- and 50-year-olds), medical deductible, primary care visit copayment, specialist visit copayment, generic drug copayment or preferred brand drug copayment – for the jth plan offered by the kth insurer in the sth state. The principal independent variables of interest are STATEX jks and PARTEX jks , which are indicator variables for whether the plan was offered through a state-based exchange or a state-federal partnership exchange for the 2014 coverage year, respectively (federally facilitated exchanges are the reference category). S s is a vector of state-level controls (individual insurance market HHI, health status, per capita healthcare expenditures, logged median income, poverty rate, unemployment rate, uninsurance rate, racial composition, percentage of population aged 50–64 years, number of insurers participating in the exchange, revenue-to-expenditure ratio, change in state government employment and rate review type), X j a vector of plan-level dummy variable representing the type of plan (e.g. preferred provider organization (PPO) or health maintenance organization (HMO)), Z ks an insurance firm-level dummy variable equal to 1 if the firm had the highest market share in the state’s individual insurance market in 2013 and ε jks the error term.
Table 2 Variable means and standard deviations: independent variables
Note: HHI=Herfindahl-Hirschman Index; FTE=full-time equivalent.
Two of the dependent variables are dichotomous – whether there were deductible requirements before coverage for primary care and specialist office visits. I estimate these outcomes with a probit model, defined as follows:
 $$\eqalign{ {\rm Pr}\left[ {DV_{{jks}} {\equals}1} \right]\cr& {\equals}\, F \left( {\beta _{0} {\plus}STATEX_{{jks}} \beta _{1} {\plus}PARTEX_{{jks}} \beta _{2} {\plus}S_{s} \beta _{3} {\plus}X_{j} \beta _{4} {\plus}Z_{{ks}} \beta _{5} {\plus}{ε}_{{jks}}} \right)$$
where F( . ) designates the logistic probability density function, and DV jks is an indicator variable for whether the jth plan offered by the kth firm in the sth state requires a deductible before covering primary care or specialist office visits. The remaining elements of the estimation equation are identical to (1).
Results
The OLS regression results for premiums and deductibles are presented in Table 3, and the results for the copayment-dependent variables are presented in Table 4. The results are unambiguous that state-based exchanges were most likely to have QHPs with lower premiums and cost sharing. For five of these seven dependent variables, the coefficients were significant (at the 95% confidence level) and negative for state-based exchanges compared with federally facilitated exchanges. Federally facilitated exchanges performed better than state-based exchanges on only one measure. Plans in partnership exchanges also tended to be associated with lower costs for beneficiaries than in federally facilitated exchanges but were less generous than those offered in state-based exchanges.
Table 3 Ordinary least square coefficients for predicting premiums and deductibles
Note: HHI=Herfindahl-Hirschman Index; FTE=full-time equivalent.
**p<0.05, ***p<0.01.
Table 4 Ordinary least square coefficients for predicting copayments
Note: PCP = primary care physician; HHI=Herfindahl-Hirschman Index; FTE=full-time equivalent.
*p<0.10, **p<0.05, ***p<0.01.
Plans in state-based exchanges were associated with premiums in 2014 that were an average of $40.70 per month lower for 27-year-old beneficiaries. Reductions were more than twice as great for older beneficiaries –$86.30 per month lower premiums for 50-year-olds. Premiums in partnership exchanges were $18.30 and $37.10 lower than federal exchanges, respectively. Typically, plans make trade-offs between lower premiums and higher cost sharing (or vice versa). It would be possible for plans in state-based or partnership exchanges to compete strongly on lower premiums while reducing plan generosity through greater out-of-pocket spending on deductibles or copayments.
The regression models, however, show that deductibles were also significantly lower in state-based exchanges than in federally facilitated exchanges (although not statistically different in partnership exchanges). For an individual, medical deductibles were approximately $568.50 lower in the 16 states that managed their own exchanges. The trend holds for copayments related to two common medical expenditures—specialist visits and preferred brand pharmaceuticals were $10.10 and $6.17 cheaper, respectively. Specialist copayments were an average of $3.39 less expensive in partnership exchanges than in federal exchanges, although preferred brand drugs were an average of $2.21 more expensive. The coefficient for primary care copayments was −$1.77 in state-based exchanges but only at the 90% confidence level. Only generic drug copayments showed an advantage for federal exchanges; state-based exchanges were associated with generic copayments that were $0.78 more expensive. However, the magnitude of this effect was negligible in real terms.
Many other variables in the models were significantly related to premiums and cost-sharing levels. The individual insurance market concentration variable, HHI, was positively related to premiums for the 50-year-old age group and deductibles, indicating that states where more market share was focussed on fewer insurers had higher costs for beneficiaries. Interestingly, the effect of HHI was insignificant for 26-year-olds, suggesting that insurers used the weaker competitive pressures to extract higher prices for older, more expensive beneficiaries. Furthermore, for plans sponsored by the insurer with the highest market share in the state, premiums and cost sharing were significantly lower across almost all variables. These firms may have leveraged their market share to offer more generous plans and entrench their market status in the exchanges during the first year.
The coefficients for per capita healthcare spending were negative for premiums and positive for deductibles. This result implies that in states where beneficiaries tended to incur higher healthcare spending, insurers competed for desirable, low-cost enrollees by offering plans with lower premiums and higher out-of-pocket spending. Healthier individuals would tend to prefer this combination, as they would expect their healthcare utilisation to be relatively low. Other characteristics of a state’s population that typically represent higher-cost beneficiaries were associated with higher deductibles and cost sharing as expected. Coefficients are primarily positive for the percentage of a state’s population between 50 and 64 years of age. These older populations would be expected to have higher medical expenditures. Interestingly, even premiums for 27-year-olds are higher in states with larger 50–64-year-old populations. This effect is likely the consequence of the age-rating ACA regulation, stipulating that premiums for the oldest beneficiaries (aged 60–64 years) cannot exceed three times the premiums for 21-year-olds (Blumberg and Buettgens Reference Blumberg and Buettgens2013). Therefore, in older populations, young people may be experiencing higher premiums in order to compensate for the greater healthcare costs incurred from the older beneficiaries in the state.
The state’s uninsured population was also correlated with higher plan prices for most variables. One explanation for this effect is that insurers anticipated that a higher uninsured population might represent a pent-up need for healthcare services, which would produce higher-cost beneficiaries on average in these states. Another explanation is that as the uninsured population was a primary market to be served by the exchanges a larger uninsured population would suggest more demand for the exchange plans. In this sense, higher demand appears to have followed economic expectations by producing higher prices. The results for median income and unemployment tell a similar demand story. States with higher median incomes, thus higher ability to pay for insurance, showed higher premiums. States with higher unemployment rates (i.e. lower ability to pay) had overall lower premium prices.
Finally, the variables measuring state implementation capacity did not systematically operate in the expected directions. The coefficient for the revenue-to-expenditure ratio is generally negative, as anticipated. Therefore, more slack resources in the state budget were associated with more generous plans. However, growing state employment – measured as the percentage change in the number of full-time equivalent positions – showed a positive relationship with plan costs. Finally, the coefficients for rate review presented conflicting results. Having a more robust rate review capacity (i.e. prior approval) was associated with higher premiums than both file-and-use rate review and no rate review. However, the cost-sharing models tended to demonstrate lower costs associated with prior approval rate review.
Table 5 shows the coefficients for the probit models predicting whether plans require beneficiaries to meet a deductible before getting coverage for primary care or specialist visits, and Table 6 shows the relevant marginal effects. Again, state-based exchanges performed better at providing more generous plans than did federally facilitated exchanges. State-based exchanges were associated with being 10 percentage points less likely to have a deductible requirement for primary care visits and 8.4 percentage points less likely to have one for specialist visits. Plans in the state-federal partnerships were 7.4 percentage points less likely than those in federally facilitated exchanges to require meeting a deductible for primary care visits and 11 percentage points less likely to have such a requirement for specialist visits.
Table 5 Probit coefficients for predicting deductible requirements
Note: PCP = primary care physician; HHI=Herfindahl-Hirschman Index; FTE=full-time equivalent.
*p<0.10, **p<0.05, ***p<0.01.
Table 6 Probit marginal effects for predicting deductible requirements
Note: PCP = primary care physician; HHI=Herfindahl-Hirschman Index; FTE=full-time equivalent.
*p<0.10, **p<0.05, ***p<0.01.
Robustness check
The results from the above regressions seem to indicate consistently that state-based exchanges were the most effective implementation model for presenting consumers with affordable health insurance plans in the first year of operation. However, as already discussed, selection bias is a concern because states chose their “treatment status” rather than having it assigned. The models control for differences in states’ abilities to implement the policy, with variables measuring budgetary, personnel and functional capacity. Although it is not possible to know whether selection has been eliminated as an issue, I have undertaken an additional robustness check to supplement the findings from the regression models.
I want to determine whether states with more generous plans before ACA implementation were also those that chose to manage their own exchanges. Using 2010–2013 data on individual insurance market premiums from the Kaiser Family Foundation, I compared premiums from states that would implement state-based exchanges in 2014 with states that would ultimately have federally facilitated and partnership exchanges. As shown in Figure 4, states that eventually adopted a state-based exchange in 2014 had higher premiums before implementation than federally facilitated or partnership exchanges. The test provides additional support that selection effects are not driving the results of the regression models and that the state-based implementation model contributes to more generous plan outcomes.
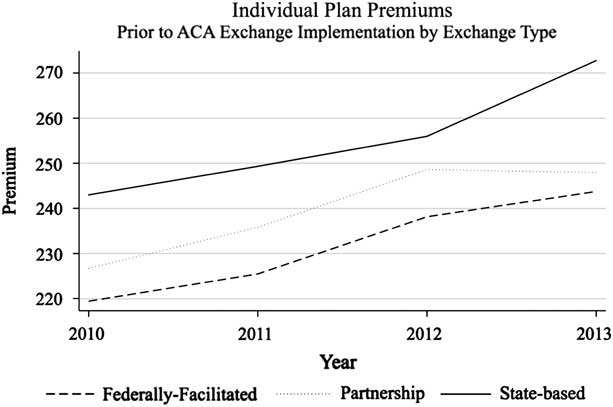
Figure 4 Average plan premiums preceding Patient Protection and Affordable Care Act (ACA) implementation by 2014 exchange type Source: Kaiser Family Foundation (2014a).
Discussion
The results of these regression models show strong associations between state-based exchanges and more generous insurance plan features, and they present a compelling case that states were more effective than the federal HHS in building and managing exchanges that fostered competition between insurers and produced more affordable health insurance options for consumers. On average, a consumer purchasing insurance through a state-based exchange could expect to pay less every month in premiums (between $488 and $1,035 less annually, according to back-of-the envelope calculations), less in order to meet his annual deductible, less to visit a primary care physician and specialist and less to fill a branded prescription drug at the pharmacy. He would also be significantly less likely to have to fulfil his annual deductible before having a visit to a primary care physician or specialist covered by insurance. The consistency of the results is surprising, given that premiums and out-of-pocket spending are commonly regarded as trade-offs. State-based exchanges provided better value for consumers in both categories.
Implementation of the ACA HIEs is an illustrative setting to study because it provides a high-profile example of non-incremental policy change in an important sector of the nation’s economy. It also has the advantage of providing concrete, quantifiable outcome measures. Owing to the variation in implementation between federally facilitated, state-based and state-federal partnership exchanges, the ACA policy can be insightful in providing support for or against certain prescriptions advanced in the implementation literature. Drawing on Matland’s typology, the findings produce strong support for the recommendations of the bottom-up tradition when considering a policy with both high ambiguity and conflict.
Hill and Hupe (Reference Hill and Hupe2003) describe a process of “policy co-formation” in multi-layer implementation settings. Each layer in the system contributes political influences and competencies. In other words, not only the top layer supplies beneficial attributes to the implementation process. In the case of the ACA exchanges, the states’ contributions (either in their own exchanges or in a state-federal partnership) appear to have improved the implementation process and led to better outcomes. Inclusion of the state layer of implementation was part of an additive process. Although it is not possible from this analysis to pinpoint the specific advantages of state-level involvement, potential contributors include expertise with insurance regulation, richer relationships with private firms and nonprofits involved in insurance provision and the ability to customise rules and processes to meet the local needs on the ground.
The top-down implementation model receives weak validation when applying its principles to the findings from this analysis of the ACA. Federally facilitated exchanges were developed in an implementation environment closely aligned with the traditional top-down wish list. The final ACA rules clarifying how the statute was to be executed were written in the same agency, HHS, which managed the federal exchanges. The leaders in HHS were committed to the policy, and the goals and priorities of the agency were aligned with those of the policy. As there were fewer levels of government directly involved in the process, there were fewer veto points or complicated intergovernmental political mazes to navigate. In a federally facilitated exchange, top officials had direct hierarchical control over those charged with managing all the complex pieces of organising an online marketplace and generating competition among sophisticated, profit-seeking private firms. However, in the end, the systems with more flexibility and discretion at lower levels were more successful in accomplishing the policy’s objectives.
Despite the robustness of the results of this study, caution should be heeded in recommending a bottom-up, state-based approach in all cases. This analysis attempts to control for the diverse capacities of states to implement the programme; however, such measures will always be incomplete. The possibility remains that some states would be ill-equipped to develop and manage a complex exchange that can perform the tasks needed to build a competitive insurance marketplace. Other states may not have the political support necessary to overcome the obstacles created by the controversial nature of the ACA. In such cases, a top-down implementation model will continue to be the more appropriate choice. Although this study’s findings may lend support for the hypothesis that providing more discretion to local implementers in policies exhibiting significant complexity and contentiousness has advantages overall, individual cases will vary.
Conclusion
The ACA put in place profound changes in the way health insurance markets operate in the US and made coverage available for millions of uninsured or underinsured Americans. A cornerstone of the legislation was the establishment of HIEs in each state whose goal was to spur competition among insurers in order to provide more affordable options for consumers.
In all, 16 states operated their own HIEs for the first year, 27 relied on the federal government and seven formed partnerships in collaboration with the federal government. Comparing the results of these different implementation schemes provides insight into what worked specifically within the context of the ACA. It also permits an analysis of the top-down and bottom-up implementation frameworks applied to a large-scale policy change. Federally facilitated exchanges shared many of the features and values emphasised by the top-down literature, whereas state-based exchanges were more closely aligned with bottom-up principles.
The quantitative analysis of the HIEs featured nine dependent variables measuring different aspects of plan generosity – premiums for older and younger beneficiaries, deductibles, copayments for primary care and specialist office visits and generic and preferred brand drugs and deductible requirements for primary care and specialist office visits. Controlling for a number of factors that contribute to healthcare spending and insurance prices in a state, the results produce strong evidence that the state-based exchanges performed significantly better than federally facilitated exchanges in seven of the nine performance measures. Partnership exchanges also outperformed federal exchanges. State and partnership exchanges involved wider networks of actors across more organisations and introduced more opportunities for discretion at lower levels of the implementation process. Rather than contributing to disruption or distraction, these attributes appear to have contributed to greater success, lending support to bottom-up values.
The top-down and bottom-up debate is an old one, and the strict line between the two factions has gradually grown fuzzier, with most scholars recognising the need for an integrated approach that acknowledges the importance of context (O’Toole Reference O’Toole2011). However, its basic premises still motivate implementation scholars and their approaches to research. Researchers can advance integration of the two sides by finding points of agreement in addition to identifying points of disagreement and testing the robustness of each side’s assertions (O’Toole and Montjoy Reference O’Toole and Montjoy1984; Meier and McFarlane Reference Meier and McFarlane1995). The present study contributes to the literature in a similar way by testing whether implementation is helped or hindered by providing greater local discretion in a complex and politically contentious implementation setting. In the case of the ACA and its expansive efforts to establish HIEs in all 50 states amidst controversy and politicisation, it appears that outcomes were improved with increased discretion at the state, rather than federal, level. Consolidating implementation efforts within a single organisation (HHS) was associated with more expensive plans.
The consequence could have important implications for consumers’ and the federal government’s bottom lines in the 27 states relying on federally facilitated exchanges. These results suggest that federal management of exchanges leads to individuals paying more for health insurance coverage and cost sharing and the federal government paying more for low-income premium subsidies. It would be worthwhile for some states to reevaluate their decisions not to manage their HIEs. Although concerns about differences in state regulatory capacity and politics will remain, the evidence suggests that states are able to exert discretion in ways that produce better outcomes. Many states may benefit from building systems that are customised and responsive to their particular environments.
Acknowledgements
The author kindly thanks Laurence J. O’Toole Jr. and W. David Bradford at the University of Georgia for their helpful comments and guidance.


