


Introduction
The Patient Protection and Affordable Care Act (ACA), signed into law in 2010, is a policy aimed to expand access to high-quality, affordable healthcare to all Americans. Although President Obama, its progenitor, relied on deracialised rhetoric in his effort to sell the ACA to the American public, the bill was very adamant in its language and effort to address racial and ethnic disparities. Jamila Michener highlights, “[t]he text of the original bill (Pub. L. No. 111-148. 3-23-2010), contained 34 references to ‘disparities’, 28 references to either ‘discrimination’ or ‘nondiscrimination’, 33 instances using either the word racial or race, and 35 instances using either the word ethnicity or ethnic” (Reference Michener2020, 548). Additionally, there were several components of the bill that aimed to reduce racial inequity, including provisions to increase the number of people of colour in medical fields and to actively track the race, ethnicity, primary language, sex, and disability status of Medicaid and Children’s Health Insurance Program (CHIP) enrollees.
There were three key components of the policy that were central to its potential success: subsidies for out-of-pocket costs for low-income Americans; a mandate that individuals purchase health insurance; and the expansion of Medicaid to a wider swath of Americans, including those who were in the “coverage gap” – too well off to receive Medicaid, but not having a high enough income to afford private insurance. This third element provided a new path for a wide range of adults to gain access to a key form of social welfare. Sociologist Carmen Gutierrez (Reference Gutierrez2018) explains that for more than a century, adults’ access to healthcare primarily pivoted on linkages through the labour market, and familial or marriage attachments; the ACA’s Medicaid expansion decoupled these racially stratified and gendered relationships from access to care.
The ACA is also one of the most litigated and politically controversial pieces of legislation in American history. Although the efforts of Congressional Republicans to overturn the health policy were thwarted over fifty times, one key Supreme Court decision constrained the ability of the policy to have the swift and deep national impact Obama sought to have: National Federation of Independent Business versus Sebelius (2012) gave states a greater say in whether they would expand Medicaid under the ACA. The analysis in this article exploits this variation across states to explore racialised patterns of Medicaid transfers across the United States (US) between 2001 and 2019.
To be more precise, the ability for states to voluntarily elect to enhance or continue to constrain access to affordable healthcare does not create a true natural experiment, but it does allow us to leverage variation in decisionmaking over time, in a quasi-experimental way to explore racial dynamics in these decisions. Across a nearly 20-year period, we can assess how Medicaid outlays are allocated before and after the implementation of the ACA as well as between states which did or did not elect to expand Medicaid when the opportunity presented itself. More importantly, we can determine the extent to which these choices pivot on the racial dynamics at a granular, sub-state level. Scholars have revealed that geography is destiny, largely because “the services available to people from eligible populations … are determined not by what their problems are or the kinds of services they may need, but rather by where they happen to live” (Sandefur and Smyth Reference Sandefur and Smyth2011, v). We are motivated to empirically test this assessment here through an analysis of county-level Medicaid transfers and local racial demographics.
Here, we estimate the effect of the state-level decisions to expand Medicaid and county-level demographic characteristics on Medicaid-CHIP transfers received or requested by counties. This analysis seeks to capture, describe, and explain patterns of local implementation across thousands of communities. To do so, we use a difference-in-differences specification and allow the expansion effect to vary across counties with different African American population proportions. Our empirical strategy relies on an array of data, including the Regional Economic Information System (REIS), to measure federal Medicaid-CHIP transfers received by states on behalf of people in each county.
In doing so, this article makes two major contributions. First, we employ the quasi-experimental setting of American federalism; here we leverage state-level decisionmaking to expand Medicaid over a decade after the enactment of the ACA to add a new layer to our understanding of the subtleties of health policy in a racialised social system – that is, a society where social, political, and economic benefits are partially allocated along racial lines (Bonilla-Silva Reference Bonilla-Silva1997). Second, while most scholarship has served to clearly depict the patchwork of inequality at the state level, our data and analysis speak to variation at the sub-state level. Certainly, states decide whether to expand Medicaid, but local governments have great responsibility for healthcare delivery (Perez et al. Reference Perez, Ross and Simon2019; Montenevo, Simon, and Wing Reference Montenevo, Simon and Wing2020). The analyses that follow capture dynamics of inequality where health policies are implemented – at the local level. Consequently, we demonstrate more granular analyses of the effects of racially segregated localities on the allocation of health-related resources.
Traditionally, scholars might have turned to a theory of racial threat to predict the relationship between demographics and resources – that is, as the Black population increases, white threat does as well, leading to a decline in public resources (Key Reference Key1949; Fossett and Kiecolt Reference Fossett and Kiecolt1989; Giles and Buckner Reference Giles and Buckner1993). However, our analysis reveals something more complex. At the most basic level, we find that Medicaid expansion increases the funds that are sent to counties, but additional analyses show that the racial demographics of a county also serve to influence how federal resources are apportioned. Our analyses reveal a nonlinear relationship between the proportion of Black residents and the dispersal of federal funds. Specifically, we find that when White Americans compose a large proportion of the Medicaid-eligible population, there does seem to be a response to increases in racial diversity, whereby resources diminish. This finding, among largely White communities, provides evidence for a theory of racial threat. However, there is an inflection point that trends toward a positive relationship between the Medicaid transfers and the proportion of the Black population; that is to say, a critical mass of Black Americans may serve to turn the tide in the way resources are allocated. This finding can be well explained by a Black empowerment model. To be sure, this increase does not occur monotonically; there is yet another tipping point at which the initial uptick in resource allocation levels off. Overall, this complexity reveals that where one lives may diminish or enhance one’s access to resources designed to produce better health. Further, we see how a patchwork of inequality gets stitched together by a system of federalism.
The article unfolds in the following way. First, we briefly discuss the literature that highlights how federalism can be wielded to increase racial disparities through the politics of policy implementation. Then, we briefly outline three theories of race, politics, and policy – racial threat, “political acts of self-sabotage,” and Black political empowerment – to motivate our hypotheses regarding the relationship between federalism, Medicaid expansion under the ACA, and racialised patterns of resource allocation and implementation. Next, we delineate our empirical expectations, data, methods, and results. We end with a discussion of our findings as well as the limitations of this study.
Federalism, race, & the politics of policy implementation
A system of federalism in a racialised social system is a double-edged sword. “By shifting some difficult decisions from the federal government, states can tailor health reform to the needs of their stakeholders. But implementing reform through the states increases the number of elected officials able to influence implementation” (Jones et al. Reference Jones, Singer and Ayanian2014, 1965). This complexity is quite apparent when one looks at the states that have opted in and out of the opportunity to expand Medicaid. As of this writing, 39 states and Washington D.C. have expanded Medicaid for nonelderly, nondisabled, and low-income adults. The remaining 11 states that have elected not to expand have Medicaid populations composed of a low of 36% to more than 50% Black and Latinx Americans (Michener Reference Michener2021, 644). States that have expanded spent about $1,300 more per person on their low-income residents than states that have not (Han et al. Reference Han, Nguyen, Drope and Jemal2015). “Compared to the expansion [states], the nonexpansion [states] were significantly more likely to be female, black (25.6 vs. 16.8%), less educated, employed, living in non-MSA area (21.7 vs. 14.6%), uninsured (42.1 vs. 30.6%), and not currently enrolled in Medicaid” (Han et al. Reference Han, Nguyen, Drope and Jemal2015, 4).
To be sure, affordability and availability are not necessarily commensurate with access. While the federal government devolves power and resources to the state through Medicaid expansion, care occurs at the local level, which manifests unique racial dynamics. The ACA widened eligibility, but access to insurance does not address the structural inequalities related to availability of physicians and primary care providers, orientation toward care-seeking (which is shaped by historical and contemporary mistreatment by physicians), or the quality of care that one receives. Residentially segregated Black Americans are more likely to live in localities where access to healthcare is limited (White et al. Reference White, Haas and Williams2012).
Perez et al. (Reference Perez, Ross and Simon2019) also remind us, “States represent the level at which Medicaid operates, but local governments represent the level that engages in healthcare delivery: they are healthcare providers (owning hospitals), or else substantially supporting such providers financially” (9). Medicaid is insurance, which means that funds are requested after care is provided, so while the expansion of Medicaid provides a greater opportunity for local governments (e.g. county health departments, public hospitals) to provide more services which were previously uncompensated, it is up to the locality to determine whether it will, say, recruit or advertise these expanded services to its constituents.
Relatedly, Weissert (Reference Weissert1994) notes that there are some localities whose bureaucrats are more welcoming, willing to help clients, and have managerial styles that can encourage or discourage participation than in other localities. Beyond supply and demand, Weissert reveals that “community values can constrain participation if potential recipients feel stigmatised or feel discomfort” in relying on public resources (Reference Weissert1994, 229). Both matters of racial demographics and political ideology can influence the extent to which communities and its local bureaucrats value any particular public policy, which may consequently influence policy implementation; white and conservative localities are less open to public resources (especially when they are associated with people of colour) while Black and liberal localities are more empowered to wield the resources made available through the federal government for their life-affirming benefits (Weissert Reference Weissert1994; Keiser et al. Reference Keiser, Mueser and Choi2004; Davis et al. Reference Davis, Livermore and Lim2011; Lanford and Quadagno Reference Lanford and Quadagno2016).
Variation in policy implementation can also hinge on administrative burden and capacity. Administrative burden conceptually captures the barriers that both citizens and state actors face. Specifically, people can experience costs when “they search for information about public services (learning costs), comply with rules and requirements (compliance costs), and experience the stresses, loss of autonomy, or stigma that come from such encounters (psychological costs)” (Herd and Moynihan Reference Herd and Moynihan2018, 2). Local governments can directly increase or decrease learning and compliance costs: “Governments can increase learning and/or compliance costs through failing to raise awareness about a programme, limiting the availability of technical assistance, narrowing the range of application methods, making the application itself complicated, requiring additional documentation to access benefits, and shortening the time between initial application and reenrolment” (Willison et al. Reference Willison, Lillvis, Mauri and Singer2021, 9). For instance, research shows that gaps in health outcomes remain between White and Latinx residents even in states that expanded Medicaid. That is, even though more Latinx residents are eligible for benefits, they may face more obstacles to enrol, such as language barriers Yue et al. (Reference Yue, Rasmussen and Ponce2018). The administrative burdens could be eliminated through local-level policy and resource allocation to provide information in a broader set of languages, but addressing this issue requires a particular arrangement of administrative capacity and a community that is politically or ideologically open to the inclusion of all of its residents.
Some localities do manage to get a higher return on their investment regarding administrative capacity. Research has shown this in localities where Black Americans have greater political empowerment, as measured by descriptive/passive representation; in these cases, all residents, regardless of race, are more likely to receive beneficial rather than punitive aspects of public resource allocation and policy (Davis et al. Reference Davis, Livermore and Lim2011). Taken together, if we are cognizant that healthcare resources are allocated within local governing institutions and specific racialised contexts, we gain more perspective and predictive leverage.
Theoretical development and hypotheses
General effects of Medicaid expansion
As one moves from state to state, there is a vast array of differences in coverage (Michener Reference Michener2018). Variation in the details, generosity, and implementation of each state’s version of the Medicaid programme leads to differences in the scope of expansion across states. Likewise, recent work suggests that the effects of the expansion also vary across geographic areas within states because some areas have more newly eligible population than others (Duggan et al. Reference Duggan, Goda and Jackson2019; Courtemanche et al. Reference Courtemanche, Marton, Ukert, Yelowitz, Zapata and Fazlul2019; Montenevo et al. Reference Montenevo, Simon and Wing2020). Using spatial variations in pre-ACA rates of uninsured population, scholars have found heterogenous ACA treatment effects on health insurance coverage (Duggan et al. Reference Duggan, Goda and Jackson2019), state’s spending (Gruber and Sommers Reference Gruber and Sommers2019), savings (Bachrach et al. Reference Bachrach, Guyer and Levin2016), and redistribution of federal transfers across counties (Montenevo et al. Reference Montenevo, Simon and Wing2020). Overall, we expect to find that there is a great deal of intrastate differences in resource allocation, whereby these differences pivot on racial demographics and dynamics.
First, implementation of the ACA ought to lead to greater allocations of resources, but we also expect that racial demographics may influence these allocations given the fact that while Black Americans constitute only 14% of the nation, they comprise large proportions of Medicaid-eligible populations. Medicaid is a means-tested programme, and race and income (and poverty) are highly linked in American society. As such, we expect counties in states that have chosen to expand Medicaid will see more funds allocated for their constituents. Further, since race and access to insurance are closely linked, we should see that those counties that have more Black residents should attain more Medicaid funding. These are two basic and intuitive hypotheses, that perhaps hinge on the idea that policy may be implemented in an equitable way:
H1: Counties in states that have undergone expansion will see greater funds allocated to local coffers than counties in states that did not expand Medicaid under the ACA. (Medicaid Expansion)
H2: As counties’ populations have an increasing number of Black residents, the counties will see greater funds. (Share of Black population)
Racial threat
Scholars have long noted that whites’ racial animus toward Black Americans has influenced white attitudes towards resource allocation. Broadly speaking, research reveals that measures of white racial hostility are more often than not correlated with more conservative policy outcomes, such as a more prevalent use of the death penalty (Baumgartner et al. Reference Baumgartner, Davidson, Johnson, Krishnamurthy and Wilson2017), stingier welfare resource allocation (DeSante Reference DeSante2013), and constrained healthcare benefits (Tesler Reference Tesler2012). In a democracy, public opinion often shapes public policy; in the US, white Americans’ opinions tend to have more influence on major policy outcomes.
V.O. Key (Reference Key1949) in Southern Politics introduced a Black concentration hypothesis, which asserted that “[t]hose whites who live in counties with populations 40, 50, 60, or even 80% Negro share a common attitude toward the Negro,” characterised by “white supremacy” and an antiblack policy orientation. Additionally, Key wrote that “[i]f the whites of the black belts give the South its dominant political tone, the character of the politics … will vary roughly with the Negro proportion of the population” (Key Reference Key1949; Acharya et al. Reference Acharya, Blackwell and Sen2018). Similarly, Hubert Blalock (Reference Blalock1967) explicated a theory of “racial threat,” which predicted that when white Americans feel threatened due to increasing proportions of Black folks in a space, we should expect them to respond in a way that produces racially inequitable outcomes in policy. In this vein, scholars have shown time and again that “the larger the state’s nonwhite population is, the less money its leaders tend to devote to welfare programmes that disproportionately benefit minorities” (Kousser Reference Kousser2002, 657). Additionally, scholarship reveals that counties with larger Black populations tend to provide fewer social welfare benefits, rely more on punitive policy options, and shift their political preferences in a conservative direction (Fossett and Kiecolt Reference Fossett and Kiecolt1989; Giles and Buckner Reference Giles and Buckner1993; Soss et al. Reference Soss, Fording and Schram2011).
With regard to our specific concerns, a theory of racial threat would lead one to predict that the effect of Medicaid expansion on county-level outlays would be moderated by the proportion of Black Americans in a county. Local governments are largely responsible for allocating care, but the energy and effort which localities employ to ensure that their vulnerable populations receive the resources they need vary greatly, especially when the group that is mostly associated with the policy is considered undeserving (Schneider and Ingram Reference Schneider and Ingram1993). Thus, a hypothesis guided by Key’s “black concentration thesis” and Blalock’s “racial threat hypothesis” would lead one to predict that as the proportion of Black Americans increases in the population, there will be a monotonic decline in allocated funds, or, in the best-case scenario, any increase in funds would decrease to lower rate of change in comparison to a locality with many fewer Black constituents. Put simply:
H3: When Medicaid is expanded, counties that have greater proportions of Black residents will see less funds allocated to them (or the increase of funds will occur at a lower rate).
Despite their longevity, a consensus around the “racial threat” or “black concentration” theses has yet to arise. Taylor (Reference Taylor1998, 532) argues “Causal links between region and racial concentration are too intricate for effects of these predictors on racial attitudes to be neatly disentangled in multivariate analysis.” Still more, Giles (Reference Giles1977, 412) asserts, “The black concentration generalization…assumes a relationship between an aggregate level variable, per cent black, and an individual level variable, racial attitude.” Finally, and most recently, Acharya et al. (Reference Acharya, Blackwell and Sen2018, 630) reveal evidence to the contrary of this long-standing thesis; they note that after “[accounting] for slavery in 1860, contemporary black concentrations appear to have the opposite effect that racial threat theory would predict for Southern white attitudes.” While the racial threat hypothesis has been helpful in explaining a range of political outcomes, there are two additional theories worthy of consideration to develop hypotheses concerning the allocation of public resources across varied geographic and demographic realities: the politics of self-sabotage and Black political empowerment.
Politics of self-sabotage
A “racial threat” hypothesis implies that white Americans in predominately white communities will enhance benefits for themselves, so long as they can sequester benefits to their group. However, contemporary American politics provides a challenge to this assumption: low-income, white Americans – especially in economically declining, rural, predominately white localities – have shown a propensity to support policies that are antithetical to their material well-being. Scholars across disciplines have found that when conservative elites frame policy issues, such as social welfare policies and healthcare, as dispensing hard-working taxpayer dollars to “undeserving” populations, such as Blacks, Latinos, and nonwhite immigrants, white Americans who are attuned to the sound of racial dog whistle politics, view the policy through zero-sum dynamics rather than through one of expanded resources for all Americans (Haney López Reference Haney López2015; Metzl Reference Metzl2019). Even in places where there are few people of colour, whites’ orientation toward racialised policies can constrain the allocation of beneficial policies, such as Medicaid expansion.
White Americans who have high levels of racial resentment are more concerned with maintaining a status quo which is often perpendicular to their physical and financial well-being – than implementing policies that may serve a broader, more racially diverse swath of Americans (Metzl Reference Metzl2019). To be more specific, Metzl’s (Reference Metzl2019) interviews with low- and middle-income whites in Southern and Midwestern states, coupled with analysis of population health data, reveal what he calls “political acts of self-sabotage” in the form of worse health outcomes, for the sake of the preservation of white racial identity. These politics and policies gain support by invoking racial resentment and extolling white victimhood at the hands of undeserving nonwhite others. This backlash conservatism translates into backlash governance as white conservative voters pressure conservative political leaders to reject policies they are convinced will benefit undeserving others; they are willing to sacrifice the benefits they will accrue to deny racial others benefits. This allows for the enactment of conservative policies supportive of reducing government services, such as the ACA, that would improve healthcare access for those same white voters who reject it.
As previously mentioned, community orientations and the political environment around public policies that allocate benefits such as welfare and Medicaid may influence the ways in which policies are implemented (Weissert Reference Weissert1994). Given that race, political ideology, and partisanship are linked, one might not simply expect white Americans under the guise of “racial threat,” to be inclined to constrain resource allocation (for others), but also that a politics of self-sabotage would also reduce healthcare resource allocation for predominately white communities as well. This theory would lead one to expect that places that have high proportions of white Americans/low proportions of Black Americans to have relatively low Medicaid outlays, even when eligibility is controlled for:
H4: Even when Medicaid is expanded, counties that are predominately White/low proportions of Black Americans will see low levels of resource allocation.
Black empowerment
Scholars of Black politics have provided further evidence that the relationship between the Black population and the effects of white “racial threat” is not linear. Specifically, we would expect to find that at some tipping point, Black residents may amass enough power that a sense of “white threat” in an otherwise racially segregated space is moot. “Indeed, one might expect that, in places where many people of colour live, the aggregate racial animus may be lower because Blacks, Latinos, and Asian Americans register lower levels of racial resentment” (Smith et al. Reference Smith, Kreitzer and Suo2020).
Moreover, localities with greater racial diversity are also more likely to elect representatives of colour, and those representatives are more likely to represent the interests of their historically marginalised constituents through liberal policymaking and progressive-leaning policy designs (Reingold et al. Reference Reingold, Haynie and Widner2020). With this in consideration, one might expect to find that in places where African Americans represent a significant portion of the population, they gain the benefits of full political incorporation via beneficial policy outputs (Browning et al. Reference Browning, Marshall and Tabb1984; Benjamin Reference Benjamin, Smith and Greer2019). For instance, Davis et al. (Reference Davis, Livermore and Lim2011) show that when Black Americans are descriptively represented and represented by a person who seeks to do a great deal of community outreach, all members of the local community, regardless of race, are more likely to receive beneficial components of public policy.
To be sure, there are limitations to Black political empowerment in a racialised social system. An increase in the Black population does not necessitate a monotonic increase in resource allocation. For instance, Benjamin (Reference Benjamin, Smith and Greer2019) reveals that even in some “majority-minority” communities, Black voters do not always have the upper hand; in the case of Durham, NC for instance, “progressive” candidates were elected in local elections with the help of white Democrats, but Black voters did not necessarily support the same suite of liberal candidates. Still more, incredibly high residential segregation does not bode well for Black Americans across an array of domains, including access to affordable high-quality food, healthcare, and schools even if there is favourable political leadership. Additionally, history shows that when Black Americans have been able to elect candidates of their choice, due in large part to state-driven residential seclusion, Black mayors in cities like Detroit and Cleveland, for instance, were not able to turn their political mandate into material outcomes due to white flight, the exit of business to the suburbs, and depleted tax bases; these issues were exacerbated when the federal government made a neoliberal turn. This phenomenon is referred to as the “hollow prize” (Friesema Reference Friesema1969; Kraus and Swanstrom Reference Kraus and Swanstrom2001), and it highlights further complexities concerning patterns of resource allocation.
Taken together, this body of research suggests that Black constituencies in some cases have the agency and ability to amass political power as their size of the population increases, to some extent. In localities where Black Americans make up a consequential portion of the constituency, they can elect representatives who are apt to diminish administrative burdens. To be sure, while we expect the racial dynamics of a locality to influence resource allocation, we do not expect the influence of the size of the Black population to be linear; that is to say, we do not expect a monotonic increase as the proportion of Black Americans increases. Instead, it is safer to expect the existence of a tipping point at which greater proportions of Black constituents in a locality will translate to a greater allocation of resources, followed by a levelling off.
H5: As counties’ Black populations increase, so will Medicaid reimbursements, to some extent; at tipping point, the benefits will level off even with additional proportions of Black Americans.
A summary of hypotheses
Generally speaking, we expect that the expansion of Medicaid due to the implementation of the ACA will increase Medicaid outlays (H1). However, the US is a racialised social system, and thus, we expect racial dynamics to complicate the allocation of resources across the country. If resources were allocated in direct response to need, one would be safe to predict that as the proportion of Black constituents increased, so would Medicaid resources given the connection between race, income, and health (H2). However, scholars have noted that when concentrations of Black Americans increase, white racial threat would serve to reduce the allocation of public resources (H3), but more recent research produces challenges to this traditional hypothesis. One challenge arises from scholarship that reveals that even in predominately white communities that are in need of public resources, political acts of self-sabotage lead to a phenomenon Metzl (Reference Metzl2019) calls dying of whiteness. Here, we may find that due to a dismissal of public resources that are racialised as Black, white communities may elect not to access Medicaid resources; this theory leads to the prediction that even in predominately white communities where need is high, resource allocation may be low (H4). Still more, a Black empowerment hypothesis serves to challenge the racial threat model, in so far as when Black Americans increase in population, they may be able to wield greater power and representation that serves to increase access to Medicaid outlays; though this increase comes with the caveat: at some tipping point resources will level off rather than increase in direct response to need (H5). We consider several conflicting models of possibility. We leverage our data and methods to discern which of these theories best help to explain what occurs empirically.
Data & methods
The empirical analysis is based on a balanced panel data set composed of 3,001 counties over the 2000–2019 period. The 142 counties excluded from our sample have missing values for one or more of our measures of interest. In our analytic sample, 1,609 counties belong to states that expanded Medicaid due to the ACA, while 1,392 are in states that did not adopt the ACA Medicaid expansions as of 2019. Our data include measures of federal Medicaid-CHIP transfers, racial group demographics, and newly eligible population in each county.
The main dependent variable in our analysis is a county-level measure of per capita federal Medicaid-CHIP transfers. To construct this variable, we use information from the Bureau of Economic Analysis (BEA). Using data from the Centers for Medicare and Medicaid Services, BEA estimates the total value of federal Medicaid-CHIP transfers received by people in each county. These estimates are provided through the REIS. We divide total transfers by the county population to obtain per capita transfers. The average value of transfers in expansion counties is $152,711 and $73,180 in nonexpansion counties (See Table 1).
Table 1. Descriptive statistics
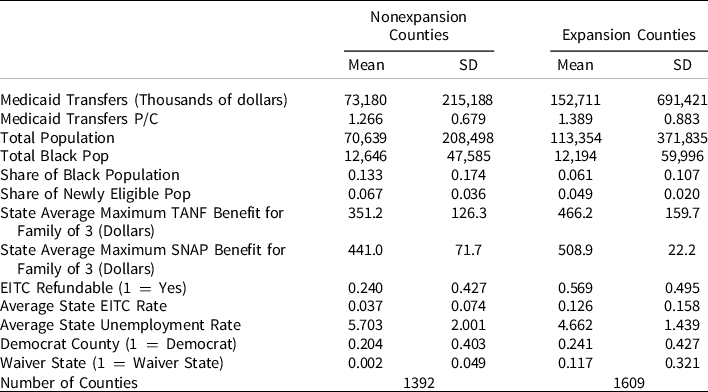
Sources: BEA = Bureau of Economic Analysis; US. Census Bureau, Population Division, ACS = American Community Survey; SAHIE = Census Bureau’s Small Area Health Insurance Estimates; University of Kentucky’s Center for Poverty Research Database; MEDSL = MIT Election Data and Science Lab.
Notes: The table presents the mean and standard deviation (SD) of the variables utilised in our analyses. The statistics are at the county level for the period 2000–2019. The following variables measure characteristics at the state level: Average Maximum TANF, Average Maximum SNAP, EITC Refundable, Average EITC Rate, Average Unemployment Rate. Medicaid transfers per capita are measured as thousands of dollars per person.
To measure racial group dynamics, we use data from the American Community Survey (ACS). The survey asks respondents their race or ethnicity. From this question, we create a binary variable equalling one if the respondent identifies him or herself as “Black or African American.” We then aggregated the variable at the county level and divided the number by the county population to obtain the share of the Black population in each county. Nonexpansion counties have an average share of Black American population of 13%, while expansion counties have 6%.
We also add total population and share of newly eligible population as control variables in our analysis. We obtained total population measures from the US. Census Bureau, Population Division. It is expected that the fiscal consequences of the ACA Medicaid expansion for a given county depend on how many people become eligible for Medicaid because of the expansion. Counties with more Black Americans are highly segregated, which tends toward lower incomes and greater numbers of people who will be eligible for Medicaid under the expansion rules. Thus, it becomes crucial to control for this number in our analysis. However, no perfect measure of the size of the newly eligible population in each county exists. As a result, following Montenevo et al. (Reference Montenevo, Simon and Wing2020), we approximate the pre-ACA size of the newly eligible population using the Census Bureau’s Small Area Health Insurance Estimates (SAHIE). Specifically, we obtained the number of uninsured nonelderly adults (ages 18 to 64) with income below 138% of the federal poverty line who resided in each county in 2010. To construct a baseline measure of newly eligible population in each county, we divide the number of uninsured nonelderly adults (ages 18 to 64) with income below 138% of the federal poverty by the county population.
As mentioned, Medicaid transfers occur when clients attain services and providers are reimbursed through this form of insurance, so while resources are more affordable, availability and implementation vary within and across states due to an array of reasons some of which we attempt to control for. One of these factors concerns state generosity. Some states are more likely to make public resources more available than others. To account for this, we add measures of the maximum Temporary Assistance for Needy Families (TANF) and Supplemental Nutrition Assistance Program (SNAP) benefit amount for a family of three, the state Earned Income Tax Credit (EITC) rate, and whether the EITC is refundable. We obtain all these variables from the University of Kentucky’s Center for Poverty Research Database (University of Kentucky Center for Poverty Research 2023).
Our data extend over a relatively long period of time, thus capturing not only the wave of states that opted-in early but also those who opted-in late and did so with the addition of potential administrative burdens. Earlier scholarly assessments of changes in access to insurance largely capture states who were politically aligned with the Obama administration, but the states that opted-in during later years, which we include in our analysis, have tended (a) to be states whose populations are in greater need and (b) have expanded under the Trump administration, which allowed a wider use of 1115 Waivers that bend toward an ideology of “personal responsibility” (Freedman et al. Reference Freedman, Richardson and Simon2018; Hermer Reference Hermer2018; Michener Reference Michener2021). Well-illustrated by the array of Clinton-era policies that employed the rhetoric of personal responsibility (e.g. The Personal Responsibility and Work Opportunity Reconciliation Act of 1996; Illegal Immigration Reform and Immigrant Responsibility Act of 1996), these policy designs served to the detriment of historically marginalised groups. Our analysis controls for the implementation of the Section 1115 Waivers that allow states to impose work requirements as a condition of Medicaid eligibility. By 2020, 10 states were approved to implement work requirements: Arizona, Arkansas, Indiana, Kentucky, Michigan, New Hampshire, Ohio, South Carolina, Utah, and Wisconsin (Soni et al. Reference Soni, Gian, Simon and Sommers2020).
In addition, we take a note from the research that highlights the role of the political environment and role of political context on policy implementation; further, an implicit assumption in our hypotheses concerns the roles of partisan elections and political representation. As such, we add a dummy variable that equals 1 in counties where the Democrat candidate won in a presidential election. Data for this variable come from the MIT Election Data and Science Lab (MEDSL). Finally, we add a control that adjusts for a state’s economic health: unemployment rate. This variable was also acquired from the University of Kentucky Center for Poverty Research.
Econometric model
To estimate the effect of the ACA Medicaid expansion and racial demographics on federal Medicaid-CHIP transfers received by counties, we use a triple difference-in-differences approach. This research design exploits both variation in the timing of policy implementation and in policy exposure, together with variation in racial demographics across counties. This design has been used extensively in the literature related to the ACA (see for example, Courtemanche et al. Reference Courtemanche, Marton, Ukert, Yelowitz, Zapata and Fazlul2019; Montenevo et al. Reference Montenevo, Simon and Wing2020; Valdovinos et al. Reference Valdovinos, Niedzwiecki, Guo and Hsia2020).
We fit regression models with interaction terms that allow to account for ACA’s heterogenous effects on federal Medicaid-CHIP transfers, based on racial demographics. To do so, we estimate the following model:
 $$\begin{gathered}{Y_{cst}} = \alpha AC{A_{st}} + \gamma Black\;Shar{e_{cst}} + \beta \left( {AC{A_{st}} \times Black\;Shar{e_{cst}}} \right) + {{\text{X}}_{cst}}{\delta _i} + {{\text{X}}_{st}}{\lambda _i} \\ \!\!\!\!\!\!\!\!\!\!\!\!\!\!\!\!\!\!\!\!\!\!\!\!\!\!\!\!\!\!\!\!\!\!\!\!\!\!\!\!\!\!\!\!\!\!\!\!\!\!\!\!\!\!\!\!\!\!\!\!\!\!\!\!\!\!\!\!\!\!\!\!\!\!\!\!\!\!\!\!\!\!\!\!\!\!\!\!\!\!\!\!\!\!\!\!\!\!\!\!\!\!\!\!\!\!\!\!\!\!\!\!\!\!\!\!\!\!\!\!\!\!\!\!\!\!\!\!\!\!\!\!\!\!\!\!\!\!\!\!\!\!\! + {\eta _c} + {\eta _t} + {\varepsilon _{cst}} \\ \end{gathered}$$
In the model, ${Y_{cst}}$
is a measure of Medicaid-CHIP transfers per capita in the county c in state s in year t.
${Y_{cst}}$
is a measure of Medicaid-CHIP transfers per capita in the county c in state s in year t. $\gamma Black{\rm{\;}}Shar{e_{cst}}$
measures the share of Black population in county c in state s in year t.
$\gamma Black{\rm{\;}}Shar{e_{cst}}$
measures the share of Black population in county c in state s in year t. ${\eta _c}$
and
${\eta _c}$
and ${\eta _t}$
represent county and time fixed effects, respectively.
${\eta _t}$
represent county and time fixed effects, respectively. ${{\rm{X}}_{cst}}$
is a vector of county-level variables that change across time, and
${{\rm{X}}_{cst}}$
is a vector of county-level variables that change across time, and ${{\rm{X}}_{st}}$
is a vector of state-level variables that change across time. Importantly, we include each of these variables by itself, as well as interacted with the indicator variable for the ACA. We do so to account for any change in the transfers, due to these variables, that happened at the same time or after a given state adopted the ACA.
${{\rm{X}}_{st}}$
is a vector of state-level variables that change across time. Importantly, we include each of these variables by itself, as well as interacted with the indicator variable for the ACA. We do so to account for any change in the transfers, due to these variables, that happened at the same time or after a given state adopted the ACA. $\alpha $
represents the effect of the ACA on federal Medicaid-CHIP transfers per capita among counties. As suggested in hypothesis 1, we expect
$\alpha $
represents the effect of the ACA on federal Medicaid-CHIP transfers per capita among counties. As suggested in hypothesis 1, we expect $\alpha \gt 0.$ $\gamma $
measures the independent effect of race on federal Medicaid-CHIP transfers per capita among counties. Since Black Americans are less likely to have medical insurance and more likely to be low or moderate income, more people will likely enrol in Medicaid in counties with larger shares of the Black population. Thus, we expect transfers to increase as the share of the Black population increases,
$\gamma $
measures the independent effect of race on federal Medicaid-CHIP transfers per capita among counties. Since Black Americans are less likely to have medical insurance and more likely to be low or moderate income, more people will likely enrol in Medicaid in counties with larger shares of the Black population. Thus, we expect transfers to increase as the share of the Black population increases, $\gamma \gt 0$
, as stated in hypothesis 2.
$\gamma \gt 0$
, as stated in hypothesis 2. $\beta $
measures how the size of the effect of the ACA changes as a function of the African American population share in the county. Based on hypothesis 3 and 4, we expect
$\beta $
measures how the size of the effect of the ACA changes as a function of the African American population share in the county. Based on hypothesis 3 and 4, we expect $\beta \lt 0$
. Following Montenevo et al. (Reference Montenevo, Simon and Wing2020), we relax the linearity assumption and examine models where the treatment effect can vary according to a more flexible specification. We present results from a quadratic polynomial model. The coefficient for the linear term, in the quadratic model, allows us to test hypothesis 3 and 4, whereas the coefficient for the quadratic term allows us to test hypothesis 5.
$\beta \lt 0$
. Following Montenevo et al. (Reference Montenevo, Simon and Wing2020), we relax the linearity assumption and examine models where the treatment effect can vary according to a more flexible specification. We present results from a quadratic polynomial model. The coefficient for the linear term, in the quadratic model, allows us to test hypothesis 3 and 4, whereas the coefficient for the quadratic term allows us to test hypothesis 5.
Two key identifying assumptions need to hold for this analysis to be able to uncover causal effects. First, our difference-in-difference framework assumes that federal Medicaid transfers per capita would have followed a common trend across all counties in the absence of the ACA expansions. Second, a difference-in-difference analysis assumes strict exogeneity, which implies that unmeasured determinants of federal Medicaid transfers are uncorrelated with the entire history of the ACA expansion variable in the state.
One way of assessing the plausibility of the strict exogeneity assumption is through an event study analysis. Event study regressions allow us to track changes in Medicaid transfers in the years before and after the programme was implemented in each county. The following equation presents the event study approach we follow:
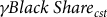
 $$\begin{gathered}{Y_{cst}} = \sum\nolimits_{j = - 7}^{ - 2} {\left( {{\beta _j}D{{\left( j \right)}_{st}}\; + {\alpha _j}\left( {D{{\left( j \right)}_{st}} \times Black\;Shar{e_{cst}}} \right)} \right)} \; \\ \,\,\,\,\,\,\,\,\,\,\,\,\,\,\,\,\,\,\,\,\,\,\,\,\,\,\,\,\,\,\,\,\,\,\,\,\,\,\,\,\,\,\,\,\,\,\,\,\,\,\,\,\,\,\,\,\,\,\,\,\,\,\,+ \sum\nolimits_{h = 0}^3 {\left( {{\theta _h}D{{\left( h \right)}_{st}}\; + {\delta _h}\left( {D{{\left( h \right)}_{st}} \times Black\;Shar{e_{cst}}} \right)} \right)} \; + {\eta _c} + {\eta _t} + {\varepsilon _{cst}} \\ \end{gathered}$$
In the model, ${\beta _j}{\rm{\;}}and{\rm{\;}}{\alpha _j}$
coefficients measure changes of the outcome variable as a response to future policy changes and whether anticipation effects vary with the counties’ share of African Americans. These coefficients need to be equal to zero as, under strict assumption of exogeneity, future changes due to the programme should not affect current outcomes. The
${\beta _j}{\rm{\;}}and{\rm{\;}}{\alpha _j}$
coefficients measure changes of the outcome variable as a response to future policy changes and whether anticipation effects vary with the counties’ share of African Americans. These coefficients need to be equal to zero as, under strict assumption of exogeneity, future changes due to the programme should not affect current outcomes. The ${{\rm{\theta }}_{\rm{h}}}{\rm{\;}}and{\rm{\;}}{\delta _h}{\rm{\;}}$
coefficients measure the effects of the policy variable during each postadoption period, and how that effect varies across counties with different levels of African American population. In other words, these coefficients tell us whether programme effects vary across time.
${{\rm{\theta }}_{\rm{h}}}{\rm{\;}}and{\rm{\;}}{\delta _h}{\rm{\;}}$
coefficients measure the effects of the policy variable during each postadoption period, and how that effect varies across counties with different levels of African American population. In other words, these coefficients tell us whether programme effects vary across time.
Results
Table 1 reports descriptive statistics associated with counties located in nonexpansion states and expansion states. The expansion counties have larger populations than the nonexpansion counties. The average population in nonexpansion counties is 113,354. In comparison, the average nonexpansion county has 70,639 people. Therefore, total Medicaid transfers are much higher in the expansion counties. Conversely, the share of Black population is smaller in expansion counties compared to the Black population in nonexpansion counties: 6 and 13%, respectively. Importantly, counties in expansion states receive more resources in public assistance than nonexpansion counties and are slightly more pro-Democratic.
Difference-in-difference
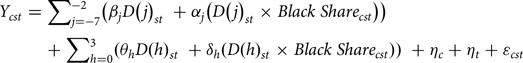
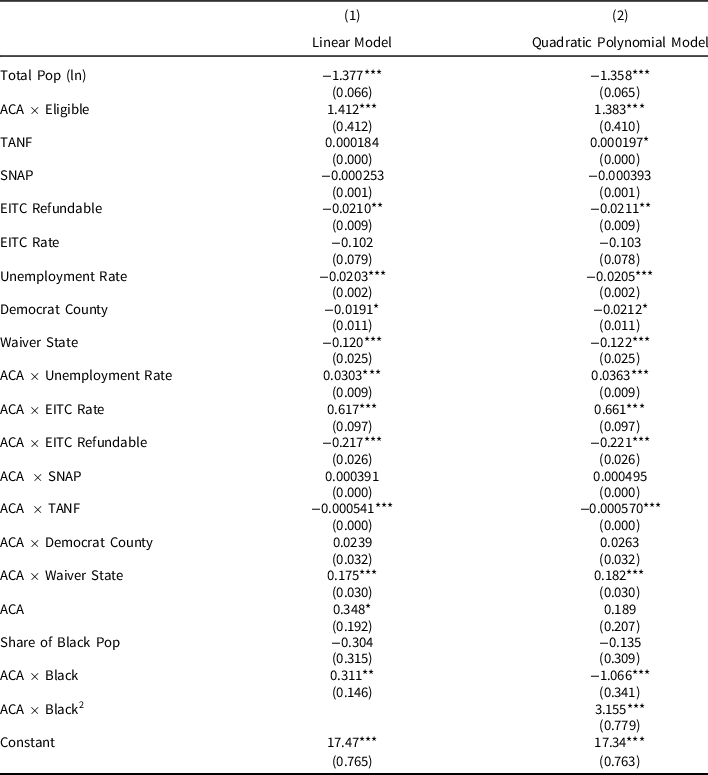
Table 2 reports only the main coefficients from two models of the effects of the ACA Medicaid expansions on federal Medicaid-CHIP transfers per capita. Importantly, the models include all the controls, but we only show the coefficients related to our hypotheses for convenience of the reader. The complete models, which include controls, are reported Table A1 in the Appendix. Each model allows for a different degree of flexibility in how we specify the variable on Black population share. All models are based on county-level data from 2000 to 2019, and they include county-fixed effects, year-fixed effects, and control variables. The first model in Table 2 has an interaction term between the ACA expansion variable and Black population share. In the second model, we interact the ACA expansion variable with a quadratic function of the Black population share. We also ran models that account for the fact that some states expanded Medicaid before the ACA, and our results remain consistent.Footnote 1
Table 2. Effect of ACA expansion on county-level per Capita Medicaid transfers: heterogeneity by share of black population – main coefficients
Notes: Standard errors in parentheses. *p < 0.10 **p < 0.05 ***p < 0.01. Standard errors are clustered at the County level. Years considered are between 2000 and 2019. All models include year-fixed effects and county-fixed effects. The regressions control for the following county-level variables: total population, share of Medicaid’s newly eligible population and whether the Democrat candidate won in a presidential election. It also includes state-level control variables: the maximum Temporary Assistance for Needy Families (TANF) and Supplemental Nutrition Assistance Program (SNAP) benefit amount for a family of three, the state Earned Income Tax Credit (EITC) rate, and whether the EITC is refundable, implementation of the Section 1115 Waivers, and unemployment rate.
The two models show that ACA expansion increased federal Medicaid transfers per capita. However, in the quadratic polynomial model the coefficient does not reach statistical significance. In other words, models 1 and 2 provide partial support for hypothesis 1 (H1). In regard to H2, the models suggest that the counties with a larger Black population receive less federal Medicaid transfers, regardless of the ACA, but the coefficients indicating an independent effect of the demographic character of counties are not statistically significant. The direction of these coefficients may speak to the fact that states that chose not to expand public coverage were disproportionately southern and disproportionately Black as shown in Table 1.
The remainder of the key coefficients will help us to better pinpoint the relationship between local demographic characteristics and Medicaid transfers. We remind our readers that we seek to test three ostensibly contradicting hypotheses rooted in the race, politics, and policy literatures. Each provides different expectations of the world. H3, relying on a racial threat hypothesis, asserted that when Medicaid is expanded, county transfers will be moderated by greater proportions of Black residents and, thus, will see less funds allocated to them; implicitly when there are more eligible white residents, more funds will be allocated. H4, leaning toward a theory of political acts of self-sabotage, suggests that even when an area has few Blacks/many Whites who are eligible, resources will still remain low. Meanwhile, H5, centring a Black empowerment theory, predicted that we will not necessarily see a linear relationship between the Black population size and financial outlays, but we may see an increase as the Black population reaches a critical mass, followed by a levelling off at a tipping point rather than a continued uptick in response to the proportion of Black folks in need of resources.
To begin, the interaction variable between ACA expansion and Black population proportion in Model 1 suggests that there is a positive and statistically significant effect of the ACA in the proportion of the Black population. Among those counties that have experienced Medicaid expansion, Medicaid outlays increase as the proportion of the Black population increases. This provides evidence against the racial threat hypothesis (H3). As one will recall, racial threat theory suggests that as the Black population increases, resources will decrease, but that is not what Model 1 shows. However, it is important to note that a linear model weighs typical cases more heavily than those on the edges; in this case, the typical county is somewhere between 25 and 40% African American. So, it is important to develop a model that can more precisely tell us whether the counties on the outer bounds tell us the same story as the typical county. Model 2 does that.
The quadratic model tells a more nuanced story. Here, rather than simply rely on one interaction term, the two interaction terms in tandem tell US more complex and more complete story; the quadratic model fits the data better than the linear model. First, the linear term of the quadratic model is both negative and statistically significant. This coefficient suggests that the effect of the ACA decreases as the proportion of the Black population increases, but this only depicts reality for counties with relatively small Black population proportions. Second, the coefficient of the Black population share-squared in Model 2 is positive and statistically significant, suggesting that, at higher levels of Black population, the effect of the ACA starts to increase with the Black population share around 25%. Model 2 shows evidence that the relationship of concern is not linear.
Figure 1 plots the predicted values of Medicaid transfers per capita as a function of the share of Black population from the quadratic model. Figure 1 alongside Model 2 provides support for two of three of the proposed theories. For communities with relatively low levels of Black Americans, the racial threat hypothesis (H3) seems to be in play rather than a politics of self-sabotage hypothesis (H4). That is, when Black populations are between 0 and around 25%, Medicaid outlays start relatively high and then decrease as the proportion of Black folks increases. (To be sure, Figure 1 reveals that there are relatively homogenous white communities that receive below average levels benefits.) But, the quadratic model also reveals that while Medicaid transfers per capita decline at lower levels of Black population share, the trend changes and starts to increase when the share of Black population is around 25%. Here, we find that in localities where Black folks make up moderate or typical levels of representation, there is an increase in Medicaid outlays as the Black population increases. However, this uptick in response to the Black population does not continue monotonically. After Black Americans compose around 50% of the population, there is a flattening of the effect of ACA expansion on Medicaid outlays. This second component, evidenced by Model 2, provides evidence for H5, the Black empowerment hypothesis.
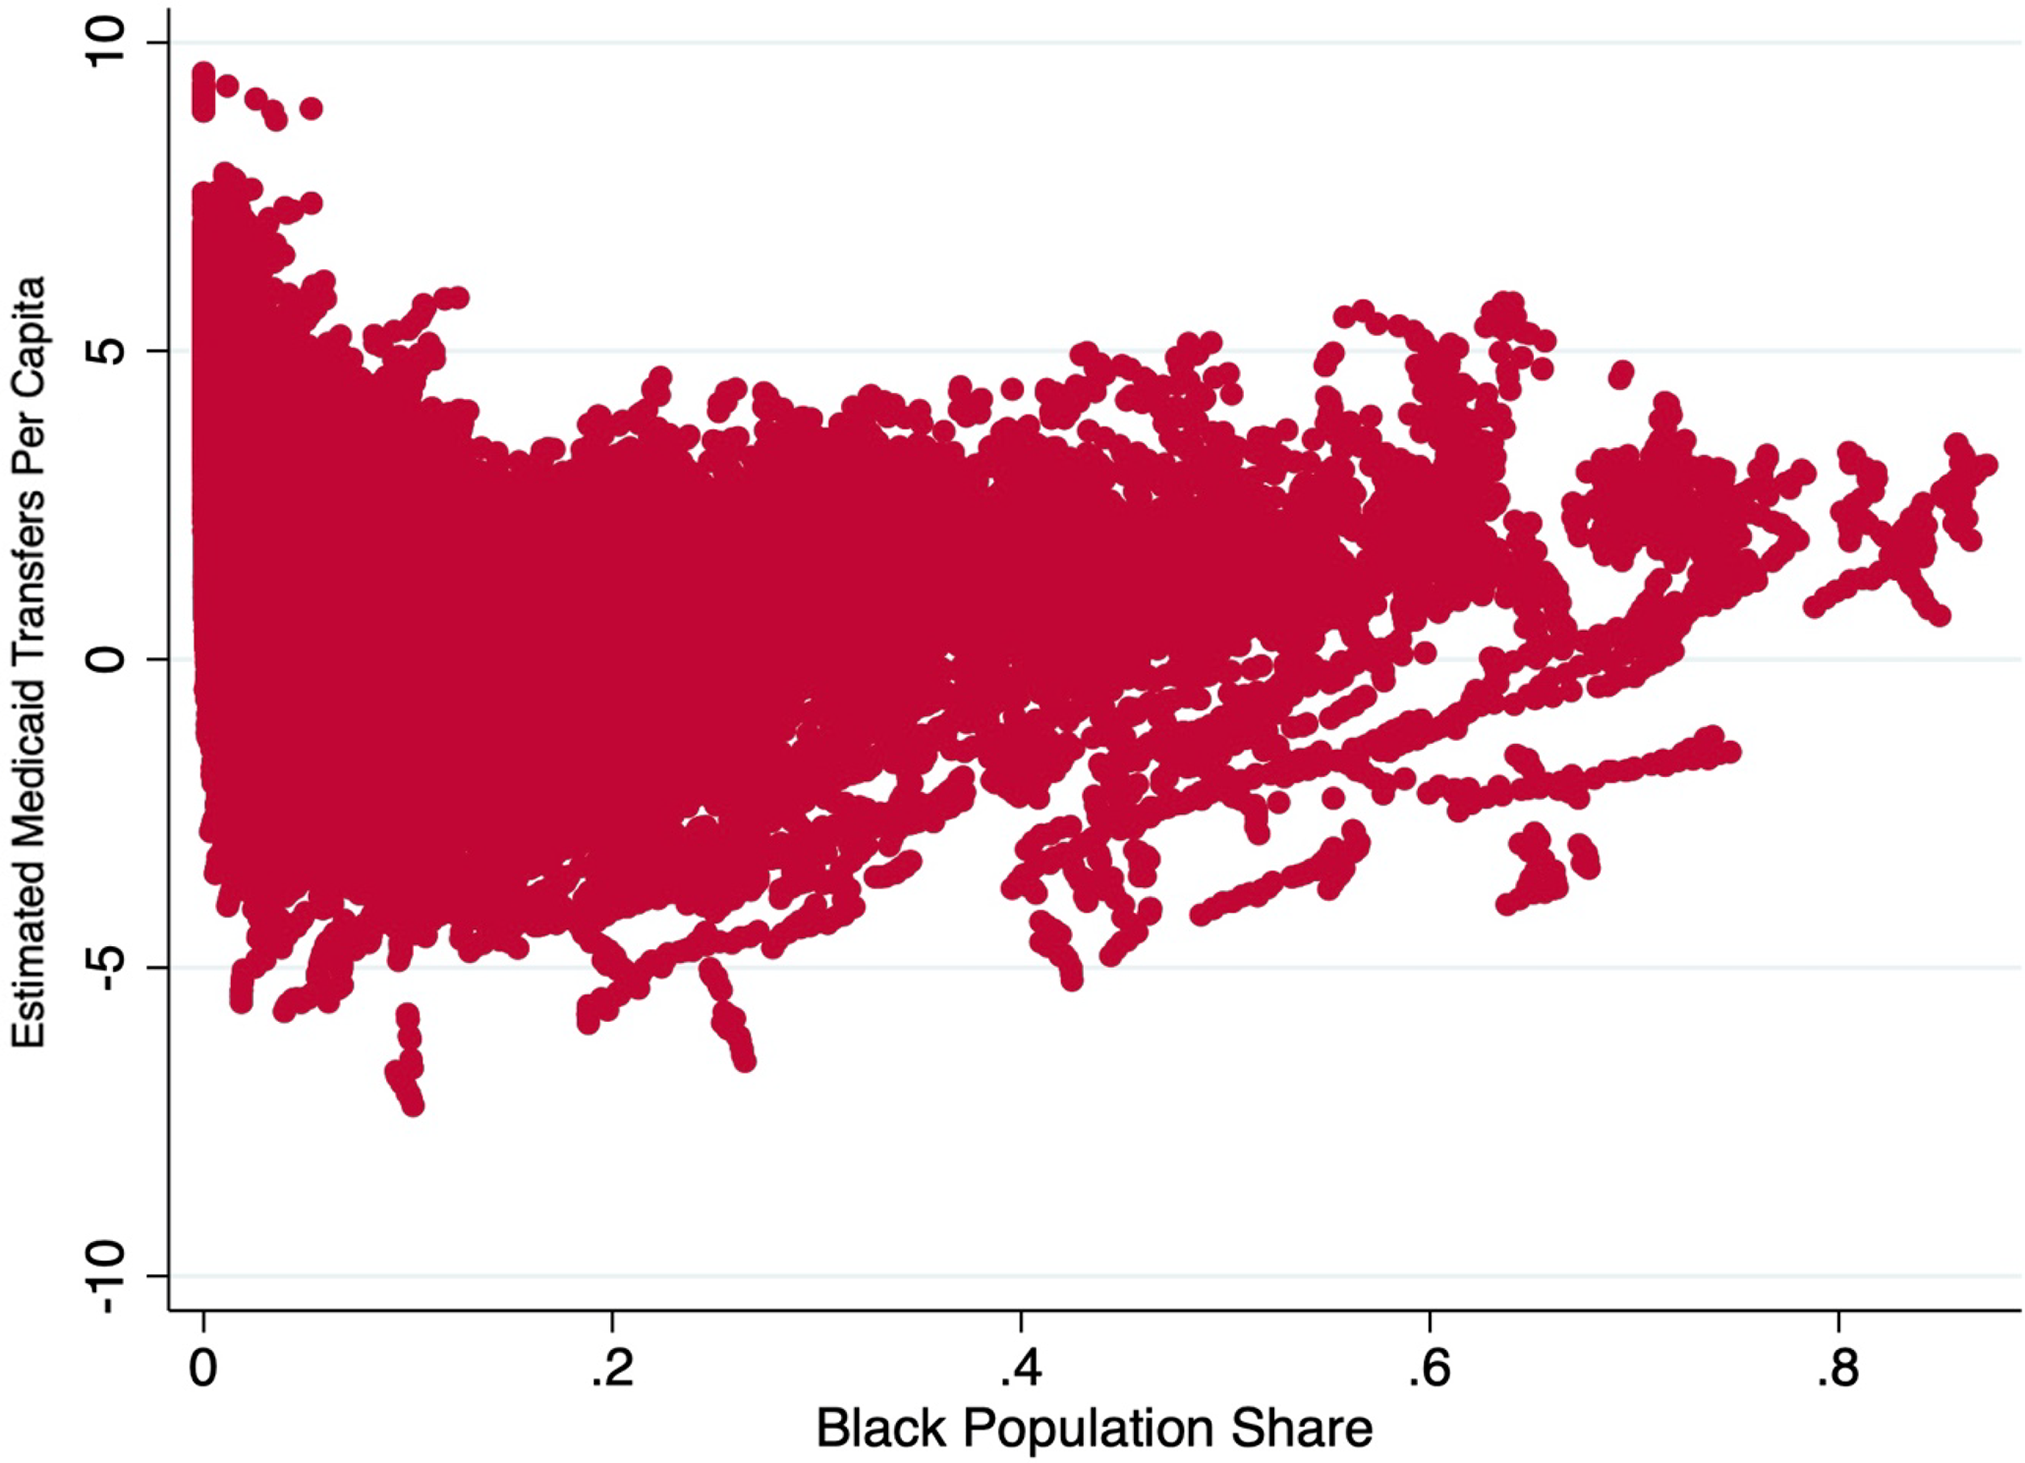
Figure 1. Predicted values of Medicaid transfers per capita from quadratic model.
Notes: The figure shows the scatterplot at the county level between proportion of African American population in a county and the estimated Medicaid transfer per capita.
Our models rely on an array of control variables, outlined in Table A1. In summary, we have findings that are consistent with Montenevo et al. (Reference Montenevo, Simon and Wing2020); the ACA expansion led to much larger increases in federal Medicaid transfers per capita in counties where the newly eligible population share was larger. We also found that the level of generosity and the economic health of states partially explain the level of transfers received by counties as the coefficients for following variables were statistically significant both by themselves and interacted with the ACA: EITC rate, EITC refundable, TANF, and unemployment rate. We also found that, as expected, states that applied for Section 1115 waivers in 2018 send less transfers. However, these states also increased their transfers once they adopted the ACA.Footnote 2
Event study
Finally, we conduct an event study analysis to address the assumption of no anticipation. The assumption of no anticipation means that, before the onset of the policy, outcomes for expansion and nonexpansion states do not depend on when the treatment occurs. In other words, the ACA expansion influences neither expansion nor nonexpansion counties before its implementation. In addition to showing pretrends or trends prior to the expansion, the event study graph enables us to check whether the magnitude of the effect changes over time after the expansion, and if so how. To investigate the possibility that differential pretrends might lead to a bias in our main difference-in-difference specifications, we fit event study models that allow the gap between the expansion and nonexpansion states to vary in the years before and after the actual policy change.
The coefficients on the policy lead and lag variables from the event study regressions are plotted in Figure 2. The coefficients on the pre-ACA expansion variables are small, but positive, and some are statistically different from zero. In contrast, the coefficients on the postexpansion terms are much larger, they are all statistically different from zero, and they grow larger with time since adoption of the ACA expansion. The pattern of coefficients in Figure 2 generally supports our difference-in-difference research design, although there is some evidence that expansion states may have been increasing Medicaid enrolment levels slightly more than nonexpansion states in the lead up to the expansion. The results also suggest that the size of the expansion effect on federal transfers grew the year after Medicaid was expanded in most states, which makes sense if people take some time to take up the new benefits. However, the effect flattens out in the following years.
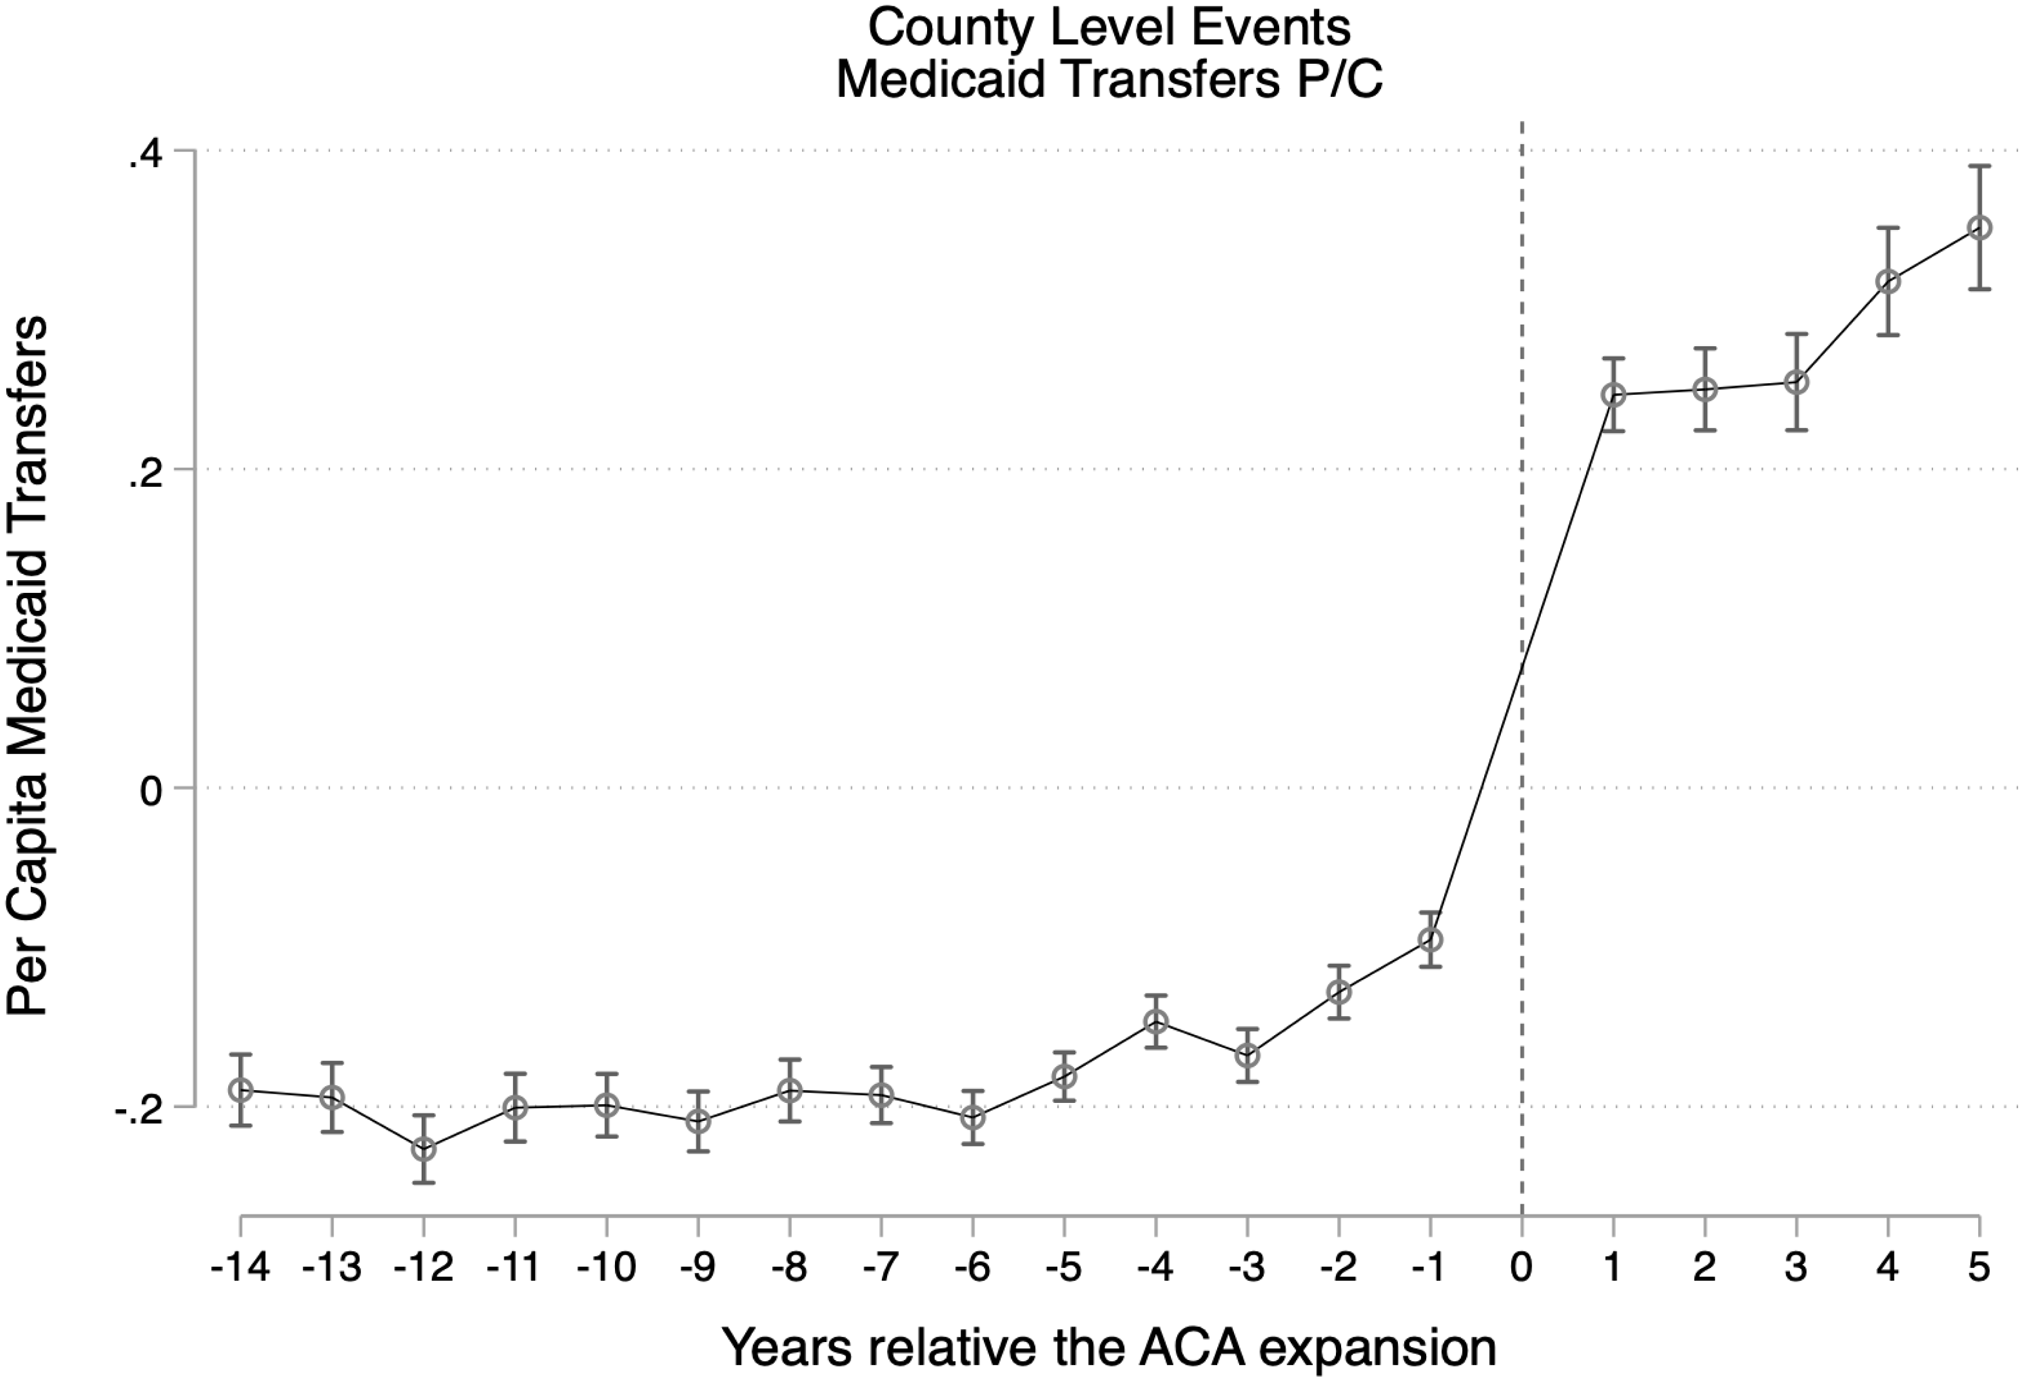
Figure 2. Event study.
Notes: Event study tests for Medicaid transfers per capita. The figure displays coefficients and 95% confidence intervals for the interaction of state Medicaid expansion and black population share with year relative to the implementation of the expansion. The year of the expansion (2014 for most states) is omitted as the reference year.
Conclusion & discussion
Researchers have uncovered that one’s zip code is more predictive of life span than one’s genetic code (Center on Society and Health 2015). Additionally, scholars of public health, sociology, and geography have built a consensus around the notion that many of the health disparities evidenced across socioeconomic status and racial groups are not fully or even well explained by individual behaviour. Rather, research reveals that racial disparities in health are the result of the structure of one’s environment and access to healthcare (Williams and Collins Reference Williams and Collins2001; Smith and Morton Reference Smith and Morton2009; Gordon et al. Reference Gordon, Purciel-Hill, Ghai, Kaufman, Graham and Wye2011; Center on Society and Health 2015). Needless to say, the US is an incredibly segregated society, whereby race, class, and space intersect to produce inequality in a wide array of policy domains. Our findings concerning the allocation of Medicaid funds shed some light on these dynamics. Not only do the analyses depict the complexities that arise across the US concerning the allocation of healthcare resources but they also speak to several prevailing theories about how “race” influences this allocation. To briefly summarise, our results indicate that the allocation of public resources is not independent from the racial demographics of American counties, but that the story is more complicated than just resource constraints increase as diversity increases. Instead, our results reveal that among communities where there are relatively few Black Americans, an increase in that particular racial group tends to see more constraints in resources. But these dynamics shift when Black populations are at a critical mass, where they, perhaps, can push politically for better resource allocation and lower administrative burden.
One reading of the results implies that when Black Americans are the minority, they are more likely to be on the short end of the politics of white racial resentment. Given the racialisation, or what Tesler (Reference Tesler2012) refers to as the “racial spillover effect,” of the ACA, white Americans who have a high sense of racial resentment tend to eschew the policy. We understand the conservative backlash to, and consequential rejection of, the ACA through the lens of racial resentment. This resentment provokes a racial project to assert and affirm white racial identity, through an organised and coordinated response, in which whites in particular localities pressure local politicians. When this pressure is effective, policies then get enacted, leading to a manifestation of “racial threat.”
But, our findings suggest that this model is neither inevitable nor ubiquitous. In places where Black Americans make up a greater portion of the population, and ostensibly the electorate, there may be a response by local policymakers to bring in more Black patients and thus make more requests for reimbursement. However, our results demonstrate that the response overall is not linear; rather, as Black Americans become a larger portion of the local population that they are able to wield more resources when they compose a critical mass, but only to a certain point. As the proportion of Black Americans continues to increase, there is not necessarily a commensurate policy response. This is important to note because patterns of Black racial segregation in the US are also highly correlated with disinvested communities, poverty, and consequently, higher rates of chronic (and often preventable) diseases and conditions. An equitable policy allocation would provide greater resources to places that are in higher need, but that is not what our results reveal.
Another key contribution of this article is that it moves beyond the state level to assess policy at the level where healthcare is implemented – at the local level. This same characteristic of the research can also be viewed as a limitation. Other works that seek to gain a better understanding of how federal resources, such as Medicaid or other social welfare policy, are allocated tend to focus on one state or a small set of states, counties, or even cities to get a better feel for on-the-ground effects of street-level bureaucrats, administrative capacity (including proportion of doctors who accept Medicaid), or include more granular measures of local political leanings (e.g. Weissert Reference Weissert1994; Keiser et al. Reference Keiser, Mueser and Choi2004; Freedman et al. Reference Freedman, Richardson and Simon2018; Allen et al. Reference Allen, Eliason, Zewde and Gross2019). These works are able to better capture fine-tuned measures of both accessibility and availability. Moreover, Medicaid expansion does not provide a perfect experiment.
An additional consideration is that there are some states where counties are forced to contribute spending. However, this spending does not necessarily remove discretion as there are many ways to discriminate in providing care. For example, schools are mandated to provide education to all, but at the local level this can be done inconsistently and unfairly. We acknowledge that discretion in service provision at the local level plays a role for the racial dynamics of the target population to come into play. Future research should explore whether forced versus discretionary participation in the financing of Medicaid by counties influences the way counties provide health services to different populations.
Nonetheless, this article’s analysis does provide a broad brush set of findings that help us pinpoint which of several competing theories of race and resource allocation most accurately explains and predicts our empirical reality by turning to a more sweeping set of measures available at the county level across the entire US over the course of nearly two decades. We leverage the variation of over 60,000 county years to determine whether local racial dynamics are predictive of resource allocation. We find that they are.
These results also inspire a new set of questions. The next steps for a research agenda in this area would be to assess whether funds translate into better health outcomes, especially for vulnerable communities. Future research should also ascertain whether racial disparities in various health outcome decline in response to increased allocation of resources at the local level.
Data availability statement
Replication materials are available in the Journal of Public Policy Dataverse at https://doi.org/10.7910/DVN/P5T53G
Acknowledgements
We thank the participants of the Journal of Public Policy’s mini-conference in Spring/Summer of 2021, with a special thanks to Pamela Herd. We also thank Tracee Saunders for her guidance.
Competing interests
None to declare.
Appendix
Table A1. Effect of ACA expansion on county-level per Capita Medicaid transfers: heterogeneity by share of black population – complete model
Notes: Standard errors in parentheses. *p < 0.10 **p < 0.05 ***p < 0.01. Standard errors are clustered at the County level. Years considered are between 2000 and 2019. All models include year-fixed effects and county-fixed effects.


 Open access