


1 Introduction
This paper deals with the idea of combining the retirement and long-term care (LTC)Footnote 1 contingencies embedded in the public pension systemFootnote 2 and using cash-for-care (CFC) benefitsFootnote 3 to help pensioners to cope with the cost of LTC if they become dependent.
Beneficiary choice and flexibility are increasingly important goals in modern LTC systems, and CFC benefits are in line with these objectives. There is a growing demand for better-tailored and more responsive care. Several OECD countries (Spain, Germany, France, the Netherlands, Italy and Sweden) have opted to provide LTC coverage in the form of CFC benefits in order to support family care and enhance autonomous choice for users. Sometimes countries provide both in-kind and in-cash benefits, leaving users to decide which they would prefer (Colombo and Mercier, Reference Colombo and Mercier2012).
However, the sustainability of financing LTC services and other assistance for the elderly is also an urgent matter in OECD countries (Swartz, Reference Swartz2013). Worrall and Chaussalet (Reference Worrall and Chaussalet2015) surveyed the recent literature modelling LTC demand. Most of the papers they consulted projected an increase in demand for LTC services (and in their associated costs) in various countries including the UK, Germany, Spain, Italy, Japan, Canada, the USA and China.
According to Costa-Font et al. (Reference Costa-Font, Courbage and Zweifel2017), LTC finance needs to be considered as part of an overall retirement strategy rather than as a simple extension of health insurance. For most retirement planners, financial advisors and pension benefit actuaries, retirement and LTC planning often go hand-in-hand (Yakoboski Reference Yakoboski2002; Kenny et al., Reference Kenny, Barnfield, Daly, Dunn, Passey, Rickayzen and Teow2017). This is a logical extension of the underlying rationale for all pension arrangements: to provide an adequate income to meet needs in retirement regardless of a person's state of health. Moreover, in the life-cycle planning of a household, there is a natural focal point for LTC needs (Rickayzen, Reference Rickayzen2007). This is when people are approaching or have just entered retirement and, given finite resources, are seriously considering how to arrange their financial future for possibly the last time.
The idea of combining retirement and LTC contingencies is not new. The link between old-age income and LTC policy has long been acknowledged in the literature. Christopherson (Reference Christopherson1992) launched the idea of an annuity that, increasing with a disability, could serve as a new design for Social Security benefits.
Scanlon (Reference Scanlon1992) suggested a programme that would provide a cash payment or an indemnity benefit to pensioners with specified levels of disability. Payments would not be expected to finance all the care needed, but would be supplemented by family resources (financial and in kind) and private insurance. He pointed out that his proposal is comparable in many ways to the existing major public social insurance programme in the USA: Social Security.
With reference to the UK, Nuttall et al. (Reference Nuttall, Blackwood, Bussell, Cliff, Cornall, Cowley, Gatenby and Webber1994) proposed that pensioners, on retirement, should be allowed to defer a certain fraction of their pension (to be held in a tax-exempt fund until either used or inherited) in return for the right to an increase in benefit in the event that they or their spouse should require LTC.
Chen (Reference Chen1994, Reference Chen2001, Reference Chen2003) suggested the creation of a ‘social security long-term care’ to provide basic LTC coverage by diverting a small portion of a retiree's social security cash benefits to LTC. Specifically, this would rely on a three-legged stool for financing LTC that would begin with the creation of a compulsory social insurance programme for a basic amount of LTC coverage, which would then be supplemented on a voluntary basis by private LTC insurance coverage and personal savings.
The idea of combining retirement and LTC annuities is a way of improving the diffusion of LTC insurance coverage. Pitacco (Reference Pitacco2002) proposed the establishment of an LTC insurance scheme embedded in the retirement pension system, i.e., the introduction of enhanced pension annuities (EPAs)Footnote 4 funded by contributions. This proposal took inspiration from the field of private insurance. Other researchers such as Getzen (Reference Getzen1998), Murtaugh et al. (Reference Murtaugh, Spillman and Warshawsky2001) and Spillman et al. (Reference Spillman, Murtaugh and Warshawsky2003) argued that pooling the longevity risk (associated with the life annuity) with the morbidity risk (associated with the LTC insurance component) should result in a lower overall risk since they work in opposite directions.
More recently, Tanaka (Reference Tanaka2016) made a proposal for redesigning the Social Security LTC pension in Japan by introducing a pension benefit increase mechanism that would depend on the level of care needed by beneficiaries.
Finally, the idea of embedding a public LTC insurance scheme in a notional defined contribution (NDC)Footnote 5 framework has been examined by Pla-Porcel et al. (Reference Pla-Porcel, Ventura-Marco and Vidal-Meliá2016), who looked into introducing life care annuities (LCAs). The same authors have also assessed the cost of converting retirement benefit into an LCA with graded benefits using a pre-existing public pay-as-you-go (PAYG) pension scheme (Pla-Porcel et al., Reference Pla-Porcel, Ventura-Marco and Vidal-Meliá2017).
In this paper, we analyse whether it would be possible and desirable to use an NDC scheme to provide retirement and graded LTC benefits so as to help pensioners cope with the cost of LTC. Our proposal aims to provide partial coverage of the LTC costs incurred by retirement pensioners. The provision of LTC would be viewed as one of the pillars of multi-pillar public schemes. This is in line with the ideas of Colombo and Mercier (Reference Colombo and Mercier2012), who believe the right balance needs to be found between fair protection and financial sustainability in the long term, but without shifting too large a financial burden onto future generations. We are aware that the solution to LTC finance needs to be found by having an integrated vision of the roles of the market, State and family (Cremer et al., Reference Cremer, Pestieau and Ponthière2012).
Our starting point is the paper by Pla-Porcel et al. (Reference Pla-Porcel, Ventura-Marco and Vidal-Meliá2016). We extend their model/proposal by adding two new features: an LTC benefit graded according to the annuitant's degree of disability (Pla-Porcel et al., Reference Pla-Porcel, Ventura-Marco and Vidal-Meliá2017) and a minimum pension for both contingencies. Introducing these features makes the modelling framework more realistic, enhances the political attractiveness of the proposal and discloses the crucial role played by biometric assumptions should it be decided to put the model into practice.
We are convinced that our paper is timely because, according to Holzmann (Reference Holzmann2017), one of the best-known designers of NDC pension schemes, there are important issues that need further research, for instance, the link between the NDC framework and LTC benefits.
The structure of the paper is as follows. After this introduction, Section 2 presents the model. In Section 3 we briefly discuss the policy implications of a number of issues that should be taken into account before putting the model into practice. Section 4 provides a complex numerical illustration representative of the model presented in Section 2, so that policymakers can see more clearly how the proposed model would function. The paper ends with the concluding comments, future research and an appendix, which provides a technical description of the system and explains how the initial benefits are computed.
2 The model
In this section, we extend the model devised by Pla-Porcel et al. (Reference Pla-Porcel, Ventura-Marco and Vidal-Meliá2016) by adding two new features: a minimum pension for both contingencies and an LTC benefit graded according to the annuitant's degree of dependenceFootnote 6. LTC delivers an amount directly linked to the severity of the disability itself, often assessed according to an ADL and/or IADL scale.
To a large extent, the model includes realistic demography because it takes into account an age and health status schedule of mortality, the uncertainty that surrounds the timing of becoming dependent (LTC incidence rates by age) and yearly deterioration probabilities by age (probabilities of moving to a worse state of dependence). It also allows for changes in population and for a large number of generations of contributors and pensioners (healthy and dependent persons classified by their degree of LTC needs) to coexist at each moment in time.
The rationale behind introducing these two new features into the model is twofold.
First, the aim of introducing a minimum pension into NDC schemes is to reconcile the financial sustainability of the system with the adequacy of the benefits provided. NDC schemes provide benefit for all contributors reaching the minimum retirement age, but there is no guarantee of sufficient income to maintain a minimum standard of living. It has long been recognized (Williamson and Howling, Reference Williamson and Howling2003; Holzmann and Palmer, Reference Holzmann and Palmer2006; Barr and Diamond, Reference Barr and Diamond2009; Chłoń-Domińczak and Strzelecki, Reference Chłoń-Domińczak and Strzelecki2013) that this type of pension scheme should be supplemented with a minimum pension.
Second, publicly-run LTC schemes recognize at least three degrees of dependence. People are categorized into several levels of dependence according to their inability to perform a given number of ADLs and IADLs. This classification has a direct effect on the amount of benefit paid. However, established degrees of dependence and their legal definition differ notably from country to country. This can be illustrated by looking at the examples of Germany (Rothgang, Reference Rothgang2010), Australia (Hariyanto et al., Reference Hariyanto, Dickson and Pitt2014a, Reference Hariyanto, Dickson and Pittb), France (Biessy, Reference Biessy2017), Austria (Fleischmann, Reference Fleischmann2015) and Spain (Bolancé et al., Reference Bolancé, Alemany and Guillén2013).
2.1 Description of the model's main features and assumptions
Affiliates contribute to both retirement and LTC contingencies. The LTC need is linked to retirement ages. There is a defined contribution rate (fixed over time), θ a, to cover both contingencies. It is assumed that contributions and benefits are payable yearly in advance. There are n levels of dependence, with level 1 being the least severe and level n the most. The health dynamics of the annuitant rely on the irreversible illness-death model in which transitions are modelled from the initial healthy state to the absorbing death state.
In our model, becoming an LTC recipient means that the amount of retirement pension is automatically increased by a certain percentage, ξ, to help pay for care services, i.e., those dependent on care obtain additional cash to hire the required services as they see fit. With n graded benefits,  $\; \xi _r \in \; {\rm {\open R}}_ + ^n $, there are n initial increasing percentages: 0 <ξ r1 <ξ r2 < · · · <ξ rn.
The model uses LCAs and EPAs.
With LCAs, the LTC benefit (in the form of a CFC benefit) is defined in terms of an uplift with respect to the basic pension, b, which is paid out from retirement onwards and replaced by the LTC annuity benefit, b · (1 + ξ rj), j ∈ {1, 2, …, n}, in the case of a particular level of LTC claim. The uplifts can be financed over the whole accumulation period by contributions higher than those needed to purchase the basic pension, b.
The EPA is an LCA in which the uplifts are financed by a reduction – with respect to basic pension b – of the benefit paid while the pensioner is healthy. Thus, the reduced benefit, b h, is paid out as long as the retiree is healthy, while the uplifted benefit, b · (1 + ξ rj), will be paid in the case of an LTC claim. Logically, b h <b <b · (1 + ξ rj).
In short, in response to an increase in pensioner care needs, the system uses a CFC benefit to help pensioners cope with the cost of LTC.
The system provides a minimum pension depending on individual health status, with the amount being related to the average wage. The structure of the minimum pension is similar to that of Pérez-Salamero et al. (Reference Pérez-Salamero González, Ventura-Marco and Vidal-Meliá2017)Footnote 7.
The age giving entitlement to retirement pension, x e + A, is fixed. We also assume that participants’ lives last ω − x e periods, where ω is the maximum lifespan and x e is the earliest age of entry into the system.
As regards the supplementary amount for dependence, it is assumed that the ages for eligibility to receive benefits are to be found in age interval [x e + A + 1, ω].
The contribution base grows at an annual rate of g and the economically active population increases or decreases over time at an annual rate of γ, affecting all groups of contributors equally. Thus, the system's income from contributions (covered wage bill) also grows (decreases) at the rate G = (1 + g) · (1 + γ) − 1.
The model includes the so-called ‘survivor dividend’ (Vidal-Meliá et al., Reference Vidal-Meliá, Boado-Penas and Navarro-Cabo2016), i.e., the account balances of participants who do not survive to retirement are distributed as inheritance capital to the accounts of the surviving participants on a birth cohort basis.
The initial amount of the annuity depends on several elements (Appendix 1), the most important being the pension balance accumulated at retirement age. However, there are others that also matter: the expected mortality of the cohort in the year the contributor reaches retirement, the LTC incidence rates by age, the probabilities of moving to any worse state of dependence, the amount of the uplifted benefits, the expected mortality of dependent persons, and a notional imputed future indexation rate, α.
When the system reaches the mature state t = ω − x e − A years from inception, A generations of contributors and ω − (x e + A) generations of pensioners coexist at each moment in time. The main implications of this can be seen in Appendix 1.
2.2 The cost of introducing the LTC contingency into the system and its effect on the initial retirement pension
For a pure NDC system, the impact of the introduction of the LTC contingency on the initial retirement pension is assessed by comparing the initial benefits in both cases: the traditional NDC scheme and our proposed NDC scheme. The cost of introducing the LTC contingency depends on the annuity chosen, which involves a reduction in the initial pension benefit (EPA) or an increase in the contribution rate in comparison with the traditional NDC scheme (LCA).
Given that the total pension balances at time t for the cohort of retired persons aged x e + A is the same under both schemes, the difference is given by the graded LTC coverage. More specifically, the difference in the initial benefit arises due to the annuity factors used to compute the benefits. $AF_{\left( {x_e + A} \right)}^{} = \ddot a_{x_e + A}^\alpha \; $ is the annuity factor of the traditional NDC scheme and $AF_{\left( {x_e + A} \right)}^{LTC(n)} = \ddot a_{x_e + A}^{r\alpha} + \sum\nolimits_{j = 1}^n {^{\xi _{rj}} A_{x_e + A}^{rd_j\alpha}} $ is the annuity factor with LTC coverage, and since ξ rj >0 for all j {1, 2, …, n}, it is easy to see that $AF_{\left( {x_e + A} \right)}^{} \lt AF_{\left( {x_e + A} \right)}^{LTC(n)} $.
The so-called ‘coverage ratio’, CR t, is the link between both types of factor:
 $$CR_t = \displaystyle{{AF_{\left( {x_e + A} \right)}^{LTC(n)}} \over {AF_{\left( {x_e + A} \right)}^{}}} = 1 + \mathop \sum \limits_{\,j = 1}^n \xi _{rj}\cdot \displaystyle{{A_{x_e + A}^{rd_j\alpha}} \over {\ddot a_{x_e + A}^\alpha}} = 1 + \mathop \sum \limits_{\,j = 1}^n \xi _{rj}\cdot jLTCW_t$$
 Under the assumption made for formula (5) (Appendix 1), it can be demonstrated that  $\ddot a_{x_e + A}^\alpha = \ddot a_{x_e + A}^{r\alpha} + \sum\nolimits_{j = 1}^n {A_{x_e + A}^{rd_j\alpha}} $, and thus the LTC ratio, $jLTCW_t = (A_{x_e + A}^{rd_j\alpha} /\ddot a_{x_e + A}^\alpha ),\; \,\,j \in \left\{ {1, \ldots, n} \right\}$, expresses the actuarial cost that the j ∈ {1, …, n}-level LTC contingency represents as a proportion of total costs (retirement and dependence), i.e., the higher the resulting value of the jLTCW t, j ∈ {1, …, n}, the lower the amount of the initial pension in the integrated scheme.
The coverage ratio indicates in present value the number of equivalent monetary units needed to determine the initial pension under the integrated scheme (retirement with graded LTC) for each monetary unit of the initial pension under the basic scheme (retirement only).
If the equivalence is maintained, the integrated NDC scheme remains financially balanced given that the initial pension is reduced in accordance with the coverage ratio. In our proposed scheme, the initial pension is reduced in accordance with the inverse of the coverage ratio:
 $$\overbrace{{\bar P_{\left( {x_e + A,t} \right)}^{NDCR}}} ^{{\scriptstyle \,\,\,\,\,Classical \hfill \atop \scriptstyle NDC\,scheme \hfill}} \cdot \displaystyle{1 \over {CR_t}} = \bar P_{\left( {x_e + A,t} \right)}^{NDC}. $$
Formula (2) uses an EPA to cover LTC needs, given that the uplifts are financed by a reduction in the benefit paid by the traditional NDC scheme while the pensioner is healthy.
The new contribution rate,  $\theta _a^{\rm *} $, which should be enough to maintain the initial retirement pension paid by the traditional NDC scheme, is easy to obtain as a function of CR t:
 $$\theta _a^{^\ast} = \theta _a\cdot \overbrace{{\left[ {\displaystyle{{AF_{(x_e + A)}^{{\rm LTC}(n)}} \over {AF_{(x_e + A)}}}} \right]}}^{{CR_t}} = \theta _a\cdot \left( {1 + \mathop \sum \limits_{\,j = 1}^n \xi _{rj}\cdot jLTCW_t} \right).$$
It is straightforward to see that formula (3) uses an LCA to cover LTC needs, given that the uplifts are financed during the whole accumulation period by contributions higher than those needed under the traditional NDC scheme.
As far as the redistributive part is concerned, two alternatives can be implemented to maintain the system's financial equilibrium. Both are based on the principle of separating the distributional aspects from strict NDC schemes, which means that non-contributory funds should be earmarked for the purpose, otherwise there is a risk of draining other funds or causing serious imbalances in the pension system (Barr, Reference Barr, Holzmann and Palmer2006; Holzmann, Reference Holzmann2017). The first alternative relies on recording supplementary pension payments in the same accounting period or fiscal year in which the minimum pensions are granted. In other words, financial cover needs to be provided annually in the form of an amount equal to the present value of the amount paid out for new pensioners who need to have the capital accumulated in their individual accounts topped up because the balance is less than the minimum required to finance the LCA or EPA at retirement age. To maintain financial stability in the scheme, it is essential to finance these as and when they are awarded. They will have to be funded from other exogenous sources and not by NDC contributions. The second alternative is based on registering a claim on the public budget for yearly payments to cover the system's shortfall caused by minimum pensions. In this case, the amount to be covered annually would be the difference between the income from contributions and the expenses on pensions, which includes non-contributory rights. The two options are not equivalent because, as Palmer (Reference Palmer, Holzmann and Palmer2006) pointed out, the second creates a different distributional profile with political risk because future governments may not consider these rights.
3 Some policy implications as regards putting the model into practice
The way LTC is dealt with in our proposal has several advantages. It makes it easier to integrate both retirement and dependence into an NDC framework and raises awareness about LTC needs. On paper at least, it offers an innovative public social insurance programme to help pensioners to cope with future LTC costs in a way that is financially sound and sustainable over time. It is financed almost exclusively by contributions, which are income-related but not risk-related, and does not raise the contribution rate for workers (EPA option), thus removing concerns about generational equity. The redistributive part, i.e., the cost of pensions originating from non-contributory rights, would be financed through general taxation. It extends LTC coverage with a ‘fixed’ cost and discourages politicians from making promises about future retirement and LTC benefits without the necessary funding support. It very transparently introduces redistribution from contributors with long careers to those with short contribution records (for both retirement and LTC contingencies). And last but not least, given that LTC coverage is granted at retirement age, the proposal has the further advantage of allowing the sponsor (the state) to easily take into account trends in disability, longevity and other sources of risk in ‘pricing’ benefits.
Our proposal is in line with the basic idea supporting ‘traditional’ NDC pensions, i.e., the division of the state PAYG scheme into two components: a quasi-actuarial element (the NDC pension) operating on a PAYG basis but mimicking a funded defined contribution (FDC) scheme, and a redistributive element financed from general taxation (Barr, Reference Barr, Holzmann and Palmer2006).
The model could, therefore, be considered a benchmark for further research since it develops the necessary technicalities to fully integrate old-age pension and graded LTC benefit into a generic NDC framework. However, its direct application in practice is not immediate but would depend on a number of adaptations being carried out. This is by no means a minor topic and the experiences of countries that have implemented NDC schemes may be a valuable example to follow. At the very least the following issues, listed in no particular order, would need to be thoroughly addressed:
• Possible integration with other pillars of the pension system.
In all countries with an NDC system in force, the NDC pillar is an important source of future retirement income but not the only one. In Latvia, Poland and Sweden, the mandatory NDC component is complemented by a mandatory financial defined-contribution component. Our proposal should be seen as one of the pillars for financing LTC and retirement in multi-pillar schemes. This pillar would give affiliates entitlement to a pre-defined level of support (in cash) depending on their need for help in paying for care services. The scheme would then be supplemented on a voluntary or compulsory basis by private LTC insurance and personal savings (Chen, Reference Chen1994, Reference Chen2001, Reference Chen2003). The LTC funding model, as Costa-Font (Reference Costa-Font2010) has pointed out, would need to be designed in line with the social values prevalent in each country, an area that goes beyond the scope of this paper.
• Transition rules from the old system to the NDC framework.
Good transition rules are a key element when phasing in NDCs. So far, each country has created different ones. According to Holzmann (Reference Holzmann2017), the process would basically consist of keeping retirement (and, in our case, LTC) benefits in payment untouched, translating the acquired individual rights of current contributors into initial individual capital for the NDC accounts, and then starting the new common scheme with this initial capital, to which future contributions are added. Any number of problems could arise if the pension rights acquired under the old systems are not well assessed. The speed of transition is also a vital issue. In Latvia, Poland and Sweden (Chłoń-Domińczak et al., Reference Chłoń-Domińczak, Franco, Palmer, Holzmann, Palmer and Robalino2012) the transition was relatively fast, with Latvia being the fastest, followed by Sweden. In Italy it was slow.
• The minimum pension benefit level.
This issue is relevant to the efficient design of the scheme. Minimum pensions (Pérez-Salamero et al., Reference Pérez-Salamero González, Ventura-Marco and Vidal-Meliá2017) are useful for reducing poverty in old age, but they can also cause significant negative biases in the incentive to work (and contribute to the system) as individuals age. When a minimum pension is available at an early retirement age, the effects on the incentive to work can be substantial. By encouraging early retirement, such programmes reduce the labour supply of workers approaching retirement age. The size of the effect depends on both the conditions for eligibility and the size of the minimum pension compared to the average wage. However, when a minimum pension is not available until after normal retirement age, it tends to have a little incentive effect on retirement decisions. On the same subject, Palmer (Reference Palmer, Holzmann and Palmer2006) wrote that minimum pensions favour retirement at the minimum legal age or as early as possible for most workers with low incomes.
• Updating the actuarial factors.
In our proposed NDC model, this periodic process becomes even more important than in traditional NDC schemes. The annuity divisors applied to convert the notional capital into an LCA have to be updated yearly because the expected longevity of healthy and dependent persons and the transition probabilities between health states change over time and the rate of return applied to discount pension wealth is not known in advance (Pla-Porcel et al., Reference Pla-Porcel, Ventura-Marco and Vidal-Meliá2017). As regards traditional NDC schemes, the divisors are based on backward-looking assumptions in Italy, Poland and Sweden, and on forward-looking assumptions in Latvia. Obtaining timely, accurate estimations of mortality, transition and incidence rates is highly complex, as the papers by Robinson (Reference Robinson1996), Hariyanto et al. (Reference Hariyanto, Dickson and Pitt2014a, Reference Hariyanto, Dickson and Pittb) and Fong et al. (Reference Fong, Shao and Sherris2015), for example, have demonstrated. In developed countries, government authorities should make an effort to construct nationally representative estimates of functional status transition rates. Furthermore, the importance of making accurate disability determinations could become critical in offsetting the likely great risk of moral hazard associated with receiving a cash payment instead of having to use a service (Scanlon, Reference Scanlon1992).
• Levels of dependence and defining the scale for triggering benefits.
As strongly recommended in the paper by Pla-Porcel et al. (Reference Pla-Porcel, Ventura-Marco and Vidal-Meliá2017), a rigorous countrywide study of dependence levels should be carried out. The mortality and morbidity data available must be good enough to enable an accurate computation of actuarial factors in accordance with the design structure of the uplifts. In practice, the scale chosen to make the assessment is extremely important.
• The design structure of the uplifts.
This point is closely linked to the previous one. Generally speaking, if the EPA approach were implemented, a generous uplift would mean a big reduction in the initial retirement benefit. A crucial step prior to establishing the structure of uplifts for a given country would be to calculate the average yearly cost of care according to the level of severity and the type of care provided. The papers by Karlsson et al. (Reference Karlsson, Mayhew, Plumb and Rickayzen2006), Rothgang (Reference Rothgang2010), Bolancé et al. (Reference Bolancé, Alemany and Guillén2013) and Del Pozo-Rubio and Escribano-Sotos (Reference Del Pozo-Rubio and Escribano-Sotos2013) provide useful information on countries including the UK, Germany and Spain. It is also very important to take into account the cost-sharing or copayment requirements for a given country. Very briefly, cost-sharing refers to the financial contribution that beneficiaries are required to make when they use LTC services. These payments are not reimbursed by their social insurance plan. In most European countries, cost-sharing requirements are income-based and can be substantial, particularly because ‘hotel’ or ‘room and board’ expenses connected to nursing home care are typically not considered part of LTC services (Swartz, Reference Swartz2013).
Once this individual cost of LTC is estimated and the copayment requirements carefully analysed, the structure of uplifts can be properly designed.
• Communication with the public.
The principles of any reform have to be conveyed to the population, and pension information plays a crucial role, especially within an NDC framework. The success of a reform in achieving its goals will depend on how this is done. The work on Sweden suggests that it is not an easy task to reach participants with messages about NDC (Sundén, Reference Sundén, Holzmann, Palmer and Robalino2012).
A detailed explanation of benefits would need to be given to participants when combining retirement and LTC by means of LCAs or EPAs. Pension information should increase the contributors’ knowledge of the contributions they make, the benefits they can expect and the degree of coverage they have for the various contingencies covered by the scheme (retirement and graded LTC). It would, therefore, be essential to send out a yearly account statement containing individual pension information on retirement and LTC coverage to all participants (Regúlez-Castillo and Vidal-Meliá, Reference Regúlez-Castillo and Vidal-Meliá2012).
• The actuarial balance sheet (ABS) and the automatic balance mechanism (ABM).
Taking as a starting point the current NDC scheme operating in Sweden (TSPS, Reference Settergren and Birkholz2016), the ABS and the ABM should be redesigned to include LTC coverage. The so-called ‘Swedish’ ABS is specifically designed for NDC schemes and the natural way to correct solvency problems in the NDC framework is by means of the automatic balance mechanism. In the Swedish case, any correction is based on the solvency indicator that emerges from the ABS. The ABM is ultimately a safeguard setting that should be expected to be marginal when the system is well designed and its parameters well calibrated. Over-large adjustments would suggest that the scheme has a structural problem.
In short, it would be no exaggeration to say that the policy implications of putting the model into practice would call for a new paper.
4 Numerical illustration
This section shows the results obtained for a numerical example representative of the model developed in the previous sections. We present this to make it easier for policymakers to understand how the proposed model would function. However, it should be viewed simply as an illustration because it uses data and characteristics from various countries and a standardized population by age, and the proposed scheme is not yet in operation in any country.
The section is divided into two different parts: the model without the minimum pension and the model with the minimum pension.
4.1 The proposed scheme without a minimum pension benefit
It is assumed that individuals can join the labour market from age 16 onwards, that the credited contribution rate is constant and equal to 16% (the contribution rate for the NDC scheme in Sweden), and that the fixed retirement age for all individuals is 65, i.e., the highest age that individuals can join the labour market is 64.
A concave income profile typical of developed countries is assumed. We also assume that the contribution bases (g) grow at an annual accumulative rate of 1.6% and that the economically active population of all ages (γ) grows at an annual rate of 1%.
It is also assumed that the initial pension benefit remains constant over time in real terms, i.e., α = 0, using price indexation of benefits.
As far as the LTC contingency is concerned, the data used to perform this numerical example are obtained from Robinson's (Reference Robinson1996) care transition model (CTM), which provides seven health states that differ according to three variables: (a) the number of ‘IADLs’ impaired, (b) the number of ‘ADLs’ impaired, and (c) whether there is a ‘cognitive impairment’.
In line with the predefined states of dependence, Table 1 shows the uplifts (ξ ij) to be applied according to the transitions between the various states that are taken into account in the numerical example.
Table 1. Uplifts (ξ ij) to be applied when the pensioner moves to a worse health state

Source: Own.
The rows and columns of the matrix embedded in Table 1 relate to the starting and ending health status respectively of each pensioner in the cohort. For example, when a healthy person becomes dependent at level 4 (r, d 4), the amount of the retirement pension doubles, given that ξ r4 = 1. The amount of the benefit also doubles when a level 1 dependent makes a transition to level 6 (d 1, d 6).
For the baseline case, R, Figure 1 shows the morbidity and mortality rates broken down into six graphs.
1. Yearly probability of dying. This is increasing with age for all the health states considered. What really draws the attention is the low probability of dying for pensioners in state d 5 (those unable to perform one ADL and with cognitive impairment). We are unable to give a coherent explanation of this ‘anomaly’, but Biessy (Reference Biessy2017), based on the French experience, finds two types of mortality in disabled people: the first due to severe illness causing entry into dependence with a very short life expectancy, and the second caused by capacities being eroded by age and conditions like dementia, with a much longer mean duration.
2. Mortality ratio: dependent/healthy population. This shows that dependent persons have a higher (much higher) yearly probability of dying than healthy people, but the difference tends to decrease notably as the pensioners get older. The extra-mortality for dependent persons is very noticeable, and the ‘anomaly’ with regard to the group of dependent persons labelled d 5 is clear to see.
3. The LTC incidence rates for healthy pensioners. These increase with age. By far the highest incidence rate is the probability of becoming dependent at level 1 (the least severe degree). The lowest is the probability of becoming dependent at level 3 (inability to perform two ADLs and no cognitive impairment).
4/5. Graphs 4 and 5 respectively show the transition probabilities of moving to any worse health state for dependent pensioners in states 1 and 3. Both graphs show that the highest probability of transition is to the next immediate state, i.e., from (d 1) to (d 2) in graph 4 and from (d 2) to (d 3) in graph 5.
6. The specific LTC prevalence rates by age in the mature state that result from combining the mortality and incidence rates are shown in graph 6. As expected, because the possibility of recovery was ruled out, the rates for the most severe dependence states (d 5) and (d 6) are particularly high for the very elderly. The highest average prevalence rate $(\bar \lambda _x^{d_1} )$ (see Table 2 later in the text) is for the least severe state of dependence, 11.61%, whereas the lowest rate is for dependents in state 3 ($\bar \lambda _x^{d_3} $), barely reaching 0.89%. The total average LTC prevalence rate $(\bar \lambda _x^{d_j} )$ is 26.30% for this baseline case.


Figure 1. (Colour online) Morbidity (incidence and prevalence) and mortality rates. Source: Own.
Table 2. NDC system with retirement and graded LTC annuities (NDC LTCG): some selected values (Basic set of assumptions)

Source: Own.
Figure 2 shows the evolution of the retired population and their life expectancy by age for some of the health states. This complements Figure 1 and contains six graphs. The evolution of the retired population – healthy persons, dependent persons and combined total – can be found in graph 1. The proportion of dependent persons by age reaches a peak of nearly 21% of the initial group of pensioners for the group aged 80. Graph 2 represents the evolution of the dependent persons categorized by health state as a percentage of the initial group of pensioners. This graph is directly linked to the graph representing LTC prevalence rates in Figure 2. It can be seen that the biggest groups of dependent persons – states 1, 5 and 6 – reach their peaks at ages 77, 81 and 84, respectively.
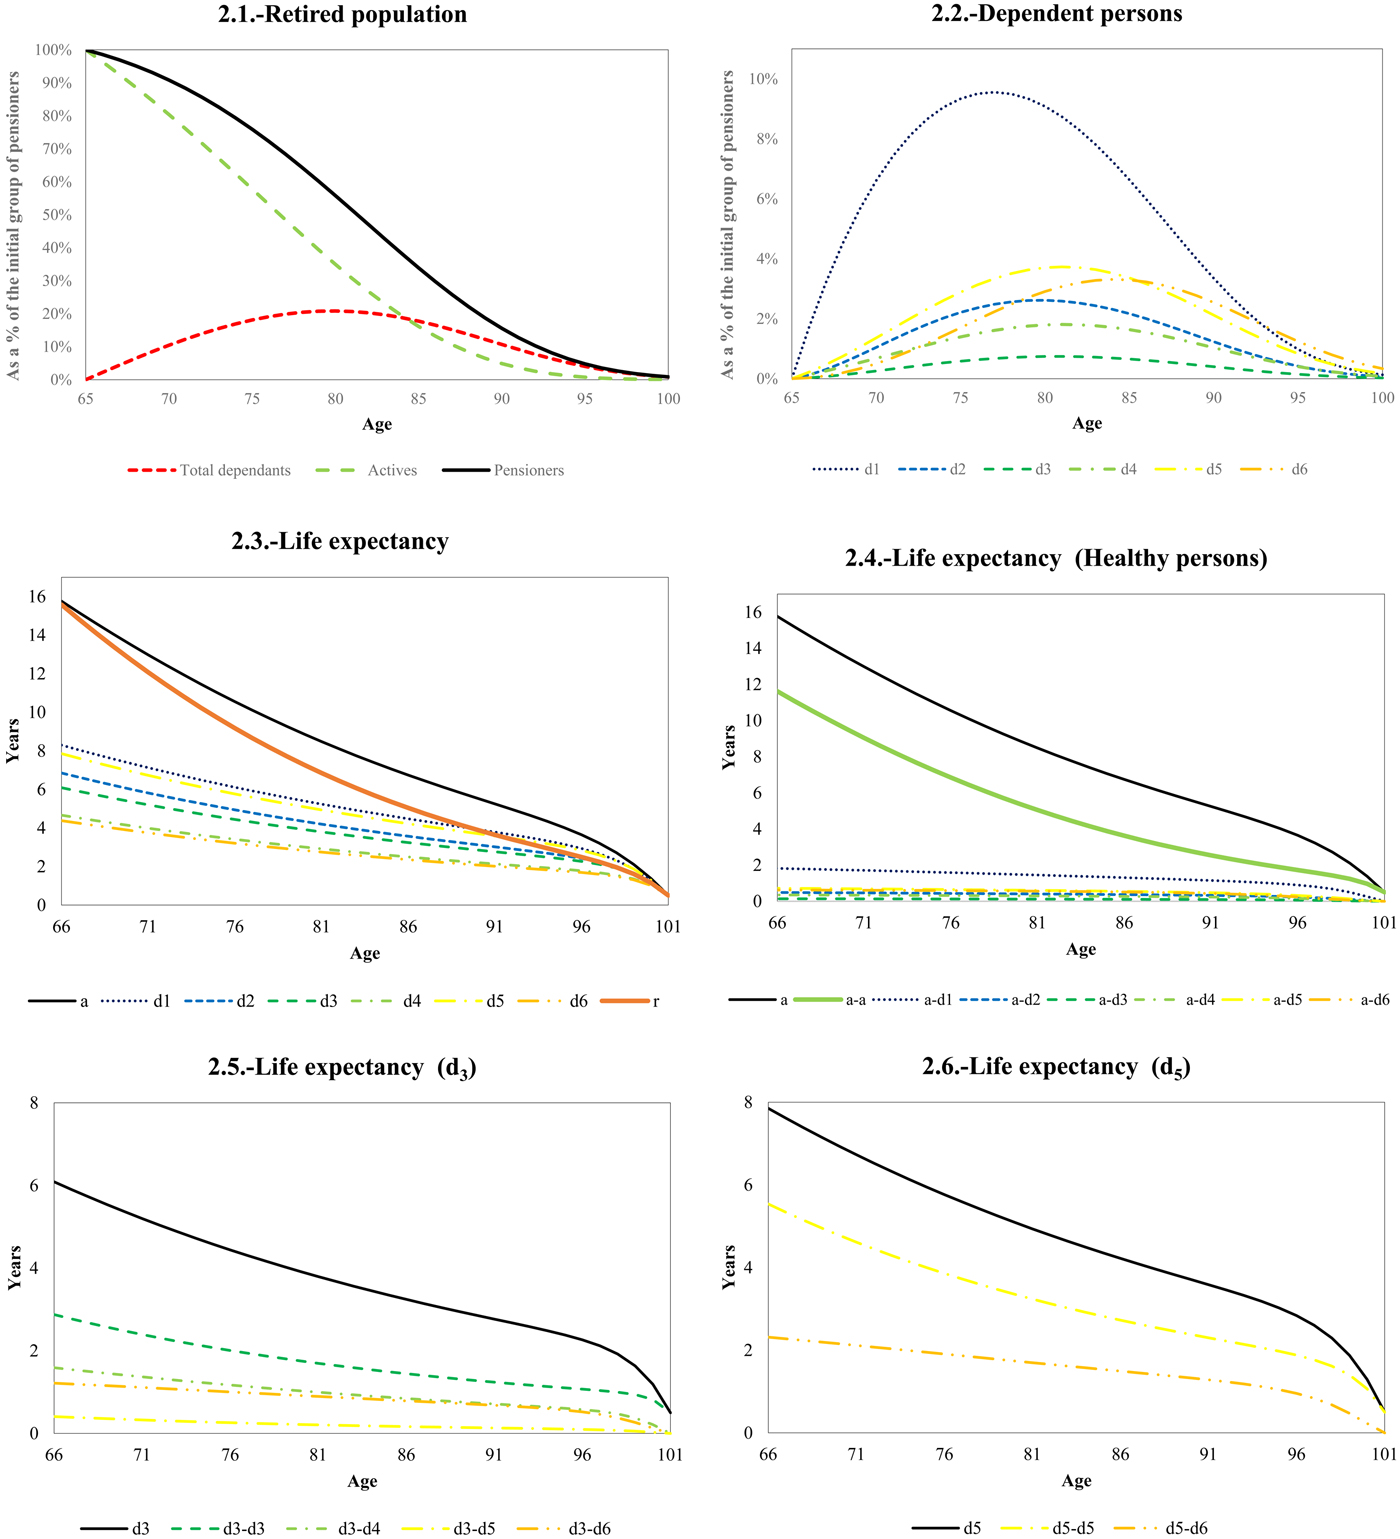
Figure 2. (Colour online) Population and life expectancy. Source: Own.
The evolution of total life expectancy by health state and for the retired population can be found in graph 3. This shows the total life expectancy for healthy persons (solid black line), for dependent persons (broken down into six LTC states) and for all the retired population (solid red line). It is worth remembering that the life expectancy of the pensioners is a weighted average of life expectancies for both collectives (healthy and dependent), the weighting being the dependent and healthy prevalence rates (Appendix 1).
The breakdown of life expectancy for healthy persons by health state is shown in graph 4 of Figure 2. We can see that life expectancy by age is broken down into seven health spells.
Graphs 5 and 6 represent life expectancy by age and state of dependence for dependent pensioners currently in states 3 and 5 respectively.
The expected number of years allocated to the possible range of health states depends on the starting status by age. State 5 again draws our attention because its associated life expectancy is higher than that calculated for states 2, 3, 4 and, logically, 6. This outcome could have its origins in mistakes made when classifying dependent persons by state of dependence. For the case of Australia, the papers by Hariyanto et al. (Reference Hariyanto, Dickson and Pitt2014a, Reference Hariyanto, Dickson and Pittb) show that the yearly probability of dying by gender and age increases (life expectancy decreases) when an individual's disability state worsens. A recent study performed using Japanese data (Tanaka, Reference Tanaka2016) shows the same pattern. Likewise, for the German case, Ehing and Hagis (Reference Ehing and Hagis2015) reveal that a higher care level is associated with an increase in mortality rates. This is not surprising since the different care levels can be seen as a proxy for health status.
Table 2 presents the main values that make up the system's equilibrium. The first item shows that the balanced contribution rate (θ t) coincides with the credited contribution rate (θ a). Also shown is the contribution rate assigned to each contingency, assuming the criterion for allocating pension costs is the extra benefit paid to the pensioner when healthy persons become dependent.
Given a set of biometric assumptions, the contribution rate assigned to enhance the annuity,  $\theta _t^{d_j} $, largely depends on the established structure of uplifts shown in Table 1. The contribution rate assigned to each state of dependence depends on the size of the uplift and the LTC prevalence rates, $\bar \lambda _x$ (item 2). The contribution rate allocated to level 1 disability is relatively low (0.34%) despite its high rate of prevalence (11.61%) among pensioners over 65. This is because the extra benefit paid for this level of care (25%) is the lowest. Conversely, the contribution rate allocated to level 5 disability is the highest (0.63%) even though its rate of prevalence is only moderate (4.57%). This is because its uplift is one of the highest (125%).
Items 3 and 4 show the value for the demographic ratio, dr t, and the financial ratio, fr t, respectively. It can be seen that the system is in equilibrium given that the product of both ratios equals the contribution rate. In the mature state, the contributor–pensioner ratio is 3.67 (the inverse of the demographic ratio) and the system's average replacement rate is 58.78%.
Items 5 and 6 replicate items 1 and 4 respectively, under the assumption that the total benefits paid to dependent persons are accounted for as pension costs attributed to the LTC contingency. In this case, the contribution rate assigned to each status is higher than before. This provides us with a more informative value of the financial ratio by contingency. Naturally, the system's average replacement rate remains unchanged, but the average replacement rates for dependence and retirement do change. Such results make sense because of the worst health status, the higher the average replacement rate.
Items 7 and 8 show the value of the annuity divisors for the traditional NDC scheme and the proposed scheme with LTC coverage. The difference between both is the higher value corresponding to states of dependence in the case of LTC coverage, i.e., being in any of them implies a higher cost for the system. The higher the established uplifts, the higher the difference between the two actuarial factors. Item 9 expresses the actuarial cost that each state of dependence represents out of the total costs (retirement and dependence), i.e., the higher the resulting value of the jLTCW t, the lower the amount of the initial pension in the integrated scheme. This value does not take uplifts into account, only biometric assumptions.
Item 10 shows the value for the coverage ratio. This figure conveys very important information for maintaining the system's equilibrium when adding the new contingency. It indicates that, for each monetary unit of the initial pension under the basic scheme (retirement only), 1.1485 monetary units are needed in order to compute the initial pension under the integrated scheme (retirement with a graded LTC).
Item 11, benefit reduction,  $(BR_t = (CR_t - 1/CR_t)\,\% )$, informs us about the effect that the introduction of the new contingency would have on the amount of the initial pension. In order to maintain the system's financial equilibrium, the initial pension has to be 12.93% lower than before.
Item 12 also provides very valuable information if the intention is to leave the amount of the initial pension unchanged. The new contribution rate needed to maintain the system's financial equilibrium,  $\theta _a^* $, would have to be 18.38%, i.e., it would need to be increased by 2.38% (item 13) to preserve the system's financial equilibrium.
If a particular country were under consideration, the information provided by items 11 and 12 could be used to test the political sustainability of the proposed scheme using questions such as Would you be willing to reduce your retirement pension by 12.93% in order to be entitled to LTC benefits? and Would you be willing to increase your contribution rate from 16% to 18.38% in order to have LTC coverage during your retirement period? Chen (Reference Chen2001) stated that, according to opinion polls in the USA, the public might be willing to trade off some Social Security benefits (retirement benefits) for LTC coverage.
Finally, item 14 shows that if the survivor dividend had not been included when calculating the initial retirement pension, a discrepancy would have arisen between the credited contribution rate equal to 16% and the rate necessary to finance the system,  $\theta _t^* $, in this case 12.68%. The impact of the dividend effect (item 15) on the initial pension is by no means irrelevant, and the initial retirement pension rises by 26.18% using the mortality structure derived from Robinson's CTM.
Although Robinson's (Reference Robinson1996) model continues to be widely used, the data upon which it is based are now more than 30 years old. In line with the trend observed in unisex life expectancy in the USA and a (subjective) modification of the inception and transition rates, two additional scenarios of biometric assumptions are available to give an idea of their impact on the system's equilibriumFootnote 8. These two sets of biometric assumptions highlight the importance of having accurate estimates of mortality, transition and incidence rates before any decision is made to put the model into practice.
4.2 The effect of introducing a minimum pension on the system's financial status
Our point of departure is the numerical example developed in the earlier sub-section for the  $NDC_{LTCG}^{} $ scheme. This system is extended from the start by introducing a minimum pension equivalent to ψ percent of the system's average wage. The resulting scheme now is called $NDC_{LTCG}^\psi $.
Table 3 presents the main indicators of the  $NDC_{LTCG}^\psi {\rm \;} \; $ scheme with a minimum pension for two scenarios: $\psi = 25\% $, which could be considered as being in line with real pension systems for developed countries, and $\psi = 75\% $, an extreme value that could, in fact, change the real nature of the NDC scheme. The indicators shown include the contribution rates assigned to each contingency under the assumption that the total benefits paid to dependent persons are accounted for as pension costs attributed to the LTC contingency. We can see the balanced contribution rate, $(\theta _t^* )$, and its decomposition as the product of the dependency ratio and the financial ratio, along with the system's shortfall due to the introduction of the minimum pension (as a percentage of the aggregate income from contributors). Also shown is the percentage of pensioners who would need an annual supplement to reach the level of the minimum pension. The values of the $NDC_{LTCG}^{} $ scheme without a minimum pension are given to make it easier to understand the impact of introducing the minimum pension on the system's financial equilibrium.
Table 3. Main indicators of the  $NDC_{LTCG}^\psi \; \; $ scheme with a minimum pension

Source: Own.
The introduction of a minimum pension equivalent to 25% of the system's average wage has a very limited impact on the system's financial equilibrium because only a small percentage of pensioners are granted this new benefit. Only those with fewer than 17 years of contributions benefit from it; 14.72% of pensioners would need to top up the capital accumulated in their individual accounts because the balance would be less than the minimum required to finance the LCA or EPA at the retirement age. We can see that the treasury shortfall is very small, barely amounting to 2.98% of the aggregate income from contributions. Likewise, the balanced contribution rate (16.48%) is higher than the rate credited to contributors (16.00%), in coherence with the very small rise in the system's financial ratio (from 0.5878 to 0.6054). The demographic ratio is obviously not affected by the introduction of a minimum pension.
For the second scenario ( $\psi = 75\% $), the snapshot of the system changes noticeably. The minimum pension applies to 34.81% of pensioners: those with fewer than 44 years of contributions. The lower the number of years contributed, the higher the amount of the supplement that the sponsor would have to pay to top up the capital accumulated in the individual accounts. Such a generous minimum pension causes an enormous financial problem. To maintain the system's sustainability, the sponsor would have to make payments every year to cover the system's recurrent annual deficit amounting to 22.24% of the aggregate income from contributions. In other words, the actual disbursement on pensions would call for a balanced contribution rate of 19.56% instead of 16.00%. This is a direct consequence of altering the system's average replacement rate from its original value (0.5355) to its new value (0.7186).
5 Concluding comments and future research
Just a few years ago, NDCs and LCAs were almost unknown even to experts on pension policy. Today both instruments are in the spotlight because researchers and policymakers believe they may help to deal with ageing and other socioeconomic changes observed in advanced countries. As far as we are aware, the issue of embedding a public LTC insurance scheme within the retirement pension system, specifically by introducing LCAs and EPAs into an NDC framework, had not been modelled in detail until very recently.
In the present paper, we have extended the proposal made by Pla-Porcel et al. (Reference Pla-Porcel, Ventura-Marco and Vidal-Meliá2016) by adding two new features: an LTC benefit graded according to the annuitant's degree of disability and a minimum pension for both contingencies.
The rationale behind introducing these two new features into the benchmark model is twofold. First, the aim when introducing a minimum pension into NDC schemes is to reconcile the financial sustainability of the system and the adequacy of the benefits provided. NDC schemes provide benefit for all contributors reaching the minimum retirement age, but there is no guarantee of sufficient income to maintain a minimum standard of living. Second, publicly-run LTC schemes recognize various degrees of dependence, and this classification has a direct effect on the amount of benefit paid.
The introduction of both features brings the model closer to the reality of social insurance and enhances its political attractiveness.
In order to deal with an increase in pensioner care needs, our model uses a CFC benefit to help pensioners cope with the cost of LTC. Our proposal aims to provide partial coverage of the LTC costs incurred by retirement pensioners and should be viewed as one of the pillars of multi-pillar public schemes.
The way LTC is treated in our proposal has several advantages. Briefly, it makes it easier to integrate both contingencies into an NDC framework, it raises awareness of LTC needs and, at least on paper, it is financially sound and sustainable over time. Furthermore, it does not raise the contribution rate for workers (EPA option), it extends LTC coverage, it introduces redistribution in a very transparent manner and it allows the sponsor (the state) to more effectively take into account trends in disability, longevity and other sources of risk in ‘pricing’ benefits. However, its direct application in practice would not be immediate. The policy implications of putting the model into practice would call for future research to be carried out in several directions. At the very least, the following issues would need to be thoroughly addressed: possible integration with other pillars of the pension system, design structure of the uplifts, updating the actuarial factors, communication with the public, and the ABS and the automatic balance mechanism.
On the practical side, the example developed confirms that our model works reasonably well because the results make sense and provide us with some useful values regarding the impact of introducing a graded LTC benefit into the traditional NDC scheme.
The paper also assessed the impact of introducing a minimum pension on the system's equilibrium. To enhance transparency and accountability, the cost of introducing minimum pensions has to be disclosed following the principle of separating the distributional aspects from strict NDC schemes, which means that the funds for financing non-contributory rights should be earmarked for the purpose, otherwise there is a risk of draining other funds or causing serious imbalances in the pension system.
Author ORCIDs
Carlos Vidal-Meliá, 0000-0002-7227-5076; Manuel Ventura-Marco, 0000-0002-4510-7499
Appendix 1 Description of the system and determining the initial benefit
The difference between this model and the one found in Pla-Porcel et al. (Reference Pla-Porcel, Ventura-Marco and Vidal-Meliá2016) is that the health status of retired pensioners is broken down into n levels depending on individual LTC needs and minimum pension benefits exist for both contingencies. We work with a multiple state transition model (Haberman and Pitacco, Reference Haberman and Pitacco1999; Pitacco, Reference Pitacco2014), which is a random process model that describes a subject's movements between a set of various states: contributors (active) (a), retired (healthy) (r), retired (j ∈ {1, 2, …, n}-level dependent) (d j, j ∈ {1, 2, …, n}), and deceased (f).
(i) Yearly transition probabilities
The discrete multi-state model can be expressed as an (n + 3)-state non-homogeneous discrete-time Markov chain in which no more than one transition within the year is assumed. We only consider the probability of staying in the same state of dependence, deteriorating or dying (absorbing state for natural reasons).
The yearly transition probabilities are:  $p_{x_e + k}^{aa} $: Probability that a contributor aged x e + k will reach age x e + k + 1 being a contributor. $p_{x_e + k}^{af} $: Probability that a contributor aged x e + k will die during the year. $p_{x_e + k}^{ar} $: Probability that a contributor aged x e + k will be retired one year later. $p_{x_e + k}^{rr} $: Probability that a retired person (healthy) aged x e + k will reach age x e + k + 1 in the same state. $p_{x_e + k}^{rd_j} $: Probability that a retired person (healthy) aged x e + k will reach age x e + k + 1 in a state of dependence d j,j ∈ {1, 2, …, n}. $p_{x_e + k}^{rf} $: Probability that a retired person (healthy) aged x e + k will die during the year. $p_{x_e + k}^{d_id_j} $: Probability that a retired person (i ∈ {1, 2, …, n}-level dependent) aged x e + k will reach age x e + k + 1 in a state of dependence d j, j ∈ {1, 2, …, n}, but only for i ≤ j given that the possibility of recovery has been ruled out. $p_{x_e + k}^{d_jf} $: Probability that a retired person (j ∈ {1, 2…, n}-level dependent) aged x e + k will die during the year.
The demographic-financial structure at any moment t from the start of the system is detailed below:
Age: We assume that participants’ lives can cover (w − x e) periods. The age giving entitlement to a retirement pension (x e + A) is fixed. The first state of dependence implies spending at least 1 year as a healthy retired person, and therefore the first age at which an individual could be dependent to any degree is x e + A + 1.
Number of contributors by age at time t:  $l_{(x_e + k,t)} = l_{(x_e,1)}\cdot (1 + \gamma )^{t - 1}\cdot _kp_{x_e}$, where $_k p_{x_e}$ is the stable-in-time ratio between the number of individuals aged x e and x e + k years, k ∈ {0, 1, 2, …, A − 1}. Stable ratios or probabilities include the decrements due to death associated with each age. It is a different matter when it comes to considering decrements or new entries due to migratory movements. These are included in parameter γ, which is an annual accumulative rate.
Average wage (average contribution base) by age at time t:  $y_{(x_e + k,t)} = y_{(x_e + k,1)}\cdot (1 + g)^{t - 1}$, i.e., the contribution base (coinciding with earnings) grows at an annual rate of g affecting all groups of contributors. The age-wage structure only undergoes proportional changes. The slope of the age-wage structure is constant.
Number of retired people (healthy) by age at time t:  $l_{(x_e + A + k,t)}^r = l_{(x_e + A,t - k)}^r \cdot {}_kp_{x_e + A}^{rr} $, where ${}_kp_{x_e + A}^{rr} $ is the probability that a retired person (healthy) aged x e + A will reach age x e + A + k in the same state (being healthy), k ∈ {0, 1, 2, …, w − (x e + A)}. For $k = 0\; \to l_{(x_e + A,t)}^r = l_{(x_e + A,t)}^{} $.
Number of retired people ( j ∈ {1, 2, …, n}-level dependent) by age at time t: The aim of this element is to model the evolution of the number of LTC recipients classified according to their degree of dependence, which involves computing the number of retired people by age at time t who will be in each of the n possible states of dependence. To calculate it, the initial generation of healthy pensioners is transited in time into steadily worsening levels of dependence. The transition probabilities are assumed to depend on age, genderFootnote 9 and the severity of the disability category.
Formula (4) expresses the number of retired (healthy) people aged x e + A in year t who, after k ∈ {1, 2, …, w − (x e + A)} periods, are in a state of dependence j ∈ {1, 2, …, n}.
 $$l_{(x_e + A + k,t + k)}^{d_j} = l_{(x_e + A,t)}^r \cdot {}_kp_{x_e + A}^{rd_j}. $$
 This can be calculated as the product of the initial group of retired people  $(l_{(x_e + A,t)}^r )$ and the probability that a retired person (healthy) aged x e + A will reach age x e + A + k as a j ∈ {1, 2, …n}-level dependent $({}_kp_{x_e + A}^{rd_j} )$.
The yearly probability of surviving for retired people (healthy and dependent): At time t, from retirement age onwards, x e + k ≥ x e + A, the yearly probability of surviving for the entire retired population (labelled as pensioners),  $p_{x_e + k}$, can be calculated as a weighted average of the probabilities of surviving for both collectives, $\{ p_{x_e + k}^{d_j}, p_{x_e + k}^r \} $, the weighting being the dependent and healthy prevalence rates:
 $$p_{x_e + k} = \sum\limits_{\,j = 1}^n {\overbrace{{\displaystyle{{l_{\left( {x_e + k,t} \right)}^{d_j}} \over {l_{\left( {x_e + k,t} \right)}^r + \mathop \sum \nolimits_{\,j = 1}^n l_{\left( {x_e + k,t} \right)}^{d_j}}}}} ^{{\lambda _{x_e + k}^j}} \cdot p_{x_e + k}^{d_j} + \overbrace{{\displaystyle{{l_{\left( {x_e + k,t} \right)}^r} \over {l_{\left( {x_e + k,t} \right)}^r + \mathop \sum \nolimits_{\,j = 1}^n l_{\left( {x_e + k,t} \right)}^{d_j}}}}} ^{{\left( {1 - \sum\nolimits_{\,j = 1}^n {\lambda _{x_e + k}^j}} \right)}}\cdot p_{x_e + k}^r}. $$
Formula (5.) implies that the following probabilities also hold:
 $$\eqalign{& p_{x_e + k}^r = p_{x_e + k}^{rr} + \mathop \sum \limits_{\,j = 1}^n p_{x_e + k}^{rd_j} = 1 - p_{x_e + k}^{rf}, \cr & p_{x_e + k}^{} + q_{x_e + k}^{} = 1, \cr & p_{x_e + k}^{d_j} = p_{x_e + k}^{d_jd_j} + \mathop \sum \limits_{\,j \lt i}^{} p_{x_e + k}^{d_jd_i} = 1 - p_{x_e + k}^{d_jf}, \,j\; \in \left\{ {1,2 \ldots, n} \right\},\,\; i \in \left\{ {2, \ldots, n} \right\}.} $$
where  $\lambda _{x_e + k}^j = l_{x_e + k}^{d_j} /l_{x_e + k}\; $: The j ∈ {1, 2, …, n}-level dependent prevalence rate for the group aged x e + k, which is the ratio between the number of dependent persons with dependence level j and the number of pensioners aged x e + k. It is important to highlight that for the group aged x e + A the dependent prevalence rate is equal to 0. $q_{x_e + k}$: Probability that a retired person aged x e + k will die within the year. $p_{x_e + k}$: 1 year survival probability for a retired person aged x e + k. $p_{x_e + k}^r $: Probability that a retired person (healthy) aged x e + k will reach age x e + k + 1. $p_{x_e + k}^{d_j} $: Probability that a retired person (j ∈ {1, 2, …, n}-level dependent) aged x e + k will reach age x e + k + 1 with any level of dependence.
Determining the average initial pension (pure NDC scheme): The average initial benefit (with survivor dividend) for an individual aged x e + A in year t, enhanced by percentages {ξ r1, ξ r2, …, ξ rn} if the healthy person becomes dependent,  $\bar P_{(x_e + A,t)}^{NDC} $, can be expressed, by analogy with Pla-Porcel et al. (Reference Pla-Porcel, Ventura-Marco and Vidal-Meliá2016), as:
 $$\eqalign{& \bar P_{\left( {x_e + A,t} \right)}^{NDC} \cr & \quad = \displaystyle{{\bar K_{(x_e + A,t)}^{ac}} \over {\underbrace{{\ddot a_{x_e + A}^{r\alpha} + \mathop \sum \nolimits_{\,j = 1}^n {}_{}^{\xi _{rj}} A_{x_e + A}^{rd_j\alpha}}} _{{AF_{(x_e + A)}^{LTC(n)}}}}} = \displaystyle{{\overbrace{{\theta _a\cdot \mathop \sum \nolimits_{k = 0}^{A - 1} l_{(x_e + k,\; k + t - A)}\cdot y_{(x_e + k,\; k + t - A)}\cdot {(1 + G)}^{A - k}}}^{{K_{\left( {x_e + A,t} \right)}^{acT}}}} \over {l_{(x_e + A,\; t)}^r \cdot \left[ {\ddot a_{x_e + A}^{r\alpha} + \mathop \sum \nolimits_{\,j = 1}^n {}_{}^{\xi r_j} A_{x_e + A}^{rd_j\alpha}} \right]}},} $$
where  $\ddot a_{x_e + A}^{r\alpha} $ is the present value at age x e + A of 1 monetary unit of a lifetime pension payable in advance while the individual is healthy, indexed at a rate α with a technical interest rate equal to G. $K_{(x_e + A,t)}^{acT} $: Total accumulated notional capital at time t for all individuals who reach age x e + A. The notional account is an accumulation of the contributions made, the survivor dividend distributed and the returns generated over the participant's working life. $\bar K_{(x_e + A,t)}^{ac} $: Average accumulated notional capital at time t for individuals aged $x_e + A$
 $$\bar K_{(x_e + A,t)}^{ac} = \displaystyle{{K_{(x_e + A,t)}^{acT}} \over {l_{(x_e + A,\; t)}}},$$ $AF_{(x_e + A)}^{LTC(n)} $: The annuity factor of the system with LTC coverage (this expression is fully developed in the paper by Pla-Porcel et al. (Reference Pla-Porcel, Ventura-Marco and Vidal-Meliá2017) for a more general case including the possibility of recovery). This is a key element in the proposed model. It should be estimated as accurately as possible to minimize the system's deviations. ${}_kp_{x_e + A}^{rd_j} $: Probability that a retired person (healthy) aged x e + A will reach age x e + A + k in any state of j ∈ {1, 2, …, n} dependence. ${}^{\xi _{rj}}A_{x_e + A}^{rd_j\alpha} $: Present actuarial value, for a healthy person aged x e + A, of the graded LTC annuity or enhanced pension that supplements 1 monetary unit of the initial retirement pension by percentage ξ rj, where j ∈ {1, 2, …, n}and 0 <ξ r1 <ξ r2 < · · · <ξ rn. The enhanced benefits are paid from the moment the healthy person becomes dependent and for as long as they remain in a state of dependence. $\ddot a_{x_e + A + k}^{d_j\alpha} $: Present value at age x e + A of 1 monetary unit of a lifetime pension payable in advance while the individual remains in any state of j ∈ {1, 2, …, n} dependence.
This way of calculating the initial benefit is in line with real practices found in Sweden and Italy, where benefits are frontloaded right from the start with a ‘predefined’ rate of growth during the expected life of the recipient. This policy of indexing benefits enhances the political attractiveness of the system.
The average initial pension with a minimum pension benefit: The amount of the initial retirement pension awarded to pensioners in year t is the maximum between the benefit computed according to formula (7)  $(\bar P_{(x_e + A,t)}^{NDC} )$ and the minimum pension, $(\bar P_{(\bar y,t)}^{Min} )$:
 $$\bar P_{(x_e + A,t)} = Max\left\{ {\bar P_{(x_e + A,t)}^{NDC[r]}, \; \,\bar P_{(\bar y,t)}^{Min[r]}} \right\}.$$
 For the following years, assuming that all pensions are indexed at the same rate and that k{1, 2 ω − (x e + A)}, the benefit will depend on the health status of the pensioner, $\overline P _{(x_e + A + k,t + k)} = Max\left\{ {\bar P_{(x_e + A + k,t + k)}^{NDC}, \,\bar P_{(\bar y,t + k)}^{Min}} \right\}$, where, because a higher level of LTC means greater expenses for the annuitant and the amount of the minimum pension in the case of LTC need is fully linked to retirement, $\bar P_{(x_e + A + k,t + k)}^{Min\,[r]} \lt \bar P_{(x_e + A + k,t + k)}^{Min\,[d_1]} = (1 + \xi _{r1}) \cdot \bar P_{(x_e + A + k,t + k)}^{Min\,[r]} \lt \!\cdots\! \lt \bar P_{(x_e + A + k,t + k)}^{Min\,[d_n]} = (1 + \xi _{rn}) \cdot \bar P_{(x_e + A + k,t + k)}^{Min\,[r]} $.
With population growth of γ > 0, there are A different contribution pathways that will determine A different pensions, as contributors might be working for 1 year, 2 years…, A years.
 $$l_{(x_e + A,\; t)} = \mathop \sum \limits_{c = 1}^A l_{(x_e + A,\; \,c,\,t)};\,\,K_{(x_e + A,t)}^{acT} = \mathop \sum \limits_{c = 1}^A K_{(x_e + A,c,t)}^{ac} \cdot l_{(x_e + A,\,c,\,t)},$$
 $$\bar K_{(x_e + A,t)}^{ac} = \displaystyle{{\overbrace{{\mathop \sum \nolimits_{c = 1}^A K_{(x_e + A,c,t)}^{ac} \cdot l_{(x_e + A,\,c,\,t)}}}^{{K_{(x_e + A,t)}^{acT}}}} \over {l_{(x_e + A,\; t)}}},$$
where  $l_{(x_e + A,c,t)}$: Number of individuals who retire at age x e + A and have been contributing for the last c years at time t. $K_{(x_e + A,c,t)}^{ac} $: Accumulated notional capital at time t for one individual aged x e + A who has been contributing for the last c years.
The average initial pension for individuals who retire at the retirement age,  $\bar P_{(x_e + A,t)}^{} $, is a weighted average of the A different pensions once settled. To determine this benefit, the system does not take into account the contributions made (if any) by the contributor before joining the scheme:
 $$\eqalign{\bar P_{(x_e + A,\,t)} & = \displaystyle{{\mathop \sum \nolimits_{c = 1}^A \overbrace{{Max\left[ {\overbrace{{K_{(x_e + A,\; c,\; t)}^{ac} /AF_{(x_e + A)}^{LTC(n)}}} ^{{P_{(x_e + A,\; c,\; t)}^{NDC}}}, P_{(\bar y,\; c,t)}^{Min}} \right]}}^{{P_{(x_e + A,c,t)}}}\cdot l_{(x_e + A,\; \; c,\; \; t)}} \over {l_{(x_e + A,\,t)}}} \cr & = \displaystyle{{\bar K_{(x_e + A,\,t)}^{ac}} \over {AF_{(x_e + A)}^{LTC(n)}}} + \overline {SP} _{(x_e + A,\,t)},}$$
where  $\overline {SP} _{(x_e + A,\,t)}\; $ is the average supplementary retirement benefit at time t, defined as:
 $$\overline {SP} _{(x_e + A,\,t)} = \displaystyle{{\mathop \sum \nolimits_{c = 1}^A Max\; \left\{ {P_{(\bar y,c,\; t)}^{MIN} - P_{(x_e + A,\; c,\; t)}^{NDC}, 0} \right\} \cdot l_{(x_e + A,c,\; t)}} \over {l_{(x_e + A,t)}}} = \displaystyle{{V{\overline {SP}} _{(x_e + A,\; \; t)}} \over {AF_{(x_e + A)}^{LTC(n)}}}, $$
where  $V\overline {SP} _{(x_e + A,\,t)}$ is the difference between the present value of the positive differences between the minimum pensions awarded and the account balances of participants available at the time of retirement (t) for age x e + A, under the assumption that all pensions are indexed at the same rate (α). In this case, the concept can be formalized as:
 $$V\overline {SP} _{(x_e + A,\,t)} = \mathop \sum \limits_{c = 1}^A \displaystyle{{Max\; \left\{ {P_{(\bar y,c,\; t)}^{MIN} - P_{(x_e + A,\,c,\,t)}^{NDC}, \,0} \right\} \cdot l_{(x_e + A,c,\; t)}} \over {l_{(x_e + A,t)}}} \cdot AF_{(x_e + A)}^{LTC(n)}. $$
The total spending on new retirement pensions awarded in year t can be expressed as:
 $$\bar P_{(x_e + A,\,t)} \cdot l_{(x_e + A,t)} = \left[ {\displaystyle{{\bar K_{(x_e + A,\,t)}^{ac}} \over {AF_{(x_e + A)}^{LTC(n)}}} + {\overline {SP}} _{(x_e + A,\,t)}} \right] \cdot l_{(x_e + A,\,t)}$$
In short, the main way in which this differs from a pure NDC scheme is that, if the amount of the initial retirement pension (including a graded LTC benefit) is below a minimum value, the amount is supplemented up to the minimum benefit.
The NDC scheme for retirement and graded LTC benefit in a mature state Footnote 10: The financial sustainability of PAYG schemes demands that the total spending on pensions has to be equal to the aggregate income from contributions according to the balanced rate, plus the additional resources to finance non-contributory rights (NCRs). If NCRs are excluded, the system's income from contributions is equivalent to the commitments that the system takes on with pensioners who have just retired, i.e., equivalent to the accumulated notional capital belonging to new beneficiaries in year t.
Once the system reaches the mature state, t = ω − x e − A years from inception, it pays full benefits to all generations of pensioners irrespective of their health status. The contribution rate, also called the macro contribution rate, that guarantees equality between contribution revenue and pension expenditure is constant over time and is the product of the stabilized demographic ratio and the financial ratio. The financial ratio is constant because the average pension and average contribution base both evolve at the rate of variation in wages. In addition, the explicit consideration of the survivor dividend guarantees equivalence between the macro (balanced) contribution rate (θ t) and the credited individual contribution rate (θ a).
The coverage ratio: An analysis of the coverage ratio shows the key parameters that determine the amount of the initial pension when a graded LTC benefit is included:
1. The higher the value assigned to any ξ rj, j ∈ {1, 2, …, n}, the lower the amount of the initial pension in the integrated scheme. It is easy to see that for all j ∈ (1, 2, …, n), ξ rj = 0, CR t = 1, given that
$\left( {\ddot a_{x_e + A}^\alpha= \ddot a_{x_e + A}^{r\alpha} + \sum\nolimits_{j = 1}^n {{}_{}^0 A_{x_e + A}^{rd_j\alpha}}} \right)$, i.e., the amount of the pension is not increased when the able person becomes dependent.2. The higher the probability of becoming dependent on a given age,
$p_{x_e + A + t - 1}^{rd_j} $, j ∈ {1, …, n}, or of moving to a greater level of dependence, $p_{x_e + A + t - 1}^{d_id_j} $ – with i ∈ {1, 2, …, n − 1} < j ∈ {2, …, n} – the lower the amount of the initial pension.3. The higher the probability of survival for any level of dependence,
${}_{k - t}^{} p_{x_e + A + t}^{d_jd_j} $, j ∈ {1, …, n}, the lower the amount of the initial pension.4. If the indexation of pension benefits is fully linked to wage bill growth, which implies that F = 1, i.e., α = G, then the content of the previous paragraph becomes even clearer given that the LTC ratio,
$jLTCW_t = (e_{x_e + A}^{rd_j} /1 + e_{x_e + A})$, j ∈ {1, …, n}, can be expressed as a ratio of life expectancy depending on health status. The higher the number of expected ‘unhealthy life years’, the lower the amount of the initial pension.


