


1. INTRODUCTION
The multi-sensor Personal Navigator (PN) system, developed at The Ohio State University, SPIN Laboratory, is a Dead Reckoning (DR) navigator, which does not require pre-existing infrastructure or prior knowledge about the environment to enable pedestrian navigation in Global Positioning System (GPS)-denied environments (Grejner-Brzezinska et al., Reference Grejner-Brzezinska, Toth, Moafipoor and Jwa2006). In the current sensor configuration, the observation vector is provided by a set of self-contained sensors, including a dual-frequency Topcon Legacy GPS receiver, a tactical grade Honeywell HG1700 Inertial Measurement Unit (IMU), the Honeywell HMR3000 magnetometer, the Vaisala PTB220 digital barometer, and a set of four GPS time-synchronized micro-switches, located in the shoe soles (at heels and toes). Note that the PN operates in two different modes: (1) integrated GPS/IMU mode, during GPS availability, and (2) DR mode, in GPS-denied environments; note the DR mode is of major interest in this paper.
In the PN, the DR algorithm is executed in four phases: (1) step detection, (2) Step Direction (SD) determination, (3) locomotion pattern estimation, and (4) Step Length (SL) prediction. First, the step events can be detected very reliably by either the step sensor or accelerometer. The step sensor is a set of four micro-switches, located in the shoe soles and synchronized with GPS time, used to sense the impact, i.e., the instants when the operator's shoes hit the ground. The second approach to estimate the step events is based on the accelerometer data. If a step cycle is represented as a sequence of four events – heel-strike, opposite toe-off, opposite heel-strike and toe off – then the heels coming into contact with the ground (heel-strikes) appear as peaks in the sensed acceleration, and so represent the step events (Moafipoor et al., Reference Moafipoor, Grejner-Brzezinska, Toth, Gartner and Rehrl2008a). Note that using accelerometers for step detection is less reliable for low dynamic motion. Second, the SD is estimated by the gyro and magnetometer compass (Moafipoor et al., Reference Moafipoor, Grejner-Brzezinska and Toth2008b; Grejner-Brzezinska et al., Reference Grejner-Brzezinska, Toth and Moafipoor2007a). Third, knowing the locomotion pattern comes with the advantage of matching the navigation algorithm to the dynamics of motion. Thus, sensor errors can be better mitigated, and the prediction of the user's location and the estimation of the DR parameters can be improved. These translate to reformulating the point-to-point DR navigation into a dynamic trajectory reconstruction. The current system can classify a wide range of locomotion patterns, including walking, jogging, running, backward walking, or climbing upstairs and downstairs. Fourth, the SL is defined as the distance between two successive points of heel-ground contact. The OSU PN prototype uses an unconventional sensor, called human locomotion model, by which the SL is predicted. The human locomotion model is based on analysing measurable step parameters that allow drawing certain conclusions about the human dynamics. A method for parameterizing the SL, based on body acceleration signals and the location data (e.g., slope, altitude), has been introduced in (Grejner-Brzezinska et al., Reference Grejner-Brzezinska, Toth, Moafipoor and Jwa2006). These parameters are passed to a Knowledge-Based System (KBS) to approximate the SL. The KBS in the form of an artificial neural network or fuzzy logic system (Moafipoor et al., Reference Moafipoor, Grejner-Brzezinska and Toth2008b) is trained by the data provided from the reference human locomotion model. Once the KBS database is built, the SL can be accurately predicted for each step. An example of KBS SL prediction and SD estimation, as well as DR navigation trajectory reconstruction, is discussed in (Moafipoor et al., Reference Moafipoor, Grejner-Brzezinska and Toth2008c).
The DR navigation is a relative navigation approach, the basic idea of which is to integrate incremental motion information, defined by the travelled distance and direction, over time. Starting from a known position, successive position displacements, derived in the form of changes in the SD and SL, are accumulated. The main shortcoming of this approach is the fact that the errors associated with the previous estimates propagate into subsequent estimates, and adversely impact the trajectory recovery process. Eventually, the total error will exceed the upper bound of the acceptable navigation accuracy. Therefore, it is important that the integrity of DR navigation parameters is continuously monitored.
To constrain the growing DR error in the absence of any supporting non-inertial sensor data, an accurate prediction model, by which the possible outliers would be identified and compensated before propagating through the DR trajectory, must be developed (Moafipoor et al., Reference Moafipoor, Grejner-Brzezinska, Toth, Gartner and Rehrl2008a). Accordingly, in this paper, a design and implementation of a two-stage Kalman Filter (KF) DR algorithm for accurate prediction of DR parameters, referred to as DR-KF, are discussed.
The integrity of the DR-KF solution is assured via integrity monitoring of its observation and prediction models. In general, the observation model for a PN is provided by a range of systems, including GPS, pseudolites, wireless location-based services, and optical techniques (Grejner-Brzezinska et al., Reference Grejner-Brzezinska, Toth and Moafipoor2008). The integrity of the observation model can be expressed as the possibility of identifying and compensating observation errors with a certain probability. To design a failure detection system of the observation model in real time, the redundancy condition is required (Willsky, Reference Willsky1976). If the redundancy is high in the system, an outlier can be simply identified and eliminated, or replaced by a new observation (Lu, Reference Lu1991; Mertikas and Rizos, Reference Mertikas and Rizos1997; Cole et al., Reference Cole, Wang and Dempster2007). However, for a low redundancy system, such as the PN system in DR navigation mode discussed here, the identified outliers should be compensated by other means. In this paper, the method introduced in (Teunissen and Salzmann, Reference Teunissen and Salzmann1989) is extended and applied to integrity monitoring of the observation model in the DR-KF structure.
The quality of the prediction model has a significant impact on the state estimators. Considering the complexity of the human operator's tracking manoeuvres, several approaches have been developed, e.g., (Popoli and Blackman, Reference Popoli and Blackman1999; Naranjo and Gonzalez, Reference Naranjo and Gonzalez2004; Kim and Hansen, Reference Kim and Hansen2003; Rigoll et al., Reference Rigoll, Eickeler and Muller2000; Kramer and Stubberud, Reference Kramer and Stubberud2006). The focus of these investigations is on developing advanced tracking methods based on assured sufficient redundancy in the observations, by using a variety of active and passive sensors. However, due to a low redundancy in the PN system, many standard methods of tracking cannot be applied. Thus, a new approach for the prediction stage using the body locomotion model is proposed here, where a polynomial with an order corresponding to the level of dynamics is applied to track the user's motion. Accordingly, for a low dynamic motion, a first-order polynomial is suggested, and for a higher dynamic motion, a second order is assumed. The main flaw of this prediction method is the limited ability to model the activity for mix dynamics, e.g., switching from walking to jogging. This deficiency could lead to a misclassification in the tracking system that might ultimately degrade the navigation performance.
Once an outlier is identified in the observation and/or prediction model, the next step is to compensate it. An outlier in the observation model is interpreted as bias, and an outlier in the prediction model is interpreted as misclassification. The approach used here is to utilize a KBS in the form of an Artificial Neural Network (ANN) (Reiterer et al., Reference Reiterer, Egly, Vicovac, Mai, Moafipoor, Grejner-Brzezinska and Toth2010). Note that the foundation of the intelligent PN concept proposed here rests on exploiting the KBS concept in different forms and at various levels of DR navigation algorithm. One ANN is used for SL prediction, called ANN-SL, and another ANN is added for monitoring the integrity of the prediction model. It must be emphasized that there is no over-lap between these two ANNs, and the focus of the paper is on the second ANN. The first application of the ANN is briefly discussed in (Grejner-Brzezinska et al., Reference Grejner-Brzezinska, Toth and Moafipoor2008).
The Neural Kalman Filter (NKF) resulted from the recent research on improving the target motion modeling (Kramer and Stubberud, Reference Kramer and Stubberud2006; Stubberud et al., Reference Stubberud, Lobbia and Owen1995; Owen and Stubberud, Reference Owen and Stubberud2003). The NKF is a KF that uses an ANN to improve the state-coupling function, used in the prediction model. In this algorithm, the ANN trains on-the-fly to learn the difference between the dynamics of the actual system and the model used by the DR-KF. Once the ANN is trained, it can be used to predict the location of the user.
In short, the approach used in this paper to monitor the integrity of the observation and prediction models, that is to identify outliers or misclassifications and to compensate for them, is facilitated by the integration of the DR-KF and ANN, referred to as DR-NKF. The paper is organized as follows: Section 2 presents the structure of a DR-KF, where the stochastic hypothesis testing and its application in identifying outliers in the KF are also explained. Section 3 provides a review on the NKF and its application in compensating for identified errors and consistency checking. Section 4 discusses the system configuration and the architecture of the DR-NKF. Numerical results and tests based on simulated and real-world data are shown in Section 5. The summary and conclusions follow in Section 6.
2. TWO-STAGE KALMAN FILTER (KF)
The objective of a KF is to perform optimal estimations with well-defined statistical properties. The quality of the estimations is assured as long as the assumptions about the underlying mathematical model are correct. Otherwise, any misclassification in the prediction and/or observation models may lead to a filter divergence. Therefore, it is important to verify the validity of the mathematical models used (Lu, Reference Lu1991; Teunissen, Reference Teunissen1990; Schaffrin, Reference Schaffrin1994). The misclassification in the KF is typically referred to in two forms: (1) errors in the system prediction and the associated error models (actual failure), and (2) error in the observation and the associated error models (sensor failure). A DR-KF is designed for the validation of both the prediction and the observation models. Equation (1) expresses the general DR-KF model in presence of constant biases with unknown magnitudes, γ k, in the functional model of KF:

where,
• x k is the m×1 parameter-state vector prior to t k+1; in PN, it includes the SL, SD and the position vector, and thus, m=5, which can be extended to additional navigation parameters, such as velocity or attitude, depending on the observability conditions.
• Φk+1, k is the m×m state transition matrix, calculated according to the current type of body locomotion that is recovered by means of the IMU (accelerometer, gyro), magnetometer, and barometer measurements (Moafipoor et al., Reference Moafipoor, Grejner-Brzezinska and Toth2008b).
• C k+1 denotes a m×b Jacobian matrix of full column rank of the possible system misclassifications.
• γ k+1 is the (b×1) unknown vector of bias terms associated with the misclassifications, where b is set as 2 in the PN.
• w k+1 is the m×1 process noise, representing the covariance matrix uncertainty in the state model, w∼N(0,Q).
• y k+1 is the n×1 observation vector, which includes SL and SD, evaluated by the locomotion dynamics, and the associated position coordinates, and thus n=4, which are calculated by accumulating incremental motion from the last updated position coordinates.
• H k+1 is the n×m observation matrix.
• D k+1 is the n×b Jacobian matrix of partial derivatives of the observation model with respect to the possible system misclassifications.
• v k+1 is the n×1 observation noise with the corresponding noise covariance matrix, R, v∼N(0, R), representing the uncertainties in the observation vector for each step.
The matrices C k+1 and D k+1 determine how the bias components propagate through the prediction and the observation models, respectively. The most typical of biases, γ, in DR navigation are constant biases with unknown magnitudes (Li and Jilkov, Reference Li and Jilkov2004). The other types of biases, such as a jump or a slip in the state vector are also considered (Willsky, Reference Willsky1976; Salzmann, M. Reference Salzmann1994). Here, a complex yet realistic case is considered, where the user's motion model, carried out from one step to another, is modelled as a jerky motion. Note that the error resulting from using a first-order polynomial model for the user's dynamic model is equivalent to a divergence from the uniform motion. Similarly, the error generated as a result of using a second-order polynomial model is equivalent to a divergence from a stable acceleration motion (Mahapatra and Mehrotra, Reference Mahapatra and Mehrotra2000; Hanawa et al., Reference Hanawa, Yonekura and Kishi2005).
The objective of the DR-KF estimation is to break down the process into two steps: (1) to perform the conventional bias-free KF and compute the bias-free state estimations, x k+1, and (2) to estimate bias vector and correct the bias-free estimates, γ k+1 (Teunissen, Reference Teunissen1990). Once the bias estimates are determined, the bias-free KF estimates and their variance-covariance matrix are recursively computed.
2.1. Stochastic Test
Under the assumption that the prediction and observation models correctly express the underlying system model, the KF, in general, provides the minimum variance, unbiased estimation of the state vector at each epoch k. In this case, the innovation sequence or measurement residual, e, has a zero-mean Gaussian white noise. Thus, a recursive testing can be used as an indicator of the quality of the model. The problem of detecting a bias vector can be accomplished by using a null hypothesis against alternative hypothesis, shown in (2). The two hypotheses are defined as:

where:
and:
γe: unknown vector,
C e: assumed to be a known full column rank.
The bias term, γ e, is caused by any misclassification in the KF prediction and/or observation models. The goal of the stochastic test is to detect a specific bias term (Lu, Reference Lu1991). Under the assumption that the underlying prediction and observation models are correct with normally distributed random errors, the test statistic is distributed as:
where χ α2 is the upper probability point of the central χ 2-distribution with b degrees of freedom and α, the level of significance. The non-centrality parameters, ![]() , vanishing under H 0, can be computed as (Schaffrin, Reference Schaffrin1994):
, vanishing under H 0, can be computed as (Schaffrin, Reference Schaffrin1994):
where:
Q e is a cofactor matrix.
C e is the variance-covariance matrix of the innovation sequence.
With a selected level of significance, α, the null hypothesis is rejected when the following inequality does not hold:
The right and left terms of the test in Equation (6) are taken from the standard χ 2-square tables. The acceptance or rejection of the statistical hypothesis test is a function of the significance level, α. If, for a given significance level, the null hypothesis is rejected, although it is true, a Type I error occurs. A Type II error occurs if the null hypothesis is accepted, while it is false. While the probability of the Type I error is a function of the significance level, α, the probability of the Type II error, denoted by β, is related to the non-centrality parameter, ![]() , of the alternative test, shown in Equation (4). Since a hypothesis test should be unbiased, it implies that the probability of rejecting a false null hypothesis is greater than or equal to the probability of rejecting a true one (Koch, Reference Koch1988). In many real time applications, such as PN, a Type I error is the more important error to avoid than a Type II error, and, therefore, the system design is focused on minimizing the occurrence of this statistical error. To this end, the probability for the Type I error in our application is set to 1% or 5%, which implies that there is a 1% or 5% chance that the observations are not correct. If Equation (6) is true, the null hypothesis is accepted, and if it is rejected, a flag is set for correcting the identified biases.
, of the alternative test, shown in Equation (4). Since a hypothesis test should be unbiased, it implies that the probability of rejecting a false null hypothesis is greater than or equal to the probability of rejecting a true one (Koch, Reference Koch1988). In many real time applications, such as PN, a Type I error is the more important error to avoid than a Type II error, and, therefore, the system design is focused on minimizing the occurrence of this statistical error. To this end, the probability for the Type I error in our application is set to 1% or 5%, which implies that there is a 1% or 5% chance that the observations are not correct. If Equation (6) is true, the null hypothesis is accepted, and if it is rejected, a flag is set for correcting the identified biases.
3. NEURAL-KALMAN FILTER (NKF)
The main impact of the ANN on the KF performance can be observed when the prediction and/or observation model cannot be formulated, or is not completely known due to any misclassifications (Haykin, Reference Haykin2001). To aid the state estimation in these cases, the KF can be augmented by an ANN. The NKF is a coupled system of a standard KF and an ANN that trains the prediction model (Stubberud et al., Reference Stubberud, Lobbia and Owen1995; Jwo and Huang, Reference Jwo and Huang2004). Considering the low redundancy in our PN, tracking the operator motion and predicting the next manoeuvre is likely to be unfeasible in the presence of any outliers. Thus, a system prediction model in the form of an ANN may only facilitate the efficient capture of operator manoeuvring. The advantage of the NKF proposed here is that no prior knowledge of the user movement is required. The ANN used in this paper to incorporate the user dynamic is a Radial Basis Function (RBF) network. The RBF network is considered as a function approximation, which can simply be trained to perform the input/output mapping without requiring any prior knowledge about the user dynamics.
3.1. PN and RBF Network Architecture
The RBF network is designed to perform input-output mapping based on the concept of locally tuned radial basis functions. The RBF network is trained by the hybrid learning rule, which is unsupervised learning in the input layer, and supervised learning in the output layer (Principe et al., Reference Principe, Euliano and Lefebvre2000; Jwo and Huang, Reference Jwo and Huang2004). To establish the RBF network for modelling the non-linear locomotion dynamic model, it is first necessary to determine the number of elementary functions (neurons) in the input, the hidden, and the output layers.
In the proposed RBF model, the training objective is to approximate the error between the actual location and the estimated location. Thus, the output layer has two neurons related to the position displacements, ∆x, ∆y. The number of hidden neurons indicates the complexity of the user's manoeuvres and the approximation of his dynamics. Note that too few neurons result in an inability of the RBF to efficiently approximate the user dynamic model. The number of neurons in the hidden layer, which is proportional to the number of input layer neurons, is chosen empirically and subsequently fixed for the training of the network. The elementary functions in the input layer include the variables that define the non-linear model of the user dynamics. In the PN architecture discussed here, to fully parameterize the user dynamic, the input parameters of the RBF are selected as changes of the user velocity and attitude for each step cycle. Thus, the RBF inputs are: step interval (SI), SL, SD, heading change (ΔSD), and locomotion pattern. SI is defined as the time between two successive heel strikes. Figure 1 shows the architecture of the RBF network designed for modelling the user dynamic model based on the above five inputs. During RBF training, the five process parameters are fed until the Mean Squared Error (MSE) has converged. The termination criterion is based on the minimum error reached, in this case, 5%. Once the satisfactory MSE is obtained, the prediction model is considered trained.

Figure 1. Conceptual design of the RBF-based ANN to predict (model) location increments.
4. PN SYSTEM CONFIGURATION
Figure 2 illustrates the current PN concept, which operates in two modes: (1) multisensor-based navigation and training mode during GPS signal reception, and (2) DR navigation in GPS-denied conditions (Grejner-Brzezinska et al., Reference Grejner-Brzezinska, Toth and Moafipoor2007b). When GPS data are available (solid green), all sensors are calibrated in an Extended Kalman Filter (EKF), which estimates the navigation solutions and all sensor errors. The navigation solution is then used to evaluate the human locomotion model (SL/SD/locomotion pattern) and train the RBF dynamic prediction model. The locomotion model is subsequently used to predict DR parameters during the GPS signal blockage (red dot). During GPS signal blockage, the locomotion model outputs are used as the DR-KF observation model, and the (trained) RBF dynamic model is used as the prediction model of the DR-KF.

Figure 2. System design.
The objective of the DR-NKF is to identify and compensate for the uncertainty of the DR-KF observation/prediction models; Figure 3 shows the DR-NKF architecture. The process includes three main steps: (1) alarm, (2) identification, and (3) error compensation (Willsky, Reference Willsky1976). The alarm task simply signals a binary decision based on the outcome of the null hypothesis shown in Equation (2), and indicates whether there is an outlier in the DR-KF or not. If there is no outlier, the DR trajectory is computed using Equation (1), under the assumption that γ=0.

Figure 3. DR-NKF architecture.
The identification task determines the type of outlier, which is (1) the outlier in the DR-KF prediction model and associated error models, Q, or (2) outlier in the DR-KF observation model and associated error models, R. If there is an outlier in the prediction model, the outlier is identified in the RBF process, and the system noise covariance, Q, is adjusted accordingly. If there is any outlier in the observation model, the outlier observation should be replaced. Corresponding to the replacement observation, a suitable noise covariance matrix, R, is assigned to the observation model. A smaller R matrix, relative to the Q matrix, indicates that the states should rely less upon the observations, and the estimation should primarily follow the prediction model provided by the RBF network. Conversely, for a small Q matrix, the states follow the observations closely.
5. EXPERIMENTAL RESULTS
This section provides a performance evaluation of the DR-NKF, with a special emphasis on failure detection. For this purpose, the numerical tests were conducted on, first, simulated data, and, second, on real-world indoor navigation data. In a real-scenario indoor navigation, one can easily observe the actual outliers, because the user has to change his/her dynamics continuously with respect to the restricted environments.
Four separate tests, listed in Table 1, were conducted at The Ohio State University Campus. In all cases, the operators initially moved outside a one-storey building, then entered the building, walked the hallways of the building, and made several loops following the control points marked in the hallways. The floor plan of the building was acquired by classical surveying methods, and several control points were established in the hallways with the accuracy better than 1–2 cm in East and North, and 5 mm in height. The control points provided a reference of the user's position and served as reference trajectory.
Table 1. Summary statistics of the success rate for SL/SD outlier identification using hypothesis test with thresholding technique.

5.1. Simulated Data
In order to create simulated data, a part of the real dataset, where the operator moved in a mixed pattern of walking and jogging, was selected. Note that if the dynamic model for this case were approximated as a walking pattern only, the corresponding first-order prediction model would not be a sufficient representation of the dynamic prediction model, particularly for time periods when the operator's acceleration changed. As a result, any unmodelled acceleration should be observed in the DR-KF dynamic model as outliers. To create this scenario, a dataset was intentionally mis-trained by enforcing a walking locomotion pattern only. The result of this mis-training was the unmodelled acceleration that resulted in a bias of about 20 cm error in the predicted SL. Detection of this unmodelled acceleration in the prediction model is the main objective of this simulation experiment. In this simulation, the dynamic model of the user, see Equation (1), whose locomotion pattern was mostly identified as a walking pattern, was approximated as:
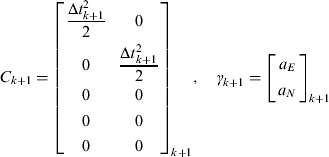
where, Δt k+1 corresponds to SI, and (a E, aN) represent the unmodelled horizontal accelerations in East and North directions, respectively.
The next step was to test if the DR-KF algorithm was capable of verifying whether the prediction dynamic model is valid or not. Figure 4 shows the estimated displacement (error due to mis-modelled SL) due to the simulated unmodelled acceleration.

Figure 4. Test results based on using the DR-KF for outlier detection; blue dash line represents the displacement due to unmodeled acceleration; cyan circles correspond to outliers identified by hypothesis test; red squares denote the identified outliers using thresholding technique.
As shown in this figure, several unmodelled accelerations were identified by the hypothesis test, which confirmed that the magnitude of the unmodelled acceleration detected was around 20 cm. It can also be concluded that the unmodelled acceleration was mainly due to the inaccurate prediction of SL; that was simulated during mis-trained SL modelling.
In addition to the hypothesis testing to identify outliers in SL, the experimental studies showed that the peak points of the unmodelled acceleration were likely to represent the location of the outliers. If the variation of the unmodelled acceleration is bigger than the pre-defined threshold, ±0·05 m (1-sigma), the points are considered outliers, marked with red-square symbols in Figure 4.
The next experiment was conducted to identify artificial outliers introduced to the observations. For this purpose, several Gaussian random errors with zero mean and standard deviations of about ±0·05 m (1-sigma) for SL values, and ±5° (1-sigma) for SD values were simulated and introduced separately at random locations along the known trajectory. Note that small, simulated errors may not be detected due to the presence of the actual sensor noise/errors. Table 1 summarizes the statistics of the success rate of bias identification for the current test (test 1) and other sample data tested, which are collected from different segments of existing datasets.
These results confirm that it is feasible to detect biases in SL and SD of the magnitude specified above. The number of outliers identified by the hypothesis test, shown in Table 1 and Figure 4, is higher than the number of simulated biases. This is attributable to two factors: the level of significance, α, and the degree of freedom. The level of significance is set to 5%, because in PN application, the Type I error is more important to avoid than Type II error. The degree of freedom is limited to 1 for SL and to 3 for SD, i.e., bSL=1; bSD=3 (Moafipoor et al., Reference Moafipoor, Grejner-Brzezinska and Toth2008c). Thus, with a chosen level of significance, α=0·05, and degree of freedom, b<3, the null hypothesis, see Equations (4) and (6), establishes an upper probability point of the central χ2-distributed random variable with a wide range of rejection area. Therefore, it is reasonable to augment the hypothesis test results with a thresholding technique, which increases the reliability of identifying the presence of simulated or actual outliers. The performance comparison of the algorithm on different datasets with a different number of simulated biases as well as different levels of imposed errors showed that, on average, 85% success rate was achieved for SL, and 70% for SD. The difference in the success rate between SD and SL data is mainly caused by the fact that SL changes from one step to another as a function of the locomotion pattern, but SD does not necessarily follow this rule. Defining a threshold for determining the SD outlier observation is also more complex and requires more redundancy and environmental information, such as the reference magnetic disturbance or base map/direction data (Afzal et al., Reference Afzal, Renaudin and Lachapelle2012).
5.2. Real-World Data
Once the potential for bias detection in the DR-KF prediction/observation models was tested, the next step in the integrity monitoring procedure was to compensate the identified biases using the RBF network. These experiments were conducted in the indoor environment, where the PN system was more affected by ambient disturbances. As a result, the predicted SL and estimated SD were subjected to larger point-to-point deviations. For this test, a part of the dataset was selected, where the operator entered the building after completing the RBF training during GPS reception outdoors, when accurate user position displacements were available to approximate the non-linear dynamic model. Figure 5 shows the norm of the actual position displacement vector, and the norm of the RBF predicted displacement vector during the training phase, where an accuracy better than 1 cm was achieved. This training accuracy offers a reliable foundation for using the trained RBF network as a representation of the dynamic model for indoor experiments.

Figure 5. RBF and training procedure of user's dynamics; the position displacement is expressed as the norm of the position displacement vector.
By applying the DR-KF to the data, several outliers in SL and SD were identified. Figure 6 shows the overall trajectory and the locations along the trajectory where the outliers were detected.

Figure 6. Building floor plan and trajectory reconstruction based on DR-NKF.
The square symbols in Figure 6 represent the ground control points that were followed by the operator, which represent the reference trajectory. The DR trajectories reconstructed by KBS-SL and the calibrated magnetometer/gyro heading are plotted in green crosses.
The green circles represent the position displacements predicted by RBF network at identified outlier steps. Notice that this experiment was designed to assess the impact of undetected outliers in SL and SD, rather than represent the impact of SL prediction error or the calibrated gyro/magnetometer heading error on DR-KF trajectory reconstruction. As shown in Figure 6, the location of SD outliers (green triangles) was identified mostly around the corners, where large differences between the prediction and observation models were observed. The location of SL outliers (green squares) was located around the stairs, where the user had to change his locomotion pattern to walking up and down the stairs. Since the SD/SL outliers represent the change in the dynamic, the prediction model at the identified steps (suspected outliers) was re-evaluated using the RBF model. Next, as a corrective step, the weight of the prediction model, Q, was increased with respect to the weight of the observation model, R, so that the DR-KF states followed the RBF prediction model.
The performance of the RBF network indicates that reliable solution in predicting the position displacements is feasible, as shown in Table 2. It lists the statistics of the reconstructed trajectory using the DR-NKF results compared against the DR-KF, where a better performance of the DR-NKF can be clearly observed. The end misclosure of the resulting trajectory was less than 1·3 m with the mean (std) and maximum departures from the reference trajectory about 0·90 m (1·4 m) and 1·2 m, respectively. This performance shows a 70% of the improvement achieved by the proposed approach in the DR-KF navigation solutions.
Table 2. Statistical fit to reference trajectory of DR trajectories generated using ANN-SL predicted, and the integration of gyro and magnetometer compass heading adjusted with/without the DR-NKF module.

6. CONCLUSIONS
In order to monitor the integrity of a Dead Reckoning (DR) Personal Navigator (PN), a quality testing methodology was developed, using a two-stage Neural Kalman Filter (DR-NKF) and statistical hypothesis testing to assure accurate and continuous solution (at the acceptable level) during Global Positioning System (GPS) signal blockage. The DR navigation is implemented based on Step Length (SL)/Step Direction (SD) prediction for each step and continuous (as opposed to point-to-point) trajectory reconstruction using the DR-KF. The primary focus of the performance assessment was on the integrity of the DR-KF components, including observation and prediction models. Outliers in a two-stage Kalman Filter (KF) DR (DR-KF) are typically manifested in two forms: (1) errors in the system prediction and the associated error models, and (2) error in the observation, i.e., SL and SD, and the associated error models.
The outlier detection was accomplished using a null hypothesis testing against the alternative hypothesis. Once the null hypothesis is rejected indicating that an outlier is detected in the system dynamic or observation model, a corrective step is executed to compensate for the outlier, using the Radial Basis Function (RBF) prediction model. The performance assessment based on simulated and actual datasets, with different levels of errors, showed that 85% success rate was achieved in identification of outliers for SL and 70% for SD. The statistical analysis of the reconstructed trajectory using the DR-NKF results compared against the DR-KF showed a 70% improvement.
ACKNOWLEDGEMENTS
This research is supported by a 2004 National Geospatial-Intelligence Agency NURI project.


