


I. INTRODUCTION
The segregation of a second element to grain boundaries (GBs) can provide sought-after stabilization of nanocrystalline metals.Reference Weissmüller1–Reference Kirchheim5 In addition to slowing GB migration kinetics, segregated atoms can perform a primary stabilization function by lowering GB energy, γ. For example, in a dilute solution:
 $${\rm{\gamma }} = {\rm{\gamma }}_0 - \Gamma (\Delta H^{{\rm{seg}}} - kT{\rm{log}}[X])\quad ,$$
where γ0 is the GB energy of the pure (solvent) material, Γ is the solute excess at the GB, ΔH seg is the enthalpy of segregation, and kTlog[X] is the entropic penalty of segregation with kT the thermal energy and X the global solute content.
The enthalpy of grain boundary segregation (ΔH seg) has been measured or calculated via simulation for only a few systems (Table I), and most often in systems where grain boundary segregation is considered undesirable (i.e., causing GB embrittlement). Conversely, for nanostructure stabilization, segregating alloying additions are specifically desirable, and the important open design question is which elements are best suited to segregate and stabilize the GBs via Eq. (1). In most existing studies of nanostructure stability, the selection of an appropriate alloying element has been based on empirical considerations believed (or assumed) to correlate with GB segregation, including size mismatch,Reference Weissmüller, Krauss, Haubold, Birringer and Gleiter16–Reference Atwater, Bahmanpour, Scattergood and Koch20 low bulk solubilityReference Chen and Mao17,Reference Darling, VanLeeuwen, Koch and Scattergood18,Reference Choi, da Silva, Klement, Al-Kassab and Kirchheim21–Reference Talin, Marquis, Goods, Kelly and Miller25 , or cohesive energy.Reference Liu15,Reference Pellicer, Varea, Sivaraman, Pane, Surinach, Dolors Baro, Nogues, Nelson and Sort26,Reference Abe, Holzer, Johnson, Briant, Clark and Dahmen27 However, some of the more successful experimental systems with stabilized nanostructures have relatively modest values of ΔH seg, including Ni–W (ΔH seg ∼10 kJ/mol)Reference Detor and Schuh8,Reference Detor and Schuh28 and Pd–Zr (ΔH seg ∼31 kJ/mol).Reference VanLeeuwen, Darling, Koch, Scattergood and Butler29 Regardless of the value of ΔH seg, there is often another problem with the nanostructural stability—precipitation of a second phase, which disrupts the segregation state necessary for stability and thus triggers grain coarsening.Reference Liu15,Reference Weissmüller, Krauss, Haubold, Birringer and Gleiter16,Reference Choi, da Silva, Klement, Al-Kassab and Kirchheim21,Reference da Silva, Wille, Klement, Choi and Al-Kassab30–Reference Bryden and Ying36
TABLE I. Quantitative comparison of grain boundary segregation energies estimated by the present model and reported based on experiments and simulations in the literature (Positive values denote a propensity for GB segregation).

It has been a goal of our recent work to identify GB segregation states in nanostructured materials that are formally stable, i.e., not only do they lower GB energy and resist grain growth but simultaneously oppose second phase precipitation. We have employed a thermodynamic modelReference Trelewicz and Schuh37 for a regular nanocrystalline solution (RNS) that incorporates GB segregation.Reference Chookajorn, Murdoch and Schuh38,Reference Murdoch and Schuh39 This model describes both grain and grain boundary regions within the nanocrystalline structure and examines the contributions of GB solute segregation to the free energy, while still offering a view of bulk phase separation as a competing condition. In some cases, there exists a segregation state where the excess grain boundary energy can be reduced to zero due to GB segregation, and thus nanocrystalline systems stable with respect to grain growth are possible. In a smaller subset of these cases, the GB-segregated nanocrystalline arrangement is stable against phase separation as well.
A key output of our prior work described above is a preliminary understanding of the characteristic system parameters that favor stable nanostructured systems. For thousands of given sets of parameters defining various binary systems, the effect of GB segregation and grain size on the free energy across a full global composition range was explored and assessed according to the stability criteria.Reference Murdoch and Schuh39 The significant parameters in the RNS model can be directly related to two enthalpies—the bulk crystalline interaction parameter, ωc, is proportional to ΔH mix, whereas the pure interfacial energies (γA and γB), ωc, and the GB interaction parameter (ωgb), contribute directly to ΔH seg. The full segregation enthalpy from the RNS equilibrium conditionReference Trelewicz and Schuh37,Reference Murdoch and Schuh39 includes composition and grain size dependencies in addition to the material parameters of ωgb, etc. Simplifying this relation to the dilute limit (denoted by subscript 0), we distill the segregation enthalpy to its essential characteristic parameters:
 $$\Delta H_0^{{\rm{seg}}} = z\left[ {{\rm{\omega }}_{\rm c} - {{{\rm{\omega }}_{\rm gb} } \over 2} - {{{\rm{\Omega }}_{\rm{B}} \gamma _{\rm{B}} - {\rm{\Omega }}_{\rm{A}} {\rm{\gamma }}_{\rm{A}} } \over {2zt}}} \right]\quad .$$
The behavior of a material system is thus defined by the parameters embodied in the mixing and dilute segregation enthalpies.
For positive enthalpy of mixing systems, our results suggest that, at a constant reduced temperature (fraction of the critical temperature, T cr = ΔH mix/2R, representing the apex of the miscibility gap with ΔH mix the heat of mixing and R the gas constant), stability can be attained when the following inequality is satisfiedReference Murdoch and Schuh39:
 $${{\Delta H_0^{{\rm{seg}}} } \over {\left( {\Delta H^{{\rm{mix}}} } \right)^a }} > c\quad ,$$
where a and c are temperature dependent constants which we have empirically established through a series of numerical calculations.
As Eq. (3) suggests, we have concluded that the absolute magnitude of the GB segregation enthalpy is not as important as its relation to mixing enthalpy; the two halves of this problem (bulk mixing and GB segregation) must both be considered together to arrive at a reasonably predictive design methodology. Therefore, a strong estimate of the GB segregation enthalpy is necessary, and yet, as noted above, this quantity is not well known for most binary systems.
As in the Fowler–Guggenheim (F–G) segregation form, solute–solute interactions in the grain boundary are explicitly included through the use of a separate GB interaction parameter. In F–G, this GB interaction is usually quantified for a material system by fitting experimental dataReference Lejcek11,Reference Lejcek and Hofmann40 —it is not a known parameter. Similarly, while other RNS model parameters are more readily linked to material properties, the GB interactions codified by ωgb are unknown a priori. As we are seeking to use Eq. (3) and its attendant methodReference Murdoch and Schuh39 in a predictive capacity, we therefore seek a predictive model for GB segregation. Additionally, a direct analog to Eq. (2) is what is necessary to use the relation of Eq. (3) for predicting stable nanocrystalline alloys.
We discussed this issue briefly in a recent short reportReference Chookajorn, Murdoch and Schuh38 and provided an approximation for  $\Delta H_0^{{\rm{seg}}}$ that allowed us to approach the binary alloy design problem in one specific system (W-based alloys). It is our purpose in this article to expand upon the ideas in that preliminary report and discuss their broader applicability to binary metallic systems in general. In what follows, we first examine previous descriptions of interfacial segregation enthalpy, en route to presenting a new, simple analytical model for GB segregation. This model, although still an analytical approximation for the very complex problem of GB segregation, permits progress on the design of stable nanocrystalline alloys.
II. MODELING OF GB SEGREGATION
A. Prior segregation models
Among all the possible binary metal pairs that may be of interest in designing nanostructured materials, very few experimental measurements or atomistic modeling predictions of GB segregation enthalpies exist. In fact, literature values of these quantities are presented in Table I, and the systems represented comprise less than 1% of those that are possible. General models to predict the propensity for grain boundary segregation include those of Hondros and Seah,Reference Hondros and Seah41,Reference Seah42 McLean,Reference McLean43 Wynblatt and Ku,Reference Wynblatt and Chatain44 and Darling et al.Reference Darling, VanLeeuwen, Semones, Koch, Scattergood, Kecskes and Mathaudhu45 These are briefly detailed in what follows:
(i) Hondros and Seah used experimental segregation data predominantly for impurities in steel to create a rough estimate of the enthalpy of segregation that is directly correlated to the bulk solute solubility, X sol, of the alloy system:
(4)This correlation is strictly empirical and based on a very limited range of alloys. The physical validity of bulk solubility as an indicator of GB segregation is also questionable,Reference Briant46 as X sol is derived from bulk phase equilibria considerations and does not speak to the energetics of GBs—this segregation enthalpy essentially relies entirely on mixing enthalpy. $$\Delta H_{{\rm{H}}-{\rm{S}}}^{{\rm{seg}}} = RT{\rm{log}}\left[ {X_{{\rm{sol}}} } \right] - 10 \pm 6\,\rm kJ/mol\quad {\rm{.}}$$
(ii) McLean developed a model for the case where elastic energy is the driving force for solute segregation to the grain boundary, i.e., where GB segregation occurs only to relieve size mismatch strain energy. The elastic strain energy change can be written using an Eshelby-type continuum linear elastic formalism to describe the energy change of substituting a solute atom for a solvent atom in the matrix.Reference Friedel47 McLean further assumed this elastic enthalpy to be fully released by GB solute segregation:
(5)Here, the solute is denoted by subscript B and solvent by subscript A; K is bulk modulus, G is shear modulus, r is the atomic radius. This term is always positive, which means it will predict that a solute will segregate to the grain boundary in all cases.$$\Delta H_{\rm el}^{{\rm{seg}}} = \Delta E_{\rm el} = {{24{\rm{\pi }}K_{\rm{A}} G_{\rm{B}} r_{\rm{B}} r_{\rm{A}} (r_{\rm{B}} - r_{\rm{A}} )^2 } \over {3K_{\rm{A}} r_{\rm{A}} + 4G_{\rm{B}} r_{\rm{B}} }}\quad .$$(iii) The Wynblatt–Ku model for surface segregation combines both the elastic mismatch with chemical and interfacial energy contributions; the difference in interfacial energies, γS, and the area per mole of the interface,
$\sigma = N_{{\rm{avg}}} V_{\rm{B}}^{{2 \mathord{\left/ {\vphantom {2 3}} \right. \kern-\nulldelimiterspace} 3}} $ is described by the first term of Eq. (6):(6)whereas the second term describes the chemical interactions, where ωc is the bulk crystalline interatomic interaction parameter and z, the total coordination number of the system, is split into in-plane, z 1, and out of plane, z v, coordinations through the following relation, z = z 1 + 2z v. It has been suggested that the elastic term needs no modification to be used in both surface and grain boundary segregation,Reference Wynblatt and Shi48 provided that the original complete-relaxation assumption of McLean is deemed acceptable. However, Darling et al. suggested a modifying parameter, α, to the chemical and interfacial terms to account for the difference between free surfaces and grain boundaries. Specifically, α is the ratio between interfacial and surface strengths (taken in their work as 5/6 to reflect the assumption of γ ≈ 1/3γS)Reference Darling, VanLeeuwen, Koch and Scattergood18, and their adaptation of Eq. (6) is writtenReference Darling, VanLeeuwen, Semones, Koch, Scattergood, Kecskes and Mathaudhu45:$$\Delta H_{{\rm{W}}-{\rm{K}}}^{{\rm{seg}}} = \;\left( {{\rm{\gamma }}_{\rm{B}}^{\rm{S}} - {\rm{\gamma }}_{\rm{A}}^{\rm{S}} } \right)\sigma + 2{\rm{\omega }}_{\rm{c}} \left[ {z^{\rm{l}} \left( {x - x^{\rm{s}} } \right) + z^{\rm{v}} \left( {x - {1 \over 2}} \right)} \right] - \Delta E_{{\rm{el}}} \quad ,$$(7)Darling et al. showed that this approach is useful for comparing the segregation efficacy of possible solute choices at a fixed composition. However, it is not suitable for our purposes of modeling nanostructure stability because it does not give a segregation enthalpy independent of grain boundary solute content nor can it be taken to the dilute limit to arrive at a dilute$$\Delta H_{\rm{D}}^{{\rm{seg}}} = \;\left( {{\rm{\gamma }}_{\rm{B}}^{\rm{S}} - {\rm{\gamma }}_{\rm{A}}^{\rm{S}} } \right)\left( {1 - {\rm{\alpha }}} \right){\rm{\sigma }} - {{8\Delta H_{{\rm{mix}}} } \over z}\left[ {z^{\rm{l}} \left( {x^{\rm{s}} - x} \right) - z^{\rm{v}} \left( {x - {1 \over 2}} \right) + z^{\rm v} {\rm{\alpha }}\left( {x^{\rm{s}} - {1 \over 2}} \right) } \right] - \Delta E_{{\rm{el}}} \quad .$$$\Delta H_0^{\rm seg}$ for, e.g., use with Eq. (3).


B. Miedema-based grain boundary segregation model
What is broadly needed in order to predict and design stable nanocrystalline alloys, i.e., in order to use Eq. (3) and the associated analytical apparatus of our prior work,Reference Chookajorn, Murdoch and Schuh38,Reference Murdoch and Schuh39 is a means of screening many alloy combinations in the two variables ΔH mix and  $\Delta H_0^{{\rm{seg}}}$. Each of these parameters can be calculated to great precision using, e.g., atomistic methods. For GB segregation, for example, segregation enthalpies for solutes at specific boundaries,Reference Udler and Seidman49–Reference Duparc, Larere, Lezzar, Khalfallah and Paidar52 or even average quantities for ensembles of many boundaries,Reference Purohit, Jang, Irving, Padgett, Scattergood and Brenner7,Reference Alber, Müllejans and Rühle12,Reference Purohit, Sun, Irving, Scattergood and Brenner53 can be calculated. Clearly for specific systems of interest this is the most rigorous approach available at present. However, progress on the broader design problem requires that we make decisions about what systems to pursue in the absence of such rigorous data. We require a more exhaustive set of values for $\Delta H_0^{{\rm{seg}}}$, and the paucity of available data is such that accuracy can be compromised in the spirit of rapid screening. This situation is reminiscent of the earlier one in bulk alloy theory, where the semiempirical model of Miedema provided a quick reasonably accurate description of alloy thermodynamic parameters to allow good estimations without the need for lengthy calculations.Reference Bakker54,Reference de Boer, Boom, Mattens, Miedema and Niessen55 For many systems, Miedema estimates of, e.g., ΔH mix and compound formation energies are still sufficiently accurate to be widely used for design and analysis. For solid solutions, the Miedema enthalpy of mixing is writtenReference Bakker54,Reference de Boer, Boom, Mattens, Miedema and Niessen55 :
 $$\Delta H_{{\rm{s}}{\rm{.s}}{\rm{.}}}^{{\rm{mix}}} = \;\left[ {c_{\rm{A}} c_{\rm{B}} (c_{\rm{B}}^{\rm{s}} \Delta H_{{\rm{AinB}}}^{{\rm{int}}} + c_{\rm{A}}^{\rm{s}} \Delta H_{{\rm{BinA}}}^{{\rm{int}}} )} \right]_{{\rm{chemical}}} + \left[ {c_{\rm{A}} c_{\rm{B}} (c_{\rm{B}} \Delta H_{{\rm{AinB}}}^{{\rm{elastic}}} + c_{\rm{A}} \Delta H_{{\rm{BinA}}}^{{\rm{elastic}}} )} \right]_{{\rm{elastic}}} + \Delta H_{{\rm{s}}{\rm{.s}}{\rm{.}}}^{{\rm{structural}}} \quad ,$$
where c A and c B are the compositions of the solute and the solvent and  $c_{\rm{A}}^{\rm{s}}$ and $c_{\rm{B}}^{\rm{s}}$ are effective fractions of the surface of A atoms in contact with B atoms and vice versa. This describes the difference in interaction between a B atom surrounded by A atoms, and one surrounded by some mixture of A and B atoms, dictated by composition. Chemical interactions are captured by the terms of form $\Delta H_{{\rm{BinA}}}^{{\rm{int}}}$, which describe, e.g., the enthalpy of a B atom completely surrounded by A atoms.
Inspired by the prior success of the Miedema model for bulk thermodynamics, we have adopted the same approach for rapidly tabulating GB segregration enthalpies. In a similar spirit to the Wynblatt–Ku adaptation of surface segregation to the case of GBs reviewed above,Reference Wynblatt and Chatain44,Reference Darling, VanLeeuwen, Semones, Koch, Scattergood, Kecskes and Mathaudhu45 we adapt Miedema’s model for surface segregationReference Bakker54–Reference Miedema56 to the grain boundary environment. Miedema’s model for dilute surface segregationReference Miedema56 includes both a chemical interaction enthalpy,  $\Delta H_{{\rm{BinA}}}^{{\rm{int}}}$, and interfacial energy terms which together describe the chemical and interfacial driving forces for segregation that are mirrored in the previously discussed models for segregation:
 $$\Delta H_{{\rm{0,Mied}}}^{{\rm{seg}}} = \;0.71 \times {1 \over 3} \times \left[ { - \Delta H_{{\rm{BinA}}}^{{\rm{int}}} - c_0 {\rm{\gamma }}_{\rm{A}}^{\rm{S}} V_{\rm{A}}^{2/3} + c_0 {\rm{\gamma }}_{\rm{B}}^{\rm{S}} V_{\rm{B}}^{2/3} } \right]\quad ,$$
the term c 0γSV 2/3 is the surface enthalpy of a pure metal as defined by Miedema, where c 0 = 4.5 × 10⁸ is a dimensionless semiempirical constant, V is the atomic volume, and γS is the surface energy of the pure subscripted component. The coefficient  ${\textstyle{1 \over 3}}$ captures the change in coordination at the surface; when the segregant B atom is at the surface rather than in the bulk, it has gone from being surrounded by A atoms to being only two-thirds in contact. With this fractional contact, one-third of the interaction energy ( ${\textstyle{1 \over 3}}\Delta H_{{\rm{BinA}}}^{{\rm{int}}}$) and one-third of the surface ( ${\textstyle{1 \over 3}}c_0 {\rm{\gamma }}_{\rm{A}}^{\rm{S}} V_{\rm{A}}^{2/3}$) is lost, but one-third of the new surface is now B ( $+ {\textstyle{1 \over 3}}c_0 {\rm{\gamma }}_{\rm{B}}^{\rm{S}} V_{\rm{B}}^{2/3}$). The coefficient 0.71, calibrated by Miedema,Reference Miedema56 describes the surface relaxation due to surface electron density distribution and surface geometry, which reduces the exposed surface area.
In the case of a grain boundary, the basic approach of Miedema as captured in Eq. (9) remains valid but requires some corrections. A first correction pertains to the coordination of atoms at GBs, which led to the coefficient of 1/3 in Eq. (9). As formulated by Trelewicz, the RNS model for nanocrystalline alloys involves an accounting of bonds in the bulk, in the grain boundary region, and “transition” bonds that connect those two regions. An atom relocated from bulk to boundary would lose one-third of its bulk contact, as before, but would be coordinated by other atoms in the adjoining grain. Only a fraction of those bonds defined by Trelewicz as ν (and assigned a value of 1/2 applicable for almost all grain sizes) would therefore be lost.Reference Trelewicz and Schuh37 A second correction is to introduce the elastic term, Eq. (5), to account for the elastic strain effects that contribute to segregation, which are missing from Miedema’s model. With these modifications, we arrive at the following model for the dilute grain boundary segregation enthalpy:
 $$\Delta H_{0,{\rm{M}}}^{{\rm{seg}}} = \;- 0.71 \times {1 \over 3} \times \nu \times \left[ { - \Delta H_{{\rm{BinA}}}^{{\rm{int}}} - c_0 {\rm{\gamma }}_{\rm{A}}^{\rm{S}} V_{\rm{A}}^{{2 \mathord{\left/ {\vphantom {2 3}} \right. \kern-\nulldelimiterspace} 3}} + c_0 {\rm{\gamma }}_{\rm{B}}^{\rm{S}} V_{\rm{B}}^{{2 \mathord{\left/ {\vphantom {2 3}} \right. \kern-\nulldelimiterspace} 3}} } \right] + \Delta E_{\rm el} \quad .$$
Note that the sign convention in Eq. (10) is reversed from that of the original Miedema model in Eq. (9), to match the convention of the RNS model, where a positive value of segregation enthalpy denotes propensity for grain boundary segregation. Equation (10) requires no temperature and composition assumptions, contains readily available material data, and describes dilute segregation—all the requirements outlined earlier as needed for predicting nanocrystalline alloy stability.
III. GRAIN BOUNDARY SEGREGATION CALCULATIONS
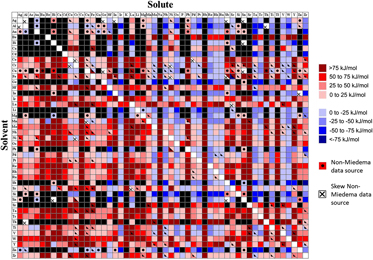
The dilute GB segregation enthalpy was calculated using Eq. (10) for approximately 2500 binary alloys, where data were available. The first pass calculation for all alloys was using the readily available Miedema terms.Reference Bakker54,Reference de Boer, Boom, Mattens, Miedema and Niessen55 The resulting segregation energy is denoted in Fig. 1 by a solid color—red for GB-segregating solutes and blue for antisegregating (i.e., the GB will be enriched by solvent, with the solute preferring the grain interior), scaled by strength. Whenever possible, we validated Miedema’s prediction for the chemical interaction term through comparison with other sources of thermodynamic data. Additionally, when a Miedema calculation of  $\Delta H_{{\rm{BinA}}}^{{\rm{int}}}$ was not available for a particular binary system, or did not physically match the most basic expectations for the material system (e.g., predicted a strongly negative interaction for a system with no known ordered compounds), only other sources of data were used and are presented in Fig. 1. Calculations with secondary sources are indicated in the figure by a dot. If both Miedema values and secondary sources were used to make the calculation, the square is bisected with the upper solid half representing Miedema values and the lower half showing the output based on secondary sources. A fully blacked-out square indicates that we did not find suitable data to make the calculation.

FIG. 1. Segregation enthalpies for binary systems. Red scale (positive values) represents tendency of the solute to segregate to the grain boundary. Blue scale describes antisegregation (depletion of solute in grain boundary). Black indicates lack of data for the calculation. A dot indicates non-Miedema data sources, whereas an “x” indicates that these sources could not be used for the segregation calculation.
The most common source of secondary data is a Redlich–Kister–Muggianu (RKM) style model for a solid solution used for CALPHAD phase diagram calculationsReference Redlich and Kister57:
 $$\Delta H_{{\rm{RKM}}}^{{\rm{mix}}} = X_i X_j \sum _v L_v^{ij} \left( {X_i - X_j } \right)^v \quad ,$$
with X i and X j the components of the binary system and L v the vth fitted binary interaction parameter in the expansion. This is a full enthalpy of mixing, fitted to experimental data, thus necessarily encompassing all contributions to enthalpy, i.e., chemical and elastic. To extract the  $\Delta H_{{\rm{BinA}}}^{{\rm{int}}}$ term necessary for the segregation calculation of Eq. (10) from an RKM model, it is set equal to the Miedema mixing enthalpy model, Eq. (8). The critical temperature, T cr, which is necessary for the application of the predictive enthalpy relation, Eq. (3), must also be calculated. In a symmetric regular solution, the top of the miscibility gap simply equals ΔH mix/2R; for RKM models, asymmetry and/or temperature dependencies in the coefficients require a more elaborate method to calculate T cr by examining the free energy as a function of temperature. In some cases, the RKM fit results in a highly skewed, unreasonable temperature-dependent enthalpy. In these cases, our ability to extract a comparable chemical interaction term for use in Eq. (10) is questionable; an “x” indicates such systems in Fig. 1. The numerical results of these calculations are in the Supplemental Material.
The results in Fig. 1 are interesting for their potential use in screening systems for stable nanocrystalline states, and we will turn our attention to this issue in the next section. However, it is first interesting to examine some features of the data set.
Knowing that both bulk alloy and grain boundary thermodynamics are derived from the same chemical interactions among the alloy species, one might expect that ΔH mix and  $\Delta H_{{\rm{0,M}}}^{{\rm{seg}}}$ would be correlated in some way. And while these parameters are formally independent, it is interesting to examine the space of calculated outputs for the ∼2500 alloys considered in this study. Figure 2 shows a survey of the two quantities in relation to one another for the alloys explored here. We note that the design space is quite thoroughly covered by these alloy pairs. This result supports the criticism of the empirical Hondros–Seah relation of Eq. (4), which attempts to estimate GB segregation enthalpy based only on bulk thermodynamics; Fig. 2 shows that one does not correlate well with the other. Additionally, our design space covers negative, or antisegregating, values of segregation enthalpy, which the Hondros–Seah and McLean models cannot.


The departure of our model from prior approaches can be more easily visualized in Fig. 3, where our predicted values of  $\Delta H_{{\rm{0,M}}}^{{\rm{seg}}}$ are compared with those predicted by the Hondros–Seah equation [Eq. (4)] and the McLean elastic-only model [Eq. (5)] (Direct comparisons are not possible to the Wynblatt–Ku and Darling models without making assumptions about GB solute concentration.). Several features are of interest in this figure. First, as expected, there is no correlation between our segregation enthalpy model and the solubility-based model of Hondros and Seah (Fig. 3). Because the elastic enthalpy is a component of our model, there is a positive correlation between $\Delta H_{{\rm{0,M}}}^{{\rm{seg}}}$ and $\Delta H_{\rm el}^{{\rm{seg}}}$, but it is a sufficiently weak correlation to be of limited practical use. The chemical and interfacial components included here are quantitatively as important as the elastic mismatch for grain boundary segregation.

FIG. 3. A comparison of our segregation model,  $\Delta H_{{\rm{0,M}}}^{{\rm{seg}}}$, with the Hondros–Seah model ( $\Delta H_{{\rm{H}}-{\rm{S}}}^{{\rm{seg}}}$) and elastic-only enthalpy ( $\Delta H_{\rm el}^{{\rm{seg}}}$).
Second, in both cases, the present Miedema model  $\Delta H_{{\rm{0,M}}}^{{\rm{seg}}}$ predicts cases where an alloy would be antisegregating (negative values), where $\Delta H_{{\rm{H}}-{\rm{S}}}^{{\rm{seg}}}$ and $\Delta H_{\rm el}^{{\rm{seg}}}$ are only able to return positive values. The number of negative values in Figs. 1 and 2 suggests that such cases may be common and could therefore be of practical importance. For example, in the Cu–Ni system, atomistic modeling shows depletion of nickel at the GBs compared to the bulkReference Foiles6 with a segregation energy of −7 kJ/mol. This matches extremely well with the present estimation of $\Delta H_{{\rm{0,M}}}^{{\rm{seg}}}$ = −8 kJ/mol, but diverges substantially from the elastic enthalpy prediction, $\Delta H_{\rm el}^{{\rm{seg}}}$, which is very low but still positive at 0.6 kJ/mol, and the Hondros–Seah prediction of 21–33 kJ.
As noted in Sec. I, the number of quantitative measurements of ΔH seg based on experiment or computational modeling is few, but a comparison of the present predictions with available measurements is included in Table I. It should be noted that Eq. (10) is a dilute-limit segregation enthalpy, which complicates the comparison to systems at nondilute concentrations. Nonetheless, the general agreement between Eq. (10) and the available independent measurements is reasonable. In about half of the cases, the values are a close match to one another. The other half ranges from reasonable (e.g., within a factor of two) to poor matches. Some of the most conspicuous disagreements include systems like Fe–Sn, Ni–In, and Co–Sb, which involve elements outside of the central transition metal block, for which electronic and structure effects may be more complex than are adequately handled by the Miedema approach.
IV. NANOCRYSTALLINE ALLOY SCREENING
Our goal is to make predictions about the ability of a binary alloy system to support a nanocrystalline state through solute-stabilized GBs. The two quantities of Eq. (2) comprise the axes of an alloy screening space, upon which we can define a stability map. We presented the construction of these maps in Refs. Reference Chookajorn, Murdoch and Schuh38 and Reference Murdoch and Schuh39, and here we take the additional step of quantitatively placing alloy systems on the maps. For simplicity, the discussion here is limited to systems with positive heats of mixing and GB segregation, which matches our prior developments in Ref. Reference Murdoch and Schuh39. We use the results of our segregation model combined with data sources for ΔH mix, as presented in Fig. 4 for five reduced temperatures.

FIG. 4. Nanocrystalline Stability Maps for five fractional temperatures, with delineated regions of nanocrystalline stability (green, top), metastability (yellow, middle), and no stability (red, bottom). Alloys are represented by a symbol describing the solvent and a text label describing the solute.
In these maps, the lowest red region represents the enthalpy-space in which no stable nanocrystalline states are supported. In this region, the system ground state is a coarse-grained structure with phases given by the bulk phase diagram. This is also the ground state in the middle yellow region, but in this space, there exist nanocrystalline states that are stable against grain growth but not against phase separation. The top green regions of each map describe the design space in which nanocrystalline states exist with complete stability. A given base element solvent is assigned a specific symbol, and the solute element is labeled on the map next to the symbol. For example, copper-based alloys are indicated by a solid blue circle; the Cu–Ag alloy specifically is represented by this blue circle, labeled by “Ag.”
Only Miedema sources of chemical interaction data are presented in this figure for simplicity, with the exception of a handful of alloys we wish to highlight to connect with systems in which nanocrystalline stability has been experimentally evaluated. These alloys are listed in Table II and indicated on the maps in Fig. 4 by larger labels, and are both in italics and underlined if their calculation used sources alternate to Miedema’s tables of  $\Delta H_{{\rm{BinA}}}^{{\rm{int}}}$. Table II is arranged according to the degree of predicted stability. The segregation model predicts a stable nanostructured state in W–Ti (for details, see Ref. Reference Chookajorn, Murdoch and Schuh38); metastable for W–Cu, Fe–Ag, Fe–Cu, Cu–Bi, and Cu–Pb; and not stable for Cu–Ag, Ag–Cu, Al–Pb, Au–Ni, and Ni–Cu. In the metastable cases, the thermodynamically stable phase is a coarse-grained phase-separated structure, but appropriate segregation opposes the driving force for grain growth. For example, in a solid solution nanocrystalline W–Cu alloy, the nanostructure is retained after annealing at 673 K for one hour, but subsequent annealing triggers phase separation, leading to rampant grain growth.Reference Moon, Ryu, Kim, Won and Jang58 For Fe–Ag,Reference Liu15,Reference Liu62 the Ag-rich phase precipitated at 673 K after one hour and also at room temperature after four weeks, showing that the equilibrium phases are indeed dictated by the bulk miscibility gap. Minimal grain growth was reported before bulk phase separation in Fe–Cu,Reference Eckert, Holzer and Johnson34 after which the grains grew rapidly. In the Cu–Bi system, thermal stability is improved dramatically relative to pure nc-CuReference Chen and Mao17 and grains grew after annealing above 433 K.
TABLE II. Nanocrystalline alloys (ΔH mix > 0) whose thermal stability has been tested, and the predicted stability according to Eq. (3). As the coefficients in Eq. (3) have only thus far been calculated for several fractional temperatures, the nearest temperature to experimental values is selected and presented here. Using the figure of merit for the fractional temperature, the nanocrystalline stability of the alloy is predicted, reported through the color of the segregation enthalpy column; the stable alloy is green, metastable are yellow, and unstable are red.

For an example unstable case, that of Cu–Ag, phase separation and rampant grain growth were observed experimentally in an initially nanocrystalline solid solution,Reference Zhu, Wu, Zeng, Ouyang and Gao60 and atomistic modeling concluded that silver was not sufficient to significantly lower the energy of the GBs.Reference Mayr and Bedorf59 For an Al–Pb alloy, two phases were still present even after extensive mechanical alloying to a nanostructured stateReference Bakker54; modeling showed that Pb segregated to the GBs and then formed clusters.Reference Purohit, Sun, Irving, Scattergood and Brenner53 The local enthalpy at the GBs was significantly lowered by the placement of Pb atoms of GB sites; however, this atom placement raised the global enthalpy substantially, indicating a nonequilibrated state.Reference Purohit, Sun, Irving, Scattergood and Brenner53 Annealing of nanocrystalline Au–Ni for one hour at 673 K resulted in complete phase separationReference Rouya, Stafford, Bertocci, Mallett, Schad, Begley, Kelly, Reed and Zangari35; phase separation was also observed at 473 K, but not completed within one hour. A Cu-rich phase precipitated from a nanocrystalline Ni–Cu alloy when annealing temperatures exceeded 525 K—after three hours at 575 K, the material was 15% Cu phase.Reference Pellicer, Varea, Pane, Nelson, Menendez, Estrader, Surinach, Baro, Nogues and Sort63
These observations thus qualitatively align with the predictions of the model. Although it is very difficult to determine true metastability or instability from the experimental studies, the general agreement is encouraging. It is noteworthy that this agreement is better than can be attained using prior methods for estimating ΔH seg. These methods routinely overpredict segregation enthalpy and would therefore expect stability in the majority of the experimental alloys described above.
V. CONCLUSIONS
We have presented a model with which the dilute-limit grain boundary segregation enthalpy can be estimated in metal alloy pairs. The approach can be used in conjunction with nanocrystalline stability maps to predict the nanocrystalline stability of hundreds of binary alloys. This segregation model is built upon Miedema’s model for surface segregation, adapted to the GB environment. Although not presenting a detailed picture of GB segregation, it allows for quick calculations across a large range of alloys; this, in turn, enables a broad population of the stable nanocrystalline design space. Predictions of stability in existing experimentally studied systems are briefly evaluated, with good agreement.
ACKNOWLEDGMENTS
This research was supported primarily by the U.S. Army Research Office under contract W911NF-09-1-0422, with partial additional support from the Solid State Solar Thermal Energy Conversion (S3TEC), an Energy Frontier Research Center funded by the U.S. Department of Energy, Office of Science, Office of Basic Energy Sciences under DE-SC0001299.


