


Introduction
The thermoluminescence of ice was first noted by Reference Grossweiner and MathesonGrossweiner and Matheson (1952) who irradiated argificially frozen ice with X-rays and measured a glow-curve. Later it was discovered that pressure had marked effects upon the glow-curves of argificially irradiated limestone samples (Reference Zeller and FaulZeller, 1954). By working on limestones (Reference ZellerZeller and others, 1955; Reference AnginoAngino, 1959) it was found that pressure, crystallization and shearing effects could produce thermoluminescence in samples which were previously drained or in precipitates formed in total darkness and without subsequent exposure to high energy radiation.
The complex nature of the thermoluminescence phenomenon in rocks and its dependence upon mineral composition, impurity content, age, radiation, thermal and pressure history causes much difficulty in the interpretation of the data obtained from glow-curve measurements. Ice, on the other hand, offers some major advantages in that many of these complicating factors are confined within very narrow limits. Natural ice is much more limited than rock in the range of variation in composition and physical and chemical history. In view of this fact, an investigation was undertaken to determine whether systematic variations in the glow-curvesof natural ice could be found which would bear a direct relation to known conditions of crystallization and stress history.
Experimental Procedure
The apparatus used for these measurements was modified from equipment normally used for measuring mineral thermoluminescence. This equipment has been described in detail by other workers (Reference DanielsDaniels and others, 1949; Reference HoutermansHoutermans and others, 1957; Reference AnginoAngino, 1959) and can be very much simplified for making glow-curve measurements of ice. The measurements were made by using a multiplier type phototube (RCA 6810 A) which was mounted in a light-tight box directly over the sample. A standard 2,500 V. regulated power supply furnished the required voltage for the phototube. The output of the tube was amplified by a d.c. current amplifier and the resultant signal recorded by a 10 mV. recorder. The heating rate was controlled only indirectly by passing a stream of air over the sample. Indirect control of this type is adequate because of the relatively small range of temperature through which the sample emits thermoluminescence. Increased uniformity in heating was also attained through the use of a copper block which served as a heat sink and upon which the metal cup containing the sample was placed. This heat sink together with the air flowing over the sample provided a uniform temperature rise from liquid air temperature to about −140° C. Above this temperature the rate of rise was significantly slowed and above about −40° C. thermoluminescence of ice irradiated by ultraviolet is undetectable.
The source of radiation used to activate the samples studied was a high-pressure mercury arc lamp with a quartz envelope. No attempt was made to restrict the radiation to any specific wave-length through the use of filters. Irradiation periods of the order of a few minutes were adequate to produce substantial amounts of thermoluminescence in the samples. Irradiations were carried out both with and without direct contact between the liquid air and the ice samples. No significant difference could be observed in the general shape of the glow-curves of samples which had been totally immersed in liquid air as compared to those which were irradiated “dry” in cups floating in a liquid air bath. Some difficulty was found in making the transfer from the liquid air bath to the heating chamber rapidly enough to prevent the Ioss of part of the lowest temperature peak in the “dry” samples. For this reason irradiations were normally carried out with the sample partially immersed in liquid air and the sample cup was transferred to the heating chamber with a small amount of liquid air remaining in it. This method provided the maximum convenience and yielded the most consistent results. Sample sizes varied somewhat but an attempt was made to hold these to about 15 g. It was found that extreme care was necessary in controlling the radiation dosages and the time for which the sample was held at liquid air temperature after irradiation. All of the samples studied were irradiated for two minutes and allowed to stand for two minutes. Except for the unconsolidated snow and firn, all of the samples were broken into 3 to 5 pieces which could be fitted into the sample cup. It was feared the grinding might influence the thermoluminescence characteristics of the samples. These effects were tested by crushing several samples to chips smaller than 5 mm. Except for the expected decrease in the absolute amount of thermoluminescence due to light scattering, there was no significant difference in the observed peak ratio. The short duration stresses produced by sharp blows do not appear to affect the thermoluminescence, probably because plastic deformation does not occur.
Results from Natural Ice Samples
Relative to other crystalline solids, ice has a low luminous efficiency in terms of its ability to store energy in the form of thermoluminescence. It is approximately 10,000 times less thermoluminescent than an equivalent amount of calcite subjected to an equal dosage of ultraviolet. In spite of this low emission level, glow-curves can be easily obtained and are reproduceable within the limits of sample homogeneity, size and transparency. Lack of homogeneity is always a major problem in dealing with naturally occurring material. However, this study indicated that the most significant data furnished by the glow-curves is the peak-height ratio which is essentially independent of sample size or transparency. Two peaks are normally present, a narrow peak at approximately −190° C. and a much broader peak with its maximum at about −140° C.
For purposes of comparison a series of argificially frozen ice samples were studied. A relationship was found to exist between the shape of the curve and the rate of crystal formation. Ice which was frozen as rapidly as possible by chilling water in a metal cup placed in a bath of liquid air (Fig. 1a) shows only one peak. The extremely rapid rate of freezing influenced the crystal growth resulting in the development of either a very fine crystallite or a glass type of structure. None of the other samples tested showed a total absence of the −140° C. peak.

Fig. 1. The glow-curves of the different ice samples. The temperature in degrees centigrade is plotted on the horizontal axis, the light intensity in arbitrary units on the vertical axis. Curve a: ice frozen with liquid air. Curve b: fresh snow. Curve c: snow, two months old, showing recrystallization. Curve d: frost crystals from a crevasse. Curve e: clear ice crevasse filling. Curve f: compacted firn. Curve g: glacier ice with randomly distributed air bubbles. Curve h: glacier ice with aligned air bubbles and flow structures. Curve i: glacier ice at contact with bedrock, showing shear and flow structures
A glow-curve was obtained from freshly fallen snow at Bern, Switzerland, on 23 February 1962. The snow fell during a time when the temperature was only −2 or −3° C. and the glow-curve was made as quickly as possible to prevent significant recrystallization. The glow-curve is shown in Figure 1b. The low level of the total light emitted results at least partially from the high degree of light scattering caused by the finely crystalline nature of the fresh snow. In addition, the mass of the sample was somewhat smaller than for the others owing to its Iow density. The −140° C. peak is clearly present as it is in all of the other natural samples. The ratio of the −140° C. to the −190° C. peak is lower than in any other naturally occurring ice sample.
A heavy snowfall took place on 1 January 1962 in Bern and this was followed by several periods of warm weather during which much of the snow which remained in protected places melted and recrystallized. Nearly two months after this snowfall a glow-curve was made on a sample taken from one of the piles of snow which was found in the shadow of a building. The snow had by this time much the same coarsely granulated appearance as normal firn. The resulting glow-curve (Fig. 1c) differs somewhat in form from that of the freshly fallen snow and the peak-height ratio shows a significant increase. The −140° C. peak appears as a plateau on the side of the −190° C. peak. This sample showed a much larger grain-size than the fresh snow and there is no doubt that more of the total light emitted reached the photo-multiplier because of reduced light scattering. Nevertheless, it is likely that the actual luminous efficiency of the old snow is substantially higher than that of the new snow.
Six localities within the ice tunnel through the Jungfraujoch ice cap were chosen to test the effect of pressure, flow, ageing and recrystallization upon the thermoluminescence of glacier ice. This excellent facility (Reference HaefeliHaefeli, 1961; Reference KambKamb, 1961) is connected with the Jungfraujoch sciengific station and permission to make the collections was kindly granted by the Swiss Post-Telephone-Telegraph Administration. The tunnel passes from rock in which the Jungfraujoch railway terminal is located westward into the Jungfraujoch ice cap. The tunnel provided a means of sampling ice which varies from the coarse, polycrystalline, highly compacted firn to the finely banded flow structures which can be seen in the ice at its contact with the rock. Most of the ice was collected in a lateral tunnel which ends in an open crevasse approximately 80 m. north of the axis of the main tunnel.
The first sample to be investigated in this series consisted of frost crystals found growing on the walls of the open crevasse. Footnote * These were chosen as a control since they could not have been subjected to pressure and could be expected to have a substantially lower impurity content than the glacier ice itself. The glow-curve of the frost crystals (Fig. 1d) shows a peak-height ratio larger than that of the old snow from Bern and the −140° C. peak appears more distinctly separated from the −190° C. peak. As in the case of the snow samples, the frost crystals caused significant light scattering. In view of this fact it appears that their luminous efficiency is relatively high.
The clear ice from one of the crevasse fillings was chosen as an example of material which had been crystallized under zero stress and had probably been subjected to relatively mild stress after formation. Its age is obviously younger than that of the surrounding ice and it appears to have formed through the flooding of an open crevasse. Evidence of deformation would be difficult to find in such massive fissure fillings because of their freedom from bubbles, cracks, or stragification. It seems likely, however, that massive blocks of ice of this type would act as structural units around which the relatively weaker surrounding ice would flow. The total light emission (Fig. 1e) is surprisingly small in view of the fact that such clear ice would necessarily show significantly less light scattering than finely crystalline snow and frost. The peak-height ratio is larger than that of the frost crystals, but the −190° C. peak continues to be higher than the −140° C. peak.
The next sample (Fig. 1f) was taken from the end of the tunnel in the wall of the open crevasse. This sample is here designated as compacted fine mainly because of its coarsely granular nature and the fact that its density and transparency were reduced by the presence of many air bubbles as in the case of normal firn. It did possess good structural rigidity, however, and was collected at a point about 20 m. below the surface of the ice cap. There is little doubt that ice in this location has been subjected to stress and that flow has occurred. The relatively porous nature of the ice might permit much of the flow to take place at grain boundaries, however, rather than involving the total mass of the grains. The glow-curve shows a 1:1 ratio of the two peaks and an average total light emission.
More dense ice containing few but still randomly oriented bubbles was tested. This ice occurred in a zone of somewhat higher pressure at some distance from the open crevasse and approximately 25 m. below the surface. Actual flow structure was not visible at the point where the ice was collected. The resulting glow-curve (Fig. 1g) shows an average total Iight emission but the −140° C. peak is higher than the −190° C. peak.
In the Iateral tunnel, near its junction with the main tunnel, a zone can be found which shows strong evidence of flow. The ice contains about as many bubbles as in the previously described sample, but the bubbles are aligned and definite flow lines are visible. The glow-curve (Fig. 1h) indicates a sharp rise in the −140° C. peak. The peak-height ratio has risen to 1.47. The purity of the ice appears to be very high and the density is not significantly different from that of ice free from bubbles. A significant increase in the total light emission of the sample indicates that its luminous efficiency is affected in the −140° C. peak but not in the −190° C. peak.
The main tunnel cuts the contact between the ice and rock at two points. The lower of these contacts is in the zone of highest pressure and this is clearly indicated by the presence of a narrow zone of banded ice immediately adjacent to the rock surface. This banded zone is thought to result from the accumulation of a series of highly thinned annual firn layers. Since the thinning of the original firn layers occurs by lateral flow of the ice, this sample should represent a high degree of deformation (personal communication from R. Haefeli). Care was taken to avoid fragments of rock in selecting the ice for testing. The narrowness of the banded zone made it impossible to obtain a perfectly homogeneous sample and the lack of homogeneity became evident when the glow-curves were being measured. A much wider variation in glow-curve shape was encountered than was found in repeated runs of any of the other samples tested. The glow-curve (Fig. 1i) is a composite of four determinations. Ali, however, showed a peak-height ratio higher than 3 and all showed a total light emission higher than average.
It is clear from these studies that a systematic variation in peak-height ratio can be found and that this is dependent at least in part upon the stress and flow history of the ice. Future workers should be cautioned that these results were obtained using very carefully controlled irradiation dosages and time intervals between the end of the irradiation and the running of the glow-curve. Different irradiation and standing times result in large variations in glow-curve shape and peak ratios; however, the sequence of ratios from the least stressed to the most stressed ice remains the same. In general, longer standing times result in an increase in the value of the ratios.
β-radiation was also found to produce thermoluminescence in ice. The principal peak occurs at approximately −140° C., which is in good agreement with the glow-curve resulting from irradiation with X-rays (Reference Grossweiner and MathesonGrossweiner and Matheson, 1954).
Results from Argificially Pressed Samples
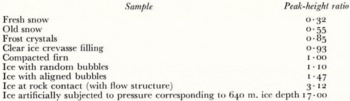
In order to test the hypothesis that pressure had produced the systematic variation seen in the glow-curves of glacier ice, a sample of ice was subjected to a pressure of approximately 60 kg./cm2 in a chilled cylinder. The pressure applied corresponds to an ice depth of approximately 640 m., which is in excess of the thickness of ice in most Alpine glaciers. This was done primarily because of the limitations of the hydraulic press which was used and which could not be read accurately for lower values. In addition, however, the high pressure permitted flowage to take place in a much shorter time than under natural conditions. The ratio obtained corresponds closely to the trend shown by the samples taken from the tunnel at Jungfraujoch. A cylinder of ice 2 cm. thick and 5 cm. in diameter was frozen from tap water using dry ice as the freezing agent. The first glow-curve of the sample showed a peak ratio of 1.7, indicating that stresses had been developed in the mass as a result of the crystallization process. Repeated runs of the same sample showed a decrease in the ratio suggesting that relaxation of these stresses was taking place. After approximately one hour the ratio had declined to 1.2. At this point the sample was subjected to the previously indicated pressure treatment. The ice cylinder was approximately one millimeter smaller in diameter than the mold in which it was pressed. Thus, the pressure was uniaxial until lateral flowage caused the sample to fill the mold completely, after which the pressure was essentially hydrostatic. The glow-curve run immediately after pressure showed an increase in peak ratio to 17.00 and an increase in absolute intensity of approximately 130 times. The resultant glow-curves are plotted in Figure 2. It appears from these studies that the peak-height ratio sequence shown in Table I is primarily related to the natural pressure to which the sample has been subjected. Studies of the effects of hydrostatic versus uniaxial stress are currently in progress.
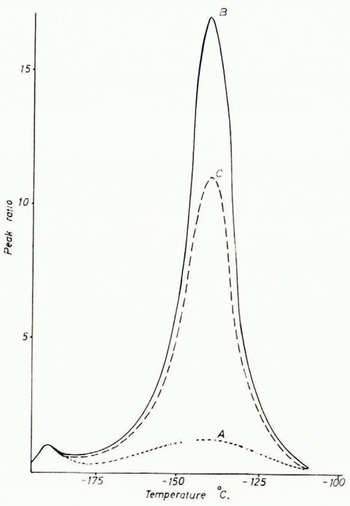
Fig. 2. A is the glow-curve of argificially frozen ice; B, of the same sample immediately after pressure has been applied, and C, 15 days after application of the pressure. The three curves have been normalized with the −190° C. peak height being made equal to one. The actual intensity from the pressed sample is about 130 times larger than the intensity from the unpressed sample
Table I Ratio of height of −140° C. Peak to height of −190° C. Peak in Glow-Curves of Various Ice Samples
Annealing and Decay Effects
All of the natural samples were run within one day after they were collected. The high peak-height ratios which characterize samples which have been subjcted to pressure show a marked decrease after the ice has been stored in a refrigerator for a period of time. For example, the ice with aligned bubbles shows a reduction in the peak-height ratio from 1.47 to 0.55 after approximately two weeks, and the peak-height ratio of the argificially pressed sample fell from 17.0 to 11.5 in fifteen days. It is probable that storage under very low temperature conditions would retard this annealing effect; however, care must be taken in future work to allow for this phenomenon.
All of the samples have been observed to exhibit an intense blue phosphorescence at liquid air temperature after exposure to ultraviolet radiation. It is very likely that this phosphorescence results from the decay of a glow-curve peak which has its maximum below liquid air temperature, in which case the −190° C. glow-curve peak described in this report is actually a remnant of this lower temperature peak. Therefore, the period of time for which the sample is kept at liquid air temperature after ultraviolet irradiation and before the glow-curve is run has a critical significance upon the peak ratio obtained. So long as this period of time is kept constant the peak ratios obtained will be consistent. However, much better results could be expected if glow-curves could be obtained starting at temperatures substantially below that of liquid air. Work is in progress to design apparatus which will permit these measurements.


