


Introduction
RustyFootnote * Glacier (lat. 61° 13′N, long. 140° 20′W.), with the adjacent BackeFootnote * and TrapridgeFootnote * Glaciers, lies near Steele Glacier in the upper watershed of Steele Creek on the north slope of the St Elias Mountains, south-western part of the Yukon Territory, Canada (Fig. 1). Rusty Glacier is about 4.5 km in length, its area is 4.9 km2. It lies between the altitudes of 2 010 and 2 770 m above sea-level. Trapridge and Backe Glaciers are generally similar to Rusty Glacier in size and altitude range but they have not been mapped in detail. All three glaciers have surged in the past and each is now in a different phase of its surge cycle.

Fig. 1. Location of the study area and the relationship of Rusty Glacier with major nearby features.
Rusty Glacier was selected in 1967 for an intensive interdisciplinary study because (1) its features are those of a soon-to-surge glacier well along in the quiescent phase of its cycle of periodic motions (Reference Meier and PostMeier and Post, 1969), (2) it is small enough to be studied easily, and (3) it is accessible for logistic support from the Arctic Institute of North America’s Icefield Ranges Research Project based at Mile 1054, Alaska Highway, at the southern end of Kluane Lake (Arctic Institute of North America, unpublished).
In general, the surveying summarized in this paper has consisted of triangulation to establish ground control for aerial photogrammetric mapping and of four annual observations of 70 marker poles on the glacier for flow-pattern analysis and possible early detection of a predicted surge. In 1969 and 1970, an array of 26 marker poles installed on Trapridge Glacier was also observed.
The coodinates and altitudes determined for each marker pole have been used in gravimetric mapping, mass-balance studies, thermal drilling for englacial temperature data, sample collection for stable isotope analysis, seismic and radio soundings, and other work.
Primary net surveying
The program was begun in the early summer of 1967 with the triangulation of stations on the periphery of the glacier valley; these were later used as instrument stations in surveying of marker poles on the glacier ice itself. The stations were established on the most stable footing available and monumented with 0.64 cm by 45 cm steel rods driven into the soil, most commonly well-compacted glacial drift, but in several cases weathered bedrock. A 1.52 m length of 2.9 cm steel pipe was centered vertically over the rod and held firmly by a rock cairn. The stations were clearly discernible through the surveying instruments; the most distant observation was about 5 km.
All surveying of the primary net was done with a Wild T-2 theodolite graduated in the metric system (400 grad arc). Rounds of angles were measured from each station to all other visible stations. Each angle was read three times direct and reverse. Fortunate coincidence of field schedules made it possible to arrange this phase of the Rusty Glacier survey so that two stations in the primary net were included in the trilateration of Steele Creek and Steele Glacier valley being conducted that summer by a Canadian party equipped for geodetic surveys of high precision. The adjusted distance between these two stations was reported as 1 419.494 m; this distance was used as the base line for the determination of the coordinates of all other stations. Major C. N. Thompson, in charge of the Canadian field party, very kindly agreed to include the Rusty Glacier observations in the program of coordinate computations for the Steele Creek survey, so that the positions and directions determined in the Rusty Glacier work would be expressed on a Universal Transverse Mercator projection compatible with the Steele Valley map. Coordinates of these nine primary stations were computed by the Canadian Mapping and Charting Establishment. The accuracy given for the Rusty Glacier survey in the computation report is 1: 25 000. Six secondary observation stations were established later with approximately the same accuracy.
Aerial photogrammetry
In August 1967 the Canadian Topographic Survey flew aerial photography of Steele Glacier, at that time in the middle stages of a surge. The Rusty Glacier survey stations were marked for recognition and the area was included. In 1968 the survey results were used as ground control to construct a 1: 10 000 scale map of the Rusty Glacier area with a contour interval of 10 m. This has served admirably as a base map for all subsequent work on Rusty Glacier.
Surveying of marker poles
A directional survey procedure was decided upon after considering the following:
-
1. 70 marker poles were to located.
-
2. Accuracy better than 1/2 500 is required so that overall probable error will be less than 0.5 m.
-
3. To reliably exceed this minimum precision limit, each target must be observed from three or more instrument stations and each observation repeated with the telescope direct and reversed.
In order to deal with the necessary 3 000 separate instrument sightings, a rapid field procedure and a note system suited to computer treatment were adopted. A program for computation of target coordinates was prepared by Mr Edward True of the Rochester Institute of Technology’s Computer Center. Intersection points of lines-of-direction through each target from various known instrument positions are computed and a least-square routine establishes the best-fitted common intersection coordinates. Possible magnitude of surveying errors (distance between individual intersection points) is indicated on the print-out along with the best-fit target coordinates, altitude and the station-to-target distance. The field observation for the Rusty Glacier survey can be completed in about 14 good working days. The accuracy achieved is within the desired limits, although the requirement for rapidity necessitates a sacrifice of precision in field procedure.
The average probable error (computed by the standard equation below) in the location of any single marker pole is about 0.38 m.

where e is probable error, a is distance between any intersection point and the accepted least-square target coordinates, and n is number of intersections locating the target.
Regression lines were plotted through each set of four observed annual marker-pole positions and “ideal” coordinates plotted at uniform intervals along the lines. The average probable error distance between observed and “ideal” coordinates was 0.22 m. On one occasion observations were duplicated on 19 targets and the average distance between the two successive positions determined for each was 0.19 m. Thus, a change in the position of a marker pole of more than about 0.2 m is detected reliably, although the absolute position of the pole is not known more reliably than ±0.38 m. It is felt that this degree of accuracy is adequate, since significant yearly motions in the ice are in the range of meters, and other sources of error (bending and tilting of poles) are larger than the surveying error. All observations were made on the marker-pole tops. For motion analysis no correction was made to the ice surface; changes in the observed pole-top positions were assumed to be identical to the position changes of the supporting ice.
Machine time required for processing the combined Rusty and Trapridge Glaciers survey data (about 100 targets altogether) on an IBM 360 was less than 0.33 h, including compilation time and a re-run to eliminate sundry human errors.
Analysis of results
Figure 2 shows the general configuration of Rusty Glacier and the valley floor beneath the ice (Reference Crossley and ClarkeCrossley and Clarke, 1970; Canada. Dept. of Energy, Mines and Resources. Surveys and Mapping Branch. Topographical Survey Division, unpublished; Reference CrossleyCrossley, unpublished), the positions of all primary survey stations and the array of marker poles in the ice with the average yearly observed amount and direction of motion indicated for each. Computed from the map and its source materials, the following are the general geometric parameters of the glacier: length, 4.5 km; area, 4.97 km2; greatest ice thickness, 88 m; average ice thickness, 36 m; volume, 0.178 km3; lowest altitude, 2 010 m (M.S.L. datum); highest altitude, 2 770 m; average slope, 1/5.92 or 0.169.

Fig. 2. Map of Rusty Glacier, showing surface and bedrock topography, positions of survey stations and marker poles, and direction and relative amount of motion in all cases where pole was observed to move more than 0.3 m/year.
Components of the flow pattern are portrayed separately for emphasis in Figures 3 and 4. Figure 3a shows horizontal flow lines and contours of equal horizontal motion plotted from values averaged over three successive years; small variations in movement from one year to the next were thought not to be significant. Ice motion is everywhere extremely slow; marker-pole displacements almost all measured less than 4 m/year. Strain-rates (Fig. 4) are also low, smaller than 8 × 10⁻³ year−1 with very few exceptions.

Fig. 3.
-
a. Horizontal flow lines and contours of average annual movement; contour increment is 0.5 m/year.
-
b. Annual snow lines and emergence pattern; cross-dashed lines represent early August snow lines on respective years as labeled; heavy dashed line represents zone of zero emergence angle where flow lines parallel the glacier surface; areas of positive and negative emergence are so designated and areas where flow lines diverge upward from a horizontal plane are stippled.
-
c. Ice thickness and bottom “hot spot”, isopachous contours are in meters; stippling represents area in which a layer of ice near the glacier bottom is at the pressure-melting point. (After Reference Classen and ClarkeClassen and Clarke, 1971.)

Fig. 4.
-
a. Distribution of longitudinal strain-rates; negative values indicate compression, positive extension; contour units are 10−3 year−1.
-
b. Distribution of transverse strain-rates; units and signs are as above.
In the lower part of the glacier tongue, below about 2 200 m altitude, no motion significantly larger than probable random surveying errors was detected, with the exception of marker poles at the base of the Backe Glacier front which had been moved eastward by the active Backe Glacier pushing out into the Rusty Glacier valley. The lower Rusty Glacier tongue has probably been essentially stagnant for many years. A number of linear drift features extend from the valley walls and cross the lower tongue at approximately right-angles to the flow axis (Fig. 5). These are expressed on the ice surface as ridges of drift-insulated ice standing a meter or two above the surrounding surface. Within the ice, they are thin tabular bodies of poorly sorted drift orientated more or less vertically and transverse to the valley axis; they clearly represent nearly vertical shear planes. That they extend unbroken from the ice out onto the valley walls shows that the elongated drift heaps melted out of the enclosing ice during an extended period of virtually no flow. Considering the height at which some of these features lie on the valley sides above the present ice surface and the present (probably representative) rate of ablation, it is evident that there can have been only trivial motion during at least the last two decades (Reference BrewerBrewer, unpublished).

Fig. 5. Rusty Glacier surface just below confluence of Backe Glacier; linear drift-insulaled ice ridges cross the ice and can be seen continuing as drift ridges on the valley wall recently abandoned by the wasting glacier.
Figure 3a shows that maximum flow velocities occur in an area well above the firn line, although a glacier’s fastest flow is usually found at or near the firn line. In a glacier with a narrowing valley such as Rusty Glacier has, one would expect the region of fastest flow to be found in a narrow section just below the firn line (Reference ShumskiyShumskiy, 1955; Reference SharpSharp, 1960). The higher flow rates in the upper névé area do not seem to be accounted for in any obvious way by unusual steepness of slope, either in the ice surface or in the valley bottom (Fig. 2). There is a rough correlation between the area of greatest motion and the more easterly of the two areas of maximum ice thickness shown in Figure 3c. Greater flow rates should be expected where surface slope is greater and where the ice is thicker. In this case, thickness seems more significant than slope, which is if anything less steep in this area than elsewhere on the glacier.
The strain-rate distributions mapped in Figure 4 were estimated from the flow lines and velocity contours of Figure 3a. Positive X distance was measured along each flow line from its origin at the glacier’s upper margin (Fig. 6); where a flow line crosses successive velocity contours (V
x1 and V
x2) longitudinal strain-rate ![]() equals
equals  and is easily evaluated. Distances Y
1, and Y
2 are measured along the velocity contours (V
x1 and V
x2) between two adjacent flow lines; transverse strain-rates
and is easily evaluated. Distances Y
1, and Y
2 are measured along the velocity contours (V
x1 and V
x2) between two adjacent flow lines; transverse strain-rates ![]() equal
equal  . The values thus obtained are unlikely to be exact at any given point, but are sufficiently accurate to yield a valid picture of the general strain-rate pattern over the glacier as a whole (Reference MeierMeier, 1960).

Fig. 6. Explanation of strain-rate calculations.
In Figure 4a, longitudinal strain-rates, the region of positive (extensive) values in the upper glacier corresponds well with the known distribution of crevasses. The band of greater than average negative values across the middle glacier indicates compression, as between flowing ice above and the immobile ice of the lower tongue; this band and the smaller, oval northernmost region of negative values correspond to the unusual pattern of strongly emergent flow-line angles (Fig. 3b) and a basal “hot spot” (Fig. 3c) discussed below.
Transverse strain-rate distribution shown in Figure 4b seems to correspond clearly only with the valley-bottom topography (Fig. 2), which shows a deep channel west of the glacier midline.
The survey data show some apparent changes in flow rates from year to year but, because these were small and not clearly consistent, they are not regarded as significant. Alteration of crevasse pattern would ordinarily indicate changes in flow regime: although there were no open or clearly defined crevasses exposed anywhere on Rusty Glacier in 1967 or 1968, except a few short stretches at the uppermost edge of the basin where a bergschrund would be expected, numerous, well-developed, open, lengthy crevasses appeared early in the 1969 season. This sudden and striking development would normally imply acceleration of extending motion. However, the previous winter snowfall had been lighter than average and the early summer ablation was unusually great in 1969 (Reference BrewerBrewer, unpublished). Maximum extensive strain-rates near 10−2 year−1 (Fig. 4) show that crevasses can open no more than a fraction of a meter per year at present ice velocities. Crevasses on Rusty Glacier must usually remain bridged over by new snow and firn compacting above them faster than they open; in the abnormal 1968–69 year of little snowfall and deep ablation early in the summer season, the bridges did not form or were destroyed and crevasses previously hidden became exposed. The abundance of “new” crevasses seen in 1969 thus does not necessarily mark a change of flow rate. None was visible during the 1970 field season.
Figure 3b shows the distribution of vertical motions of the ice over the 3 years. Almost all the measurements of vertical changes in the marker-pole positions are only a few decimeters, or even a few centimeters, too close to the limit of probable surveying error (ca. 0.13 m) to be given much consideration individually. The general pattern over the whole glacier is clearly consistent, however, and the upper glacier basin shows the downward motion (or negative emergence) one would expect from the flow paths customarily encountered in glacier ice and from the compaction of the firn in which the marker poles are set (Reference Meier and TangbornMeier and Tangborn, 1965). The rising of the ice (emergence) indicated in the middle glacier is less expected. The flow paths below the firn line, in other glaciers that have been studied, generally diverge upward from the surface slope of the glacier, but do not in most cases rise above a horizontal plane (Reference SharpSharp, 1960). The immobile lower tongue must act as a “dam” (Reference Nielsen and StocktonNielsen and Stockton, 1956; Reference NielsenNielsen, 1968, Reference Nielsen1969), distorting usual flow paths (Fig. 7). The model of a surging glacier with a “source” area in the accumulation zone and a “reservoir” area lower in the glacier valley (Reference Meier and PostMeier and Post, 1969) seems to fit Rusty Glacier admirably. Here the reservoir area corresponds to the part of the glacier near and below the firn line, where ablation and accumulation nearly balance and the ice that emerges by compressive flow is not removed. The thickness of the glacier must slowly increase in this area, eventually to decrease rapidly during a surge.

Fig. 7.
-
a. Usual pattern of flow lines in glacier ice; flow lines diverge upward from sloping glacier surface (arrows) but not at so great an angle (emergence angle) as to rise above a horizontal plane.
-
b. Schematic representation of the flow-line pattern in Rusty and Trapridge Glaciers; the immobile lower tongue appears to act as a dam, diverting flow lines more sharply upward, increasing the emergence angle and diverging upward from the horizontal.
Thermal studies (Reference Classen and ClarkeClassen and Clarke, 1971; Reference ClassenClassen, unpublished) show Rusty Glacier ice to be “cold” or well below 0° C, throughout except in one restricted area (Fig. 3c). The low temperature of the ice increases its mechanical strength and precludes basal sliding and water-film lubrication as mechanisms contributing to total movement (Reference WeertmanWeertman, 1957, Reference Weertman1964, Reference Weertman1967); together with the thinness of the glacier, this explains the very slow flow rates observed (Reference RobinRobin, 1955, Reference Robin1969). No clearly marked anomaly in flow pattern is discernible in the area of the “hot spot” where the ice layers at the base of the glacier were found to be at the pressure-melting point. Surface velocities should be greater above such an area, if it is of any considerable size. The warm region may be too small to affect surface flow, the influence of the small tributary entering the valley at that point may mask the effect, or it may simply be missed by the wide spacing between data points in the critical area. Reference Classen and ClarkeClassen and Clarke (1971) reported that geothermal flux in Rusty Glacier is significantly greater than world average. If the basal hot spot is an effect of progressive geothermal heating, it can reasonably be expected to enlarge. Time would be well spent in future efforts to relate detailed changes in surface motion to the thermal anomaly here.
Rusty Glacier can be classified as one of the “type III” glaciers that, in general, “show small displacements which are, however, large relative to the glacier’s size (10–30 per cent)” (Reference Meier and PostMeier and Post, 1969). The ice-cored moraine that marks the farthest extension of the terminus at the end of the glacier’s most recent advance is about 0.8 km down-valley from the lowest ice in 1967; the glacier has retreated about 18% of its 1967 length since the time of its last advance.
A look at the history of terminus retreat is of interest; photographs taken in 1939 and 1941 (Reference SharpSharp, 1947; Reference WoodWood, unpublished) show the valley filled with ice to the terminal moraine, but no abrupt wall of ice at the glacier front such as is seen in the present surging Backe Glacier or in photographs of Trapridge Glacier and other glaciers taken while in an actively advancing phase. The high surge-front ice cliff that must have existed during surge had vanished by ablation prior to 1941; assuming it was initially similar to the ice fronts produced in the Backe and Trapridge Glaciers surges, it is conservative to estimate that at the end of its surge the Rusty Glacier toe would have stood at least 20 m above the 1941 level. Since the present ablation rate, close to 2 m/year, has probably not changed greatly in the past half century, at least 10 years were required to bring the glacier surface down to its 1941 level. A reasonable working assumption is that Rusty Glacier last experienced a surge about 40 or 50 years ago, sometime near 1920, at least earlier than 1930. This means that the average rate of terminus retreat over the whole period must have been about 16–20 m/year, or, arbitrarily taking the 1967 length of the glacier as a reference, it shortened on the average about 0.36–0.44% per year. Because there is no flow, the lower part of the glacier is retreating rapidly at present. At the transect of marker poles approximately following the 2130 m the contour across the tongue, the average yearly net ablation is 1.89 m, probably not far from average figure for the lower third of the glacier (Reference BrewerBrewer, unpublished). Projecting this ablation rate back 40 years implies that a thickness of as much as 75 m of ice must have wasted out of the lower valley since the last surge. This figure is not really consistent with the position of edge moraines presumably formed at the time Rusty Glacier last advanced (they are found 10–40 m above the present ice surface) unless one makes the reasonable assumption that flow continued into the upper tongue after the toe stopped advancing, as has been observed to happen in lower Steele Glacier after its 1965–66 surge (Reference StanleyStanley, 1969; personal communication). It must also be taken into account that the surface of a newly surged glacier tongue characteristically stands an additional 10 or 20 m above its edge moraines. Also, photographs taken in the early 1940’s indicate that Backe and Rusty Glaciers both surged at nearly the same time to form the decaying surge tongue still filling the lower valley at that time. The stagnant ice wedge comprising the lower tongue continues thinning and the glacier terminus has retreated during the 1967–70 period of study at a rate of about 56 m/year, or about 1.25% of the 1967 length per year (Reference BrewerBrewer, unpublished). This is about triple the 16–20 m/year average rate for the whole time since the end of the most recent surge. The rate of retreat should increase as the thick bulk of a surged terminal lobe melts. Up-valley retreat of the ice can begin only after most of its original thickness has disappeared (Fig. 8). In the case of Rusty Glacier, projection of the present rate of retreat implies that the glacier will lose more than another 0.5 km, or about another 13% of its 1967 length, if wastage continues uniformly for another decade. Two decades of shortening at the present rate would bring the terminus to an altitude where flow is detectable in the ice; presumably the glacier could be in equilibrium at this length, barring another surge. Since glaciers that surge seem characteristically not to shift to an equilibrium mode of flow (Reference Meier and PostMeier and Post, 1969), it seems probable that the next period of active surge in Rusty Glacier should be expected within a decade.

Fig. 8. After a glacier tongue has stagnated following a surge, successive equal intervals of ablation produce regular lowering of the glacier surface (S 1−S 4); the terminus, however, recedes much less during the first interval (T 1−T 2) than during the second and third (T 2−T 4).
Backe Glacier
Throughout the Rusty Glacier study Backe Glacier has been in a phase of active advance, its tongue a steep-fronted lobe 20–30 m high pushing out onto the west side of lower Rusty Glacier, along a section about 800–1300 m above the Rusty Glacier terminus (dotted outline on Figure 2). The entire lower two-thirds of Backe Glacier is cut by an intricate pattern of close-spaced crevasses and gives the impression of having slid out of the middle and upper valley, bulging out at the toe in a manner almost analogous, although on a larger scale, to the “slumps” or “slope failures” familiar in the context of geological processes affecting weak rock and soil masses on steep slopes (Fig. 9).
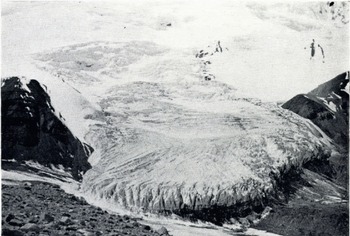
Fig. 9. Backe Glacier as seen from a point near survey station HK.
Backe Glacier had apparently been advancing for a number of years before 1967; its “surge” probably began about 1963. Because of the extended period of this phase of relatively rapid flow and extension, it is classified as a questionable or borderline example of a surge (Reference Meier and PostMeier and Post, 1969). Very few direct measurements have been made on it. In July 1967, two triangulations on a conspicuous pinnacle at the eastern margin of the lobe, made about 2 weeks apart, indicated that the Backe Glacier ice front at that point was moving nearly due east at about 20 cm/d. In late July 1968, a marker pole was set at about E537225, N6786815 on the south-eastern lobe margin. By mid-June 1969, the pole had moved to E537249, N6786815, or about 24 m farther east, an average rate of about 7 cm/d. Measurements made in 1970 indicate that the northward component of motion (down the Rusty valley axis) was about 20–40 cm/d at the northern margin of the terminal surge front. No definite conclusions can be reached from these scattered data, beyond that the Backe lobe is still active and that the largest component of its motion now seems to be northward down Rusty valley.
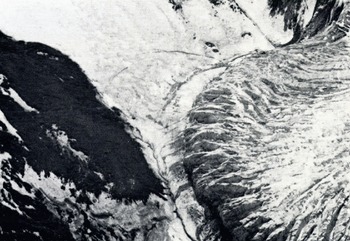
Fig. 10. New crevasses that appeared in the Rusty Glacier ice early in 1970 just above the extending Backe Glacier tongue.
In 1970 at least five small crevasses appeared crossing the Rusty Glacier tongue just up-stream from the Backe Glacier confluence (Fig. 10) where none had existed before. One was more than 40 cm wide and deeper than 10 m; other measurements were not made. Eastward motion of the single marker pole located in the disturbed area indicates that the crevasses have formed in response to cross-valley pressure from the advancing Backe Glacier tongue. The Backe Glacier lobe had almost completely crossed the Rusty Glacier tongue in 1970, so further motion, if any, should be primarily toward the north.
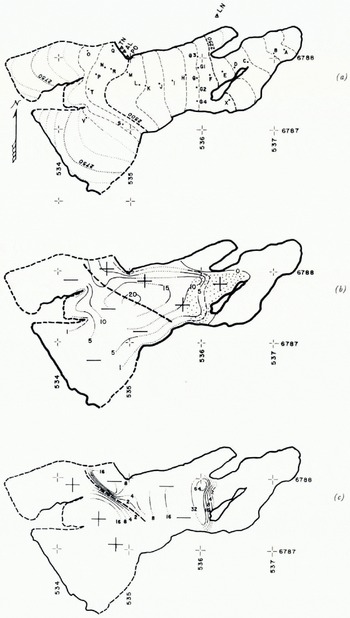
Fig. 12.
-
(a) Trapridge Glacier; approximate topography and location of surveyed points.
-
(b) Horizontal motion and pattern of emergence; contours (dotted where estimated) represent amount of horizontal motion in 1969–70, in meters; heavy dashed line represents zone of zero emergence; areas of negative and positive emergence are designated and stippling shows the area where flow lines diverge upward from the horizontal.
-
(c) Distribution of longitudinal strain-rates; heavy dashed line represents zone of zero strain; negative values indicate compression, positive extension; contour units are 10−3year−1.
Trapridge Glacier
Trapridge Glacier also flows into .the Rusty Glacier valley from the west.
Photographs taken in 1939 (Reference WoodWood, unpublished) show a relatively smooth surface on the middle and lower Trapridge Glacier with some crevasses. Either the glacier was not in surge then, or surge activity had only very recently begun. 1941 pictures (Reference SharpSharp, 1947) show extensive crevassing on the lower glacier and a steep ice cliff surge-front just above the confluence with the Rusty Glacier valley; the glacier was evidently then in an active advancing phase. 1945 aerial photographs show the lower two-thirds of Trapridge Glacier extensively crevassed and chaotically broken up, even more so than is the present Backe Glacier surface. The tongue extended out into Rusty Glacier valley and terminated in a formidable ice cliff. By 1967 there were no open crevasses on the lower half, indicating that the tongue had been essentially inactive long enough for ablation to have removed the crevassed ice that had previously formed the near-surface fracture zone during the surge (Fig. 11).
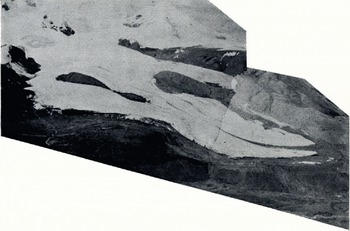
Fig. 11. Trapridge Glacier as it appeared in 1967. No crevasses remain from the last period of activity in 1945. As much as 45 m of ice has probably ablated from the tongue in this interval.
The general features of Trapridge Glacier are very similar to those of Rusty Glacier; length and area are about the same, slope is somewhat greater, and the upper limit of the altitude range is a little higher, as is the upper part of the accumulation area. Exact figures for these parameters are not available because the glacier has not been accurately mapped at a large scale.
Figure 12a, showing its general shape and topography, is sketched from an aerial photograph and subjectively adjusted to a rough fit with the surveyed points plotted on a U.T.M. grid; contours were sketched from marker-pole altitudes and subjective evaluation of surface morphology revealed on the photograph. Accuracy is poor, but sufficient for the immediate purpose of this paper. Since this glacier is within the Rusty Glacier survey net and is accessible on foot, but is in a different phase of its surge cycle, a survey of 26 marker poles (Fig. 12a) was begun in 1969 and repeated in 1970. Unlike Rusty Glacier, maximum flow rates are found in the middle glacier near the firn line and are considerably faster, as much as 20.5 m/year Fig. 12b). Strikingly similar to the pattern of Rusty Glacier, the lower 1.3 km is almost completely stagnant and a region of unusually strong emergence, where flow lines diverge upward from the horizontal at large angles, lies between the stagnant lower tongue and the middle zone of most rapid flow. As in Rusty Glacier, the boundary zone between the active and stagnant ice is clearly marked by a relatively narrow band of sharply increased compressive longitudinal strain-rates (Fig. 12c); this corresponds to a band of sharply increased slope across the glacier, suggestive of a kinematic wave front. Only further surveillance could identify it as such.
Although Trapridge Glacier has surged more recently than Rusty Glacier, its greater present activity makes it seem at least as likely to enter an active phase soon. The rate at which ice is flowing into its reservoir area seems certainly greater than in Rusty Glacier; it must recover to the active part of its cycle in a shorter time. Its slightly higher accumulation area may keep it comparatively better nourished than Rusty Glacier, especially during the recent decades of general glacier retreat. It is unfortunate that ice thickness and temperature data have not been taken on Trapridge Glacier.
Summary
-
I. Flow rates in Rusty Glacier are very slow, 0–5 m/year, faster in Trapridge Glacier, up to 20 m/year.
-
a. The lower third of both the Rusty and Trapridge Glaciers is essentially stagnant and has been so for at least two decades in the case of Rusty Glacier.
-
b. The largest flow rates of Rusty Glacier are found in the upper eastern part of the accumulation basin, rather than near or below the firn line where fastest flow is usually found. Flow in Trapridge Glacier is most rapid near the firn line.
-
c. The variation in flow rate between different parts of Rusty Glacier does not seem clearly related to valley-bottom topography, but does seem to correlate fairly well with the pattern of variations in ice thickness.
-
d. Areas of highest flow rates in Rusty Glacier do not seem to correlate straightforwardly with the “hot spot” or area of the glacier bottom at the pressure-melting point.
-
Thermal measurements showing that the bulk of the glacier is probably frozen to its bed help explain the very slow flow rates.
-
Unusually high rates of geothermal flux indicated by thermal measurements may be significant in the mechanism of surge flow; further thermal measurements should be made and correlated with peculiarities in flow pattern.
-
-
-
II. There is no significant evidence that the rate of flow is changing except in a limited area affected by the advance of the Backe Glacier tongue into lower Rusty Glacier valley.
-
a. Many crevasses appeared in the upper Rusty Glacier basin in 1969 where none was visible before. This was probably the result of uncovering by an unusually low winter snowfall and the unusually early and warm ablation season.
-
-
III. The survey results reveal rather clearly differentiated “source” and “reservoir” areas such as Meier and Post described in other surging glaciers, in upper and middle Rusty Glacier, respectively.
-
a. In both Rusty and Trapridge Glaciers, “emergence”, or upward motion of the flowing ice, is greater than reported elsewhere, in that the emergence angles rise above the horizontal plane over a considerable area in the middle glacier.
-
-
IV. Wastage rate of the lower glacier tongue and terminus retreat rate indicates that Rusty Glacier is in the last stages of its phase of recession; a surge in the relatively near future seems likely.
-
a. Trapridge Glacier may be nearing onset of surge activity more rapidly than is Rusty Glacier.
-
Acknowledgements
Financial support for this work was provided by the Arctic Institute of North America, by National Science Foundation grants GA-1080, GA-512 and GA-14731, by the Canadian Department of Energy, Mines and Resources, the Explorers Club, and by the American Geographical Society. I wish to thank especially Major C. N. Thompson of the Canadian Mapping and Charting Establishment for co-operation in the completion of the control survey, and Mr Edward True of Rochester Institute of Technology, for his assistance in programming. The unflagging interest and support of Dr W. A. Wood has been invaluable. Although their number is too large for individual mention, I wish to acknowledge my debt and express my gratitude to the dozens of other individuals without whose kind help, counsel and encouragement, in both field and office matters, this study could not have been completed.
Appendix
Part A: U.T.M. coordinates and ground altitudes of observation stations (Fig. 13)

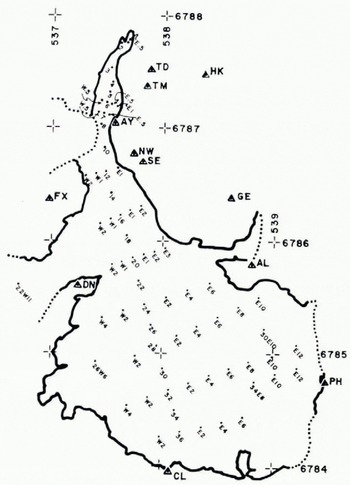
Fig. 13. Numeration of marker poles on Rusty Glacier. For marker-pole numeration on Trapridge Glacier, see Figure 12a.
Part B: U.T.M. coordinates and average annual motion data for marker poles (Fig. 13)
E 70, N 70, and A 70 are Universal Transverse Mercator easting, northing and altitude, respectively.
V h and V x are average annual motion in the horizontal and vertical direction, respectively, in meters.
Dir. is the map direction of the horizontal motion, in degrees clockwise from north.
E is the angle of emergence (angle between flow line and glacier surface) in degrees.


