


Introduction
The micro-structural characteristics of sea ice, i.e. the size, shape and orientation of its individual crystals, and the geometry and spatial arrangement of the ice-brine-gas phases that comprise the crystal sub-structure, vary according to the conditions, processes and mechanisms of initial ice growth and development. Consequently, by characterizing this structural variability, it is possible to identify the sequence and nature of the events that contributed to the development of the ice.
Much of our present knowledge and understanding of land-fast sea-ice structure and development are based on studies in the Arctic. There, annual ice growth is dominated by the accretion of congelation ice formed as a result of the conduction of heat from the ocean to the atmosphere through the developing ice layer. The cellular sub-structure of ice plates and brine layers, crystal morphology and size variations, and the influence of water currents on the development of preferred crystal c-axis orientations in congelation ice have been described by Reference Weeks and HamiltonWeeks and Hamilton (1962), Reference CherepanovCherepanov (1973), Reference Gow and WeeksGow and Weeks (1977), Reference Weeks and GowWeeks and Gow (1978, Reference Weeks and Gow1980) and Reference Nakawo and SinhaNakawo and Sinha (1984). Reports by Reference PaigePaige (1966) and Reference Gow, Ackley, Weeks and GovoniGow and others (1982) indicate that Antarctic and Arctic land-fast congelation ice has similar structural characteristics. However, limited data are available and additional studies would contribute to a better understanding of congelation-ice development in both polar regions.
Platelet ice has only been observed in Antarctica, where it appears to be commonest in fast ice and coastal pack ice (Reference PaigePaige, 1966; Reference BuynitskiyBuynitskiy, 1967; Reference Cherepanov and KozlovskiyCherepanov and Kozlovskiy, 1972, Reference Cherepanov and Kozlovskiy1973a, Reference Cherepanov and Kozlovskiyb, 1977; Reference Kozlovskiy and CherepanovKozlovskiy and Cherepanov, 1977; Reference Gow, Ackley, Weeks and GovoniGow and others, 1982; Reference LangeLange, 1988; Reference Lofgren and WeeksLange and others, 1989; Reference Crocker and WadhamsCrocker and Wadhams, 1989; Reference Eicken and LangeEicken and Lange, 1989; Reference KipfstuhlKipfstuhl, 1991; Reference Jeffries and WeeksJeffries and Weeks, 1991a, Reference Jeffries and Weeksb, in press). This ice type commonly occurs as aggregates of platelets, which either underlie or have become incorporated into congelation ice. Each platelet, so-called because they initially have tabular forms up to 5 mm thick and 150 mm in diameter, is a single crystal.
Russian workers have suggested that platelet formation is related to the flow of snow-and-ice meltwater off the continent into the coastal seas. Western workers favour a mechanism involving the flow of low-density sea-water masses from beneath ice shelves. That water becomes adiabatically supercooled as it rises toward the surface (Reference Foldvik and KvingeFoldvik and Kvinge, 1974) and platelets form at or near the base of existing sea ice. Platelets have also been observed forming at water depths exceeding 200 m (Reference Dieckmann, Rohardt, Hellmer and KipfstuhlDieckmann and others, 1986), after which they presumably float towards the surface. Whatever their origin, an initially porous latticework of platelets develops against the underside of the existing sea ice and is ultimately incorporated into the sea-ice sheet by congelation of the water in the platelet interstices. Hence, the aggregate of platelets and congelation ice seen in ice cores.
There is an increasing number of reports of platelet-ice occurrence below and within Antarctic pack ice and fast ice, including descriptions of the appearance of the suspended crystals (Reference BuynitskiyBuynitskiy, 1967; Reference Dieckmann, Rohardt, Hellmer and KipfstuhlDieckmann and others, 1986; Reference KipfstuhlKipfstuhl, 1991), and of the texture and fabric of the congealed platelet ice (Reference Cherepanov and KozlovskiyCherepanov and Kozlovskiy, 1973a, Reference Cherepanov and Kozlovskiyb; Reference LangeLange, 1988). However, considering the fact that platelet ice appears to be unique to the Antarctic and particularly common in Antarctic coastal sea ice, little is known about its structure and role in Antarctic sea-ice development.
This paper describes an investigation of the structural characteristics of congelation and platelet ice in the land-fast ice of McMurdo Sound. The objective of the investigation was to document the stratigraphy and composition of the ice, to characterize the variations in texture, fabric and sub-structure, and to identify the ice-growth conditions, processes and mechanisms that contribute to ice development.
Field Setting
McMurdo Sound, located in the southwest corner of the Ross Sea embayment, is bounded by Ross Island on the east, the McMurdo Ice Shelf on the south and the Antarctic mainland on the west (Fig. 1). Water depths vary from about 200 m on the western side of McMurdo Sound to 600 m on the eastern side in the vicinity of Cape Royds (Reference Lewis and PerkinLewis and Perkin, 1985). Circulation in the upper 200 m of the water column is dominated by currents flowing northward into McMurdo Sound from below the McMurdo Ice Shelf, plus an anti-cyclonic eddy in the vicinity of Cape Royds (Reference Heath and DunbarHeath, 1977; Reference Lewis and PerkinLewis and Perkin, 1985).

Fig. 1. Map of ice-core sites in McMurdo Sound. Ice Runway 1 was initially located in the vicinity of core RS-20, but was abandoned in September 1990 due to rough ice. As an alternative, Runway 2, marked by the boxed-R, was located a short distance northwest of McMurdo Station.
Reference PaigePaige (1966) characterized the climate of McMurdo Sound as one with frequent high winds, drifting snow, low temperatures and extreme temperature fluctuations. The temperature characteristics are evident in the 1990 austral winter records for the ice-growth season (April-November) in McMurdo Sound (Fig. 2). Ice begins to form in McMurdo Sound in March, but is often broken up and blown out by the wind. Stable sea-ice growth usually starts in late March or early April. Maximum ice thicknesses, 2-3 m, are reached in late November or early December, with thinning by bottom melting starting in mid-December (Reference PaigePaige, 1966; Reference Leventer, Dunbar, Allen and WayperLeventer and others, 1987). The fast ice begins to break up in late January and, by mid- to late February, McMurdo Sound is largely ice-free.

Fig. 2. Air-temperature records for McMurdo Station, Scott Base and Marble Point showing large, synchronous temperature fluctuations during the ice-growth period 1 April (Julian Day 91) to 30 November (Julian Day 334) 1990.
Since the mid-1960s, it has been known that the land-fast sea ice in McMurdo Sound often develops by congelation ice growth followed by platelet-ice accretion and solidification (Reference PaigePaige, 1966; Reference Gow, Ackley, Weeks and GovoniGow and others, 1982; Reference Lewis and PerkinLewis and Perkin, 1985; Reference Crocker and WadhamsCrocker and Wadhams, 1989). Using the McMurdo Sound fast ice as an example, Reference Crocker and WadhamsCrocker and Wadhams (1989) successfully applied a thermodynamic model to the sequence of Antarctic fast-ice development by congelation ice growth and platelet-ice solidification. Analytical studies of the McMurdo Sound fast ice have included investigations of congelation ice-crystal dimensions and plate-width spacings (Reference PaigePaige, 1966), and congelation ice crystal c-axis alignments (Reference Gow, Ackley, Weeks and GovoniGow and others, 1982).
Land-fast ice covers McMurdo Sound for about 10 months per year, and its growth and decay affect the operation of both McMurdo Station (77.85 °S, 166.66 °E) and Scott Base (77.85 °S, 166.78 °E) (Fig. 1). For example, each year a nearby site is selected for a fast-ice runway, allowing very large wheeled aircraft to fly in more personnel, materials and supplies than would be possible with ski-equipped aircraft alone. The stability of the fast ice also makes it a platform for scientific investigations. The duration of runway operations and scientific investigations, however, are influenced by the thickness and physical condition of the ice. The limited number of investigations of the McMurdo Sound fast ice is surprising in view of its importance to the operation of two national Antarctic research programs. In the austral summer of 1991, we had the opportunity of obtaining fast-ice samples for a study of its structure and development. The following report describes the results of our investigation.
Methods
In 9 d (8-17 January 1991), two 100mm diameter ice cores were obtained from 16 different locations in McMurdo Sound (Fig. 1). Each site was given an alpha-numeric code, e.g. RS-19 was the first site visited in McMurdo Sound and the nineteenth site we had sampled in the Ross sea region since late December 1991. The choice of sites was based on the need to obtain broad areal coverage, and to re-visit as many sites as possible that had been studied 10 years earlier by Reference Gow, Ackley, Weeks and GovoniGow and others (1982). In this paper, we report results from studies of cores from 15 McMurdo Sound sites (site RS-30 was excluded because the poor quality of its core prevented adequate analysis).
The length of each ice core provided a measure of the ice thickness. That value was supplemented by additional measurements made by drilling with a 50 mm diameter auger at points selected randomly within a 50 m radius of the core site. Snow depth was recorded at each site. One of the cores from each site was returned to McMurdo Station, where a temporary ice-core analysis laboratory was established in a walk-in freezer. The cores were not oriented with respect to a fixed azimuth. Temperature and salinity measurements were made on the second core. Those data are not reported here.
Each core was split longitudinally and vertical thick sections of the entire length of the core were prepared. The sections were then illuminated between crossed polarizers to reveal variations in ice structure which were logged to produce a top-to-bottom stratigraphic profile of the core. Selected vertical and horizontal thin sections (≤ 1 mm thickness) of interesting or characteristic internal structural features were also prepared, illuminated in crossed polarizers and photographed. The horizontal thin sections were also placed on a stereo-microscope and photomicrographs of the sub-structures were taken. Measurements of brine-layer spacing (plate width, a 0) in congelation ice were subsequently made from those photographs. A minimum of 50 measurements was made to derive a mean a 0 value for each specimen.
In addition, selected samples were packed in insulated containers and shipped by sea and air to Fairbanks, Alaska. There, the c-axis orientations of congelation and platelet-ice crystals were measured using a Rigsby stage. Those data were plotted on the lower hemisphere of a Schmidt (equal-area) net (Reference LangwayLangway, 1958). The mean (x 0) and standard deviation (s 0) of the congelation-ice c-axes orientations in each section were calculated according to the method described by Reference Weeks and GowWeeks and Gow (1978). Because the cores were not oriented with respect to a fixed azimuth, the x 0 values are not considered here since the orientation has little meaning without a reference direction. On the other hand, the So values are a valuable measure of the degree of clustering or alignment of the c-axes, independent of the mean orientation. The following classes are adopted to describe the degree of alignment: s0 ≤ 15 °, strongly aligned; 15 < s 0 ≤ 30 °, moderately aligned; s 0 ≥ 30 °, weak or no alignment.
Ice Thickness
Ice Runways and Ice-Core Sites
In 1990, the fast-ice thickness was monitored on a weekly basis at the ice runways (Fig. 1). The records show that, when measurements began on 19 July at runway 1, the ice thickness was 1.34 m, increasing to 2.36 m on 1 December, when measurements ceased at runway 2 (Fig. 3). The mean ice thickness at the 15 ice-core sites (Table 1) varied between 2.32 (RS-27) and 1.28 m (RS-32). This latter site was located on a refrozen lead that must have formed later in the growth season; hence, the lower ice thickness. The mean value of the ice-thickness measurements is 1.95 ± 0.05 m, somewhat less than the runway ice thickness on 1 December. The difference can be attributed to bottom melting. If we assume that the maximum ice thickness at the runway was 2.36 m, and that it was representative of the McMurdo Sound fast ice in general, then an average of about 0.4 m of ice may have melted off the base of the ice prior to sampling. Even with bottom melting, the mean fast-ice thickness is almost twice the average value (1.09 ± 0.29 m) measured in the western Ross Sea pack ice during late December and early January immediately prior to our arrival in McMurdo Sound (Reference Jeffries and WeeksJeffries and Weeks, 1991b).

Fig. 3. McMurdo Sound fast-ice thickness and growth profile compiled from weekly measurements at the ice runways. The horizontal dashed line and the two dotted lines represent the mean and standard deviation respectively of ice thickness (1.95 ± 0.05 m) measured in January 1990. The ice runway reached a mean thickness of 1.95 m on about Julian Day 270 (27 September). Data by courtesy of the Public Works Office, Naval Support Force Antarctica.
Table 1. Maximum snow depth, ice-core length and mean thickness at sampling sites in McMurdo Sound. Numbers in parentheses are the number of ice-thickness measurements

Freezing Degree Days and Comparison with Arctic Fast Ice
Ideally, an understanding of the development of sea ice in relation to local weather, climate and ocean conditions requires a knowledge of the complete energy balance, including variables such as long- and short-wave radiation, turbulent heat exchange, and the conductive and oceanic heat fluxes. Frequently, however, such data are not available. As an alternative, it has been found that freezing degree-day totals (FDDs) are a useful measure that allows ice growth to be placed in a climatological-meteorological perspective, and to be compared with other locations (Reference BilelloBilello, 1961). That is the purpose of this section.
Assuming stable ice growth began in McMurdo Sound on 1 April 1990 and maximum ice thickness was reached on 1 December 1990, the austral winter 1990 temperature records for McMurdo Station and Scott Base indicate there were 5631 and 6206 FDDs, respectively, for the 2.36 m of ice growth at the ice runway. The greater FDD total at Scott Base is not important to this study, but it can be attributed to a more continental/ice-shelf climate at Scott Base (personal communication from C. Stearns). Since February 1980, an automatic weather station at Marble Point has provided an almost uninterrupted climate record representing McMurdo Sound in general (personal communication from C. Stearns). For the 1990 ice-growth season, there were 5286 FDDs and, for the period 1980-90, the mean number of FDDs for the ice-growth season (1 April-31 November) was 5109 (Table 2).
Table 2. Freezing degree-day1 comparison between Marble Point, McMurdo Sound, and Alert, Ellesmere Island

The significance of the McMurdo Sound FDD totals becomes apparent when they are compared with those for Arctic fast-ice growth under similar polar marine conditions. For this comparison, Alert (82.5 ° N, 62.33 ° W), located by the Arctic Ocean of the north coast of Ellesmere Island in the Canadian High Arctic, was selected. The Alert ice-growth season lasts for 9 months, mid-September to mid-June (Reference Bilello and BatesBilello and Bates, 1961-72), has an annual average of 6658 FDDs (Table 2) and a mean maximum ice thickness of 2.05 m (Reference MaxwellMaxwell, 1982).
There are fewer mean annual FDDs at McMurdo Sound than at Alert during the ice-growth season (Table 2). The McMurdo Sound ice-growth season is roughly 1 month shorter than at Alert. Yet, although McMurdo Sound is apparently a warmer location than Alert, the data indicate the McMurdo Sound fast ice reaches a greater thickness in a significantly smaller number of FDDs than the fast ice at Alert. We suggest that this is due to the accumulation and solidification of platelets at the base of the fast ice, as will be discussed in a later section.
Stratigraphy and Composition
Congelation, congelation/platelet, platelet and frazil ice were identified in the McMurdo fast-ice cores. The general appearance and texture of the first three ice types in vertical sections are illustrated in the three-panel stratigraphie sequence in Figure 4. The top panel shows congelation ice with the characteristic columnar texture of vertically oriented ice crystals. The lower panel shows platelet ice with a disorganized texture of angular, blade-like crystals. Some of the finer details of the platelet-ice characteristics and the resultant textural variations are illustrated in the next section. In the centre panel the blady platelet-ice crystals on the left side and the columnar congelation ice on the right side provide an example of what we will term congelation/platelet ice. Any section which comprised as much as 50% platelet crystals set in congelation ice was logged as congelation/ platelet ice. If the amount of platelets exceeded 50%, the section was logged as platelet ice only.

Fig. 4. Sequential vertical thin sections from core RS-27, 1.70-2.045m, show the transition from congelation ice to platelet ice that characterized the stratigraphy of the McMurdo Sound fast ice. Scale divisions are at 10 mm intervals.
Some examples of the fast-ice stratigraphy, and the variable amounts and occurrence of each of the ice types are shown in Figure 5. Only core RS-19 contained frazil ice, in this case a thin surface layer. The contribution of frazil ice to the fast-ice development was so small as to be essentially negligible. All the cores were characterized by an upper congelation ice layer and lower layers of congelation/platelet ice and/or platelet ice. The amounts of each ice type in each core are summarized inTable 3. Overall, the fast ice comprised 62.1% congelation ice, 28.3% platelet ice and 9.3% congelation/platelet ice. Apart from two exceptions, the basal layer of each core was platelet ice (Fig. 5). Since basal melting occurred at each site prior to sampling, the amount of congelation ice is overestimated and the amount of platelet ice is underestimated.
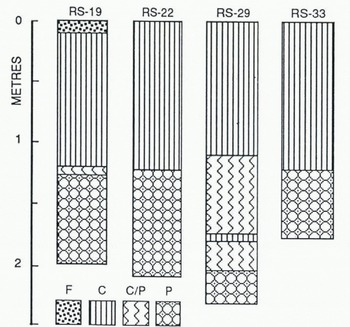
Fig. 5. Stratigraphie profiles illustrate the development of the fast ice in McMurdo Sound. Legend: frazil ice, F; congelation ice, C; congelation/platelet ice, C/P; platelet ice, P.
Table 3. Amounts of frazil, congelation, congelation/platelet and platelet ice in McMurdo Sound fast-ice cores. The last row gives the mean amount of each ice type for the fast ice as a whole

The amounts of platelet ice in individual cores (9.5-56.0%) and the average amount of platelet ice in the suite of 15 cores (28.3%) are amongst the highest values yet reported for the contribution of platelet ice to Antarctic sea-ice development. For example, the average contribution of platelet ice to Weddell Sea cores has been reported to be 11%, with individual cores comprising as much as 50% platelet ice (Reference Eicken and LangeEicken and Lange, 1989; Reference Lange, Ackley, Wadhams, Dieckmann and EickenLange and others, 1989). Immediately prior to our McMurdo Sound fast-ice study we examined 17 sites from the western Ross Sea pack ice, where only one core contained platelet ice (64%) (Reference Jeffries and WeeksJeffries and Weeks, 1991b, in press). Although reports by Russian scientists do not include amounts of platelet ice as a percentage of the length of their cores, it is clear that significant amounts of platelet ice occur in the fast ice near their Antarctic bases (Reference BuynitskiyBuynitskiy, 1967; Reference Cherepanov and KozlovskiyCherepanov and Kozlovskiy, 1972, Reference Cherepanov and Kozlovskiy1973a, Reference Cherepanov and Kozlovskiyb; Reference KozlovskiyKozlovskiy, 1977; Reference Kozlovskiy and CherepanovKozlovskiy and Cherepanov, 1977).
In McMurdo Sound it is believed that the platelets grow from adiabatically supercooled low-density water that flows northward into the Sound from below McMurdo Ice Shelf (Reference Lewis and PerkinLewis and Perkin, 1985; Reference Crocker and WadhamsCrocker and Wadhams, 1989). In the austral winters of 1984 and 1986, Reference BarryBarry (1988) and Reference Crocker and WadhamsCrocker and Wadhams (1989) respectively reported that, prior to basal melting, the locations of the thickest platelet-ice accumulations corresponded to the areas of maximum surface super-cooling reported by Reference Lewis and PerkinLewis and Perkin (1985). The pattern of occurrence and quantity of platelet ice in our cores also corresponded with previously documented patterns of surface-water supercooling (Fig. 6). The agreement is quite good despite the fact that some basal melting had occurred prior to sampling, and the patterns of occurrence of supercooled water probably vary from year to year. The large amounts of platelet ice in cores RS-25, RS-34, RS-22, RS-23 and RS-24 coincide quite closely with the flow direction of the most supercooled water in the west-central part of McMurdo Sound, whereas smaller amounts of platelet ice are found in the cores along the western shores of the Sound (RS-26, RS-27, RS-28, RS-33) and in Erebus Bay (RS-31).

Fig. 6. McMurdo Sound ice-core sites and percentage of each core containing platelets (platelet ice plus congelation/platelet ice) in relation to contours of surface supercooling (mdeg) measured in October-November 1982 by Reference Lewis and PerkinLewis and Perkin (1985). Platelet-ice percentage values are in italics below the core numbers.
General Description of Texture, Sub-Structure and Fabric
Upper Congelation Ice Layer
Three of the numerous congelation-ice textures observed in horizontal sections of the McMurdo Sound fast ice are shown in Figure 7. Under the microscope the characteristic congelation sub-structure of well-organized rows of thin, dark brine layers interposed between broader, lighter ice plates is revealed (Fig. 8a). Congelation ice plates are not to be confused with platelet-ice crystals.

Fig. 7. Ice-texture photographs and fabric diagrams for horizontal sections of congelation ice from core RS-19, 0.19 m (a), core RS-20, 0.48m (b) and core RS-24, 0.86m (c). Scale divisions are at 5mm intervals.
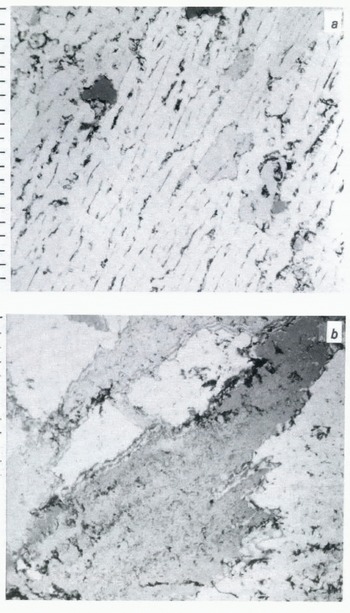
Fig. 8. Photomicrographs of horizontal sections illustrate the sub-structure of (a) congelation ice in core RS-24, 0.86m, (b) platelet ice in core RS-27, 2.10 m. (c) congelation ice located in the interstices between platelets in core RS-29, 2.08 m. Scale divisions are at 1mm intervals.

Fig. 8.
The fabric diagrams for the congelation ice sections show the c-axes lie in the horizontal plane, indicated by the points lying on the perimeter of the Schmidt net (Fig. 7). In one case, the points lie all around the perimeter (Fig. 7a), a horizontal girdle with an s0 value of 52.2 °, indicating the c-axes were not aligned. In the other two cases, the horizontal c-axes are clustered in two opposing groups on the perimeter (Fig. 7b and c). The c-axes in Figure 7b have an s 0 value of 20.2 °, indicating moderate alignment evident in the parallelism of some crystals. The c-axes in Figure 7c have an So value of 7.4 °, indicating strongly aligned c-axes; hence the well-developed parallelism in the texture.
A predominantly congelation-ice texture of parallel crystals with bright rows of inclusions (brine layers) is evident in Figure 9. This section, from 1.79 m in core RS-27 (Fig. 4), also contains a few platelet-ice crystals which cut across the general grain of the congelation ice. The fabric diagram of this congelation/platelet ice reveals that, although the congelation-ice c-axes are strongly aligned s 0 value of 14.2 °), the few platelet-ice crystals have more varied c-axis orientations, ranging from horizontal to vertical, i.e. from near the perimeter to near the centre of the Schmidt net (Fig. 9).

Fig. 9. Ice-texture photograph and fabric diagram for a horizontal section of congelation/platelet core RS-27, 1.79 m. In this and subsequent fabric diagrams the congelation-ice crystals are denoted by dots and the platelets by open squares. Scale divisions are at 5 mm intervals.
Lower Platelet-Ice Layer
The blade-like texture of the platelet ice noted in the previous section is due to a number of features, including the angularity accentuated by the sharp tips, relatively even edges and long, thin forms (Figs 4 and 10a). The platelets in Figures 4 and 10a are as much as 6-10 cm long. The blade-like platelet-ice crystals are the ones most commonly illustrated as representing the platelet-ice texture in ice cores (e.g. Reference Eicken and LangeEicken and Lange, 1989; Reference Lange, Ackley, Wadhams, Dieckmann and EickenLange and others, 1989). However, a wider variety of platelet-ice textures was observed in McMurdo Sound.

Fig. 10. a. Details of variations in platelet-ice texture in vertical sections, a: core RS-33,1.47-1.55m;. b. b: core RS-22, 1.04-1.16m;. c: core RS-19, 1.73-1.83m. Scale divisions are at 5 mm intervals.

Fig. 10.
Many of the platelets were less angular, more equidimensional and had wavy, uneven edges. The waviness was often observed in the first platelets to appear as the fast ice made the transition from congelation growth to platelet accretion (Fig. 10b). Densely packed accumulations of these wavy-edged platelets gave the ice a distinctive appearance resembling draped fabric (Fig 10c). The more typical, blade-like crystals also occasionally had wavy edges (Figs 4 and 10a). We suggest that these crystal forms represent dendritic growth in suspension under different degrees of supercooling, but further studies are necessary to quantify this hypothesis.
Horizontal sections of platelet ice also show considerable textural variation and are quite different from congelation-ice textures (Fig. 11). In addition to textural differences between congelation ice and platelet ice, there are also sub-structural differences. The cellular sub-structure of congelation ice in the upper layer of the fast ice (Fig. 8a) contrasts with platelet ice, which has inclusions but not in any well-ordered structure (Fig. 8b). In platelet ice the inclusions appear to be located at the platelet crystal boundaries, leaving the platelets themselves free of inclusions. This is consistent with dentritic growth during suspension in the water column. On the other hand, the congelation ice found in the interstices between the platelets was characterized, not unexpectedly, by the typical sub-structure of ice plates interposed between brine layers (Fig. 8c).

Fig. 11. Ice-texture photographs and fabric diagrams for horizontal sections of platelet ice from core RS-26,1.87 m (a), core RS-23, 1.65m (b) and core RS-19, 1.25m (c). Scale divisions are at 5mm intervals.
For the sake of clarity in the following we will refer to the congelation ice that forms in the platelet interstices as interstitial congelation ice, reserving the term congelation ice for the platelet-free congelation ice of the upper ice layers. When fabric diagrams were compiled according to the ice type, a number of interesting features were revealed, providing information on the organization of the platelets as they gather at the base of the surface ice-cover.
The interstitial congelation-ice data points in Figure 11a are randomly distributed in the horizontal plane, whereas the platelet data points are scattered about the Schmidt net in a more random fashion. In other cases, the arrangement of the platelets was more ordered. In Figure 11b, although the interstitial congelation ice shows a horizontal girdle similar to that of Figure 11a, the c-axes of the platelet crystals also lie in a girdle that, although close to the perimeter, is not in the horizontal plane. This indicates a latticework comprised of platelets arranged with their flat faces (0001) oriented near to, but not exactly vertical, i.e. c-axes consistently oriented a few degrees from the horizontal. Conversely, the c-axes of the platelet ice crystals in Figure 11c show a rough clustering in the centre of the Schmidt net, indicating the c-axes are oriented close to vertical. This indicates the platelets are arranged with their flat faces approximately parallel to the base of the surface ice. The causes of the variability in these arrangements are not known but clearly the platelets do not always accumulate in a random or even a similar manner.
Fabric and Plate Width as a Function of Ice Type and Depth
Fabric
At two of the sampling sites, the s 0 values have a relatively narrow range of 20 ° (20-40 °), indicating that the c-axis alignments are moderate to weak throughout the entire core (Fig. 12a, sites 29 and 31 ). However, this is not typical as the remainder of the profiles show large variations both from core to core and with depth in the ice (Figure 12b shows several examples). An analysis of the full fast-ice data set also reveals significant differences between the s 0 values in congelation ice and those in interstitial congelation ice. This is clearly shown in Figure 13: the congelation-ice values are positively skewed, with 40.6% of the values in the strongly aligned class 0-14.9 °, and 31.2% of values in the moderately aligned class 15-29 °; on the other hand, the interstitial congelation-ice values have a more normal distribution, with 71.9% of the So values in the weak/non-aligned class (so values >30 °). Also, the mean s 0 value for platelet-free congelation ice is almost 10 ° lower than that of interstitial congelation ice (Table 4).
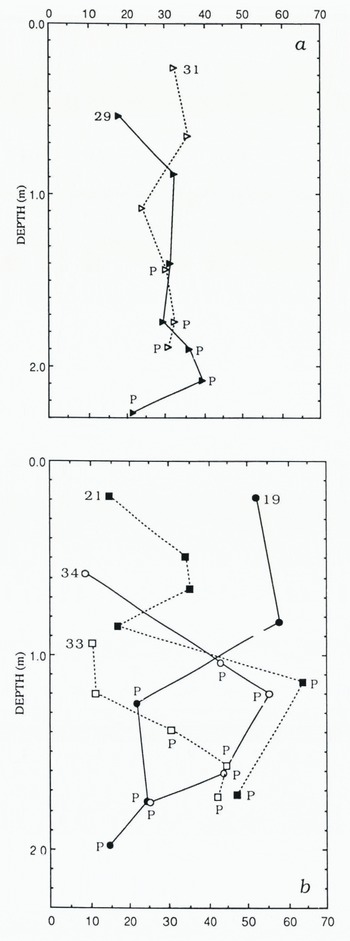
Fig. 12. Variations in congelation ice s 0 values (c-axis ⊳ standard deviations) with depth. Data points with no symbol are for platelet-free congelation ice, and those with a P denote congelation ice in the platelet-ice interstices (including congelation|platelet ice as well as platelet ice).
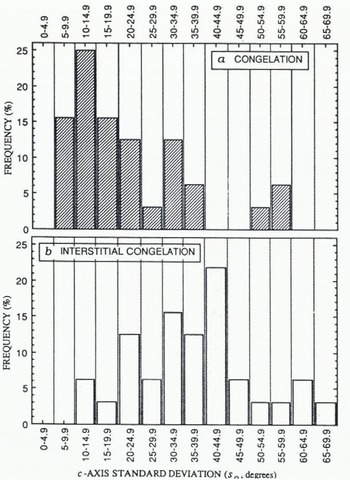
Fig. 13. Frequency histograms of SQ values in platelet-free congelation ice (top) and in the interstitial congelation ice (bottom). The interstitial congelation-ice data includes s 0 values from congelation/platelet ice as well as platelet ice.
Table 4. Summary of statistics (range, mean and standard deviations) for c-axis standard deviations (s0) and brine-layer spacings (a0) in congelation ice and interstitial congelation ice. Numbers in parentheses indicate the number of ice samples on which measurements were made

The McMurdo Sound So data are similar to those in Arctic Alaska fast ice. Reference Weeks and GowWeeks and Gow (1978, Reference Weeks and Gow1980) reported an So range of 6-63 ° with 45% and 43.8% of the values in the strongly aligned class (0-14.9 °) and moderately aligned class (15-29.9 °), respectively. Although Reference Gow, Ackley, Weeks and GovoniGow and others (1982) did not define strongly aligned and moderately aligned in absolute terms, they reported that 60% of their sampling sites in McMurdo Sound contained strong to moderately aligned congelation ice. As noted earlier, platelet ice has yet to be reported in the Arctic.
Plate Width
Profiles of plate widths (a 0) as a function of depth are shown in Figure 14. The range and pattern of a 0 variations in the upper congelation-ice layers often differ from core to core. For example, in cores RS-24 and RS-31 the forms of the a 0 profiles and narrow ranges of a 0 values are similar, but they contrast with the more variable a 0 profiles and wider range of values in cores RS-21 and RS-29 (Fig. 14a). In addition, the variability of the previous four examples contrasts with the a 0 profiles in cores RS-19, RS-27 and RS-28, which all have similar, reverse W-shape profiles and values (Fig. 14b).
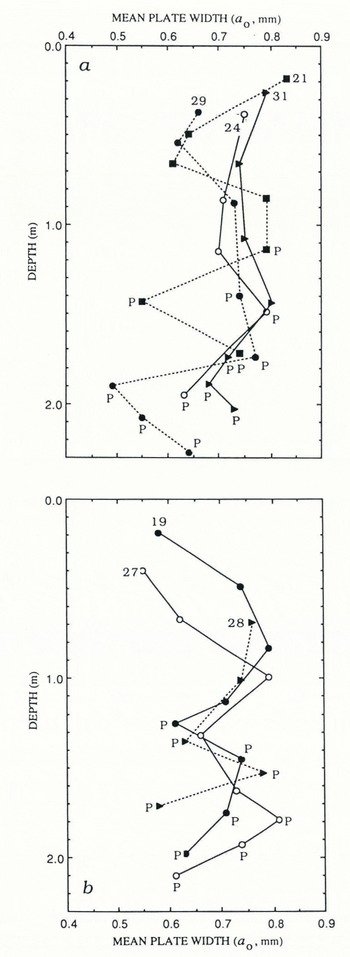
Fig. 14. Variations in congelation-ice a0 values (brine-layer spacing) with depth. Data points with no symbol are for platelet-free congelation ice, and those with a P denote congelation ice in the platelet-ice interstices (including congelation/platelet ice as well as platelet ice).
Analysis of the a 0 data shows there is no significant difference between the mean a 0 value in the congelation ice and that in the interstitial congelation ice (Table 4). A frequency histogram shows the near-normal distribution of a 0 values in congelation ice and interstitial congelation ice, with each peaking in the class interval 0.65-0.74 mm (Fig. 15).
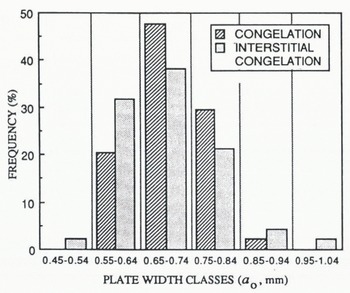
Fig. 15. Frequency histogram of a0 values in platelet-free congelation ice and in the congelation ice in platelet interstices (including congelation|platelet ice as well as platelet ice).
The McMurdo Sound fast-ice a0 profiles illustrated by Reference PaigePaige (1966, fig. 15) differ from those in Figure 14, but the range of a 0 values (0.4-1.0 mm) reported by Paige is very close to that inTable 4. The McMurdo Sound fast-ice a 0 values are also similar to those reported in Arctic fast ice. Reference Weeks and HamiltonWeeks and Hamilton (1962) reported a 0 values of 0. 58-0.71 mm in young fast ice in early winter. Reference Gow and WeeksGow and Weeks (1977) reported a mean a 0 value of 0.7 mm and a range of 0.62-0.84 mm, and Reference Nakawo and SinhaNakawo and Sinha (1984) reported a range of 0.4-0.9 mm, both in 2 m thick fast ice, i. e. similar to the McMurdo Sound fast ice.
Discussion
There is now ample field and laboratory evidence that the alignment of congelation-ice c-axes is due to water-current control of dendritic crystal growth at the ice-sea-water interface where the c-axes of the ice plates become aligned with the current (Reference Weeks and GowWeeks and Gow, 1978, Reference Weeks and Gow1980; Reference LanghorneLanghorne, 1983; Reference Nakawo and SinhaNakawo and Sinha, 1984; Reference Langhorne and RobinsonLanghorne and Robinson, 1986; Reference Stander and MichelStander and Michel, 1989). Since all our cores showed moderate to strong alignments in the upper congelation-ice layer, there must be current effects on congelation-ice-crystal growth prior to platelet-ice accretion in the McMurdo Sound fast ice. However, unlike Reference Gow, Ackley, Weeks and GovoniGow and others (1982), we cannot infer the current directions because our cores were not oriented with respect to a fixed azimuth.
Although the McMurdo Sound congelation-ice s 0 values are similar to those observed in Arctic fast ice, and can be considered strong evidence for water-current control of crystal growth, the s 0-depth profiles differ significantly from those observed in Arctic fast ice and in laboratory experiments. The latter are invariably characterized by a steady increase in the degree of alignment as depth increases (Reference Weeks and GowWeeks and Gow, 1978; Reference LanghorneLanghorne, 1983; Reference Langhorne and RobinsonLanghorne and Robinson, 1986). The fluctuating s 0 values in the McMurdo Sound congelation ice, covering the spectrum from strongly aligned to non-aligned, suggest changing current velocities immediately below the fast ice. Moreover, the differences in the s 0 profiles from core to core (Fig. 12) suggest that these changes are not uniform in time throughout McMurdo Sound.
If water currents are responsible for controlling crystal growth and c-axis alignments in platelet-free congelation ice, then the s 0 values in the interstitial congelation ice indicate reduced current speeds and directional variability through the latticework of accumulated platelet-ice crystals at the base of the fast ice. Although the platelet accumulations are clearly porous, as evidenced by the interstitial congelation ice, it is reasonable to assume that they act like baffles to reduce the speed and vary the direction of currents at the interface. Consequently, the growth of the interstitial congelation-ice plates will be less subject to water-current control. The few high s 0 values in interstitial congelation ice are primarily in congelation/platelet ice with lower numbers of accumulated platelets (Fig. 9). These presumably did not affect the interfacial currents to the degree that occurred in the more densely packed platelet accumulations.
Field and laboratory investigations have shown that a 0 values are dependent on two factors. First, plate widths are inversely related to macroscopic growth rates, i.e. plate widths increase as growth rates decrease (Reference Lofgren and WeeksLofgren and Weeks, 1969; Reference Nakawo and SinhaNakawo and Sinha, 1984). Secondly, it has also been shown that plate widths are affected by the orientation of a crystal relative to the current, with a0 values increasing when the c-axis of a crystal is in the favored direction for crystal growth, i.e. parallel to the current direction (Reference Nakawo and SinhaNakawo and Sinha, 1984; Reference Langhorne and RobinsonLanghorne and Robinson, 1986).
The variability in the So data (Fig. 12) suggests that the c-axes do not remain long enough in the favored direction for growth for a concurrent increase in plate widths to occur. A plot of a 0 against s 0 appears to support this premise, since it shows that a0 is independent of s 0 in both the congelation ice and interstitial congelation ice (Fig. 16). The poor a 0–s 0 relationship in the interstitial congelation ice is not surprising, if, as we have already suggested, the accumulations of platelets reduce the ability of the under-ice currents to effect selective crystal growth.
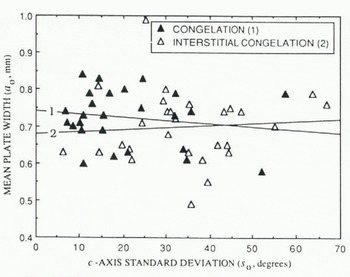
Fig. 16. Scatter plot and regression lines of the dependence of plate widths (a0) on c-axis standard deviations (s0) in congelation ice and interstitial congelation ice. In the congelation ice, the regression line (1) is described by the equation a0 = 0.74 mm - 0.00086s0 (r = 0.15). In interstitial congelation ice, the regression line (2) is described by the equation a0 = 0.68mm + 0.00057s0 (r = 0.026). Neither equation is statistically significant at any probability level.
The other primary control of the plate widths in the McMurdo Sound fast ice is the macroscopic growth rate of the ice sheet, a value controlled by the rate that heat is conducted upward through the ice and away from the growing interface. Factors influencing heat conduction through ice, and thus the plate widths, include ice thickness, surface climate, snow cover and basal water temperature. As a general rule, the plate widths will increase as the ice thickens and growth rates decrease. For example, in McMurdo Sound, Reference PaigePaige (1966, fig. 15) found that plate widths increased steadily as ice thickness increased and presumably as growth rates decreased. Our a 0 profiles (Fig. 14) are quite unlike those reported by Reference PaigePaige (1966), suggesting that, in the samples we examined, ice thickness-related growth-rate changes were not a primary factor in plate development.
Ice growth and plate-width measurements in fast ice off the North Slope of Alaska and in Eclipse Sound, eastern Canadian Arctic, show that plate widths can vary considerably with depth (Reference Gow and WeeksGow and Weeks, 1977; Reference Nakawo and SinhaNakawo and Sinha, 1984) and that this variation can be explained by changes in the surface meteorological conditions. Air temperatures above the ice vary considerably throughout the winter (e.g. Fig. 2), and their effect on the ice temperature and heat-conduction rates will be influenced by the depth of the snowpack. In the case of the McMurdo Sound fast ice, the variability in the a 0 profiles with depth and from core to core (Fig. 14) suggests that growth patterns varied considerably in space and time, probably due to fluctuations in surface temperatures (Fig. 2) and variable snowpack depths on the ice.
The oceanic heat flux also influences heat conduction, and is particularly pertinent to the mean a0 values found in the congelation and interstitial congelation ice. Since the interstitial congelation ice occurs in the lower part of the fast ice, other things being equal, one would expect the plate widths to increase with increasing ice thickness and reduced heat-conduction rates. However, we have noted that, on average, the plate widths in the lower part remain the same as those in the upper part of the fast ice (Fig. 13). From this we can infer that the average growth rates remained unchanged from those of the ice above. This result could be explained by a significant decrease in air temperature during the late austral spring, but this is not apparent in the temperature records (Fig. 2). A more likely explanation is that an accumulation of growing platelet crystals ahead of the advancing congelation interface will virtually guarantee that the water within that layer is at, or even below, the freezing point. The flow of supercooled water from beneath the ice shelf changes the sign of the oceanic heat flux from positive to negative, resulting in platelet growth below the base of the continuous ice sheet. Consequently, the growth rate of the continuous ice sheet increases because less heat has to be removed from the platelet-rich region than from platelet-free water for the base of the congelation ice to advance a given distance.
The similarity between earlier McMurdo Sound a 0 data (Reference PaigePaige, 1966) and our data indicates that, regardless of the controlling factors, there was very little difference between the fast-ice congelation growth rates in winter 1965 and winter 1990. Likewise, the similarity between the McMurdo Sound a 0 data and Arctic data suggests that Arctic and Antarctic fast-ice growth rates do not differ significantly.
Although there may be no significant difference between Antarctic and Arctic fast-ice growth rates, the comparison of the McMurdo Sound and Alert ice-thickness records indicates that Antarctic fast ice reaches a greater maximum thickness than Arctic fast ice, and in fewer total freezing degree-days. We suggest that this phenomenon is entirely due to the accretion of platelets against the base of the fast ice and their subsequent solidification. As noted above, the platelets reduce the interstitial water temperatures, and the growth rates are effectively increased because less heat has to be removed from the platelet-rich water than from platelet-free water for a given thickness of congelation ice to form. The resultant negative oceanic heat flux in the McMurdo Sound fast-ice zone would also account for the greater ice thickness there than in the western Ross Sea pack ice.
Conclusion
On the basis of ice-core analysis at the end of the growth season, we have shown how the land-fast sea-ice cover in McMurdo Sound, Antarctica, develops through congelation-ice growth followed by platelet-ice-crystal growth and consolidation. Measurements of congelation-ice and platelet-ice textures, fabrics and sub-structure have revealed previously undocumented information about this dual development process, particularly the nature of the platelet-ice latticeworks and their consolidation by interstitial congelation-ice growth. The negligible or even negative oceanic heat flux associated with platelet-ice formation in McMurdo Sound explains why McMurdo Sound fast ice is thicker than Ross Sea pack ice, and also why it reaches a greater thickness than Arctic fast ice grown in a similar polar marine climate.
Although the ice-core evidence is indirect, the coincidence between the amount and pattern of platelet-ice occurrence in the cores and previously documented supercooled, surface-water currents in McMurdo Sound adds support to previous suggestions that in some cases ice-platelet growth may be related to low-density sea-water flow from beneath thick floating glacial ice masses, in this case McMurdo Ice Shelf. As yet, this process remains poorly understood and we suggest that only concurrent oceanographie and glaciological measurements during the platelet-ice-growth season will improve our understanding.
Acknowledgements
This work was supported by the Ocean and Climate Systems Program of the Division of Polar Programs of the U.S. National Science Foundation under grant No. DPP-8915863. The officers and crew of the icebreaker USCGC Polar Sea welcomed us aboard and assisted us with our work. The helicopter pilots and crews of the U.S. Navy VXE-6 Squadron and the USCGC Polar Sea Aviation Detachment flew us around McMurdo Sound and cheerfully assisted us with our observations and measurements. Temperature data for Marble Point, McMurdo Station and Scott Base were made available by C. Stearns, University of Wisconsin, the Meteorological Office, Naval Support Force Antarctica and the New Zealand Antarctic Research Programme. The ice-runway thickness data were supplied by the Public Works Office, Naval Support Force Antarctica.
The accuracy of references in the text and in this issue is the responsibility of the authors, to whom queries should be addressed.


