


1. Introduction
The environment of the Tibetan Plateau (TP) has experienced rapid warming over the past several decades, which has caused glacier retreat and mass loss (Bolch and others, Reference Bolch2012; Yao and others, Reference Yao2012). This has had important consequences for the global hydrologic cycle (Immerzeel and others, Reference Immerzeel2020). Field surveys can measure glacier dynamics directly with high accuracy at different spatial and temporal resolutions. Owing to the large extent and difficult access to high mountainous terrain, field surveys over long periods have been limited to accessible portions of mountain glaciers (Shangguan and others, Reference Shangguan2010; Yao and others, Reference Yao2012). Therefore, remote sensing techniques provide an efficient way to monitor glacier dynamics in inaccessible areas with large-scale spatial coverage, including glacier geometry, equilibrium-line altitude (ELA), and mass balance (Sakai and others, Reference Sakai2010; Bolch and others, Reference Bolch2012; Gardelle and others, Reference Gardelle, Berthier and Arnaud2012; Kääb and others, Reference Kääb, Berthier, Nuth, Gardelle and Arnaud2012; Nuimura and others, Reference Nuimura2015; Paul and others, Reference Paul2015; Brun and others, Reference Brun, Berthier, Wagnon, Kääb and Treichler2017; Zhang and others, Reference Zhang2017; Zhou and others, Reference Zhou, Li, Li, Zhao and Ding2018).
The changes in ice flow measured for all glaciers in High Mountain Asia indicated that glaciers show sustained slowdown concomitant with ice thinning over the period of 2000–2017 (Dehecq and others, Reference Dehecq2019). Based on remote sensing data and field measurements, glaciers in southeastern Tibet, classified as temperate, showed a substantial reduction in area and length from 1980 to 2015, as well as a mass deficit (Yang and others, Reference Yang2008, Reference Yang2013; Yao and others, Reference Yao2012; Wu and others, Reference Wu, Liu, Bao and Wang2017, Reference Wu2018). Based on TerraSAR-X data and published Landsat velocities, an average slowdown of 51% was found between 1999/2003 and 2013/2014 in the eastern Nyainqentanglha Range (Neckel and others, Reference Neckel, Loibl and Rankl2017). While this pronounced change in ice flow came from five debris-covered valley glaciers, it does not represent large-scale glacier response to climate warming. For a steady-state glacier, mass flux through a cross-section equals the mass balance upstream of that section, and ice fluxes decrease in adjustment within negative mass-balance regimes (Heid and Kääb, Reference Heid and Kääb2012). Mass-balance estimates have been strongly negative in southeastern Tibet over recent decades, and a number of velocity measurements have been made for monsoon temperate glaciers (Zhang and others, Reference Zhang, Fujita, Liu, Liu and Wang2010; Neckel and others, Reference Neckel, Loibl and Rankl2017; Dehecq and others, Reference Dehecq2019), but we know little about their spatiotemporal variations with large-scale spatial coverage. Therefore, in this study, we attempt to observe the spatiotemporal characteristics of monsoon temperate glacier surface velocity.
In this study, we present the spatiotemporal characteristics of glacier surface velocity in the eastern part of the Kangri Karpo Mountains (KKM: Fig. 1), Nyainqentanglha Range, over the period of 1988–2019. Our study region (29°0'–29°30'N, 96°20'–97°10'E) contains 1320 glaciers with a total area of 2655.2 km2. Influenced by the Indian monsoon, KKM is the most humid region of the southeastern TP. The glaciers of KKM are classified as monsoon temperate glaciers (Mi and others, Reference Mi, Xie, Luo and Feng2002) and are fast flowing and extremely sensitive to climate change due to their high mass turnover rates (Su and Shi, Reference Su and Shi2002). KKM glaciers have lost ~25% of their area and on average 0.5 m w.e. a−1 of mass between 1980 and 2015 (Wu and others, Reference Wu2018).
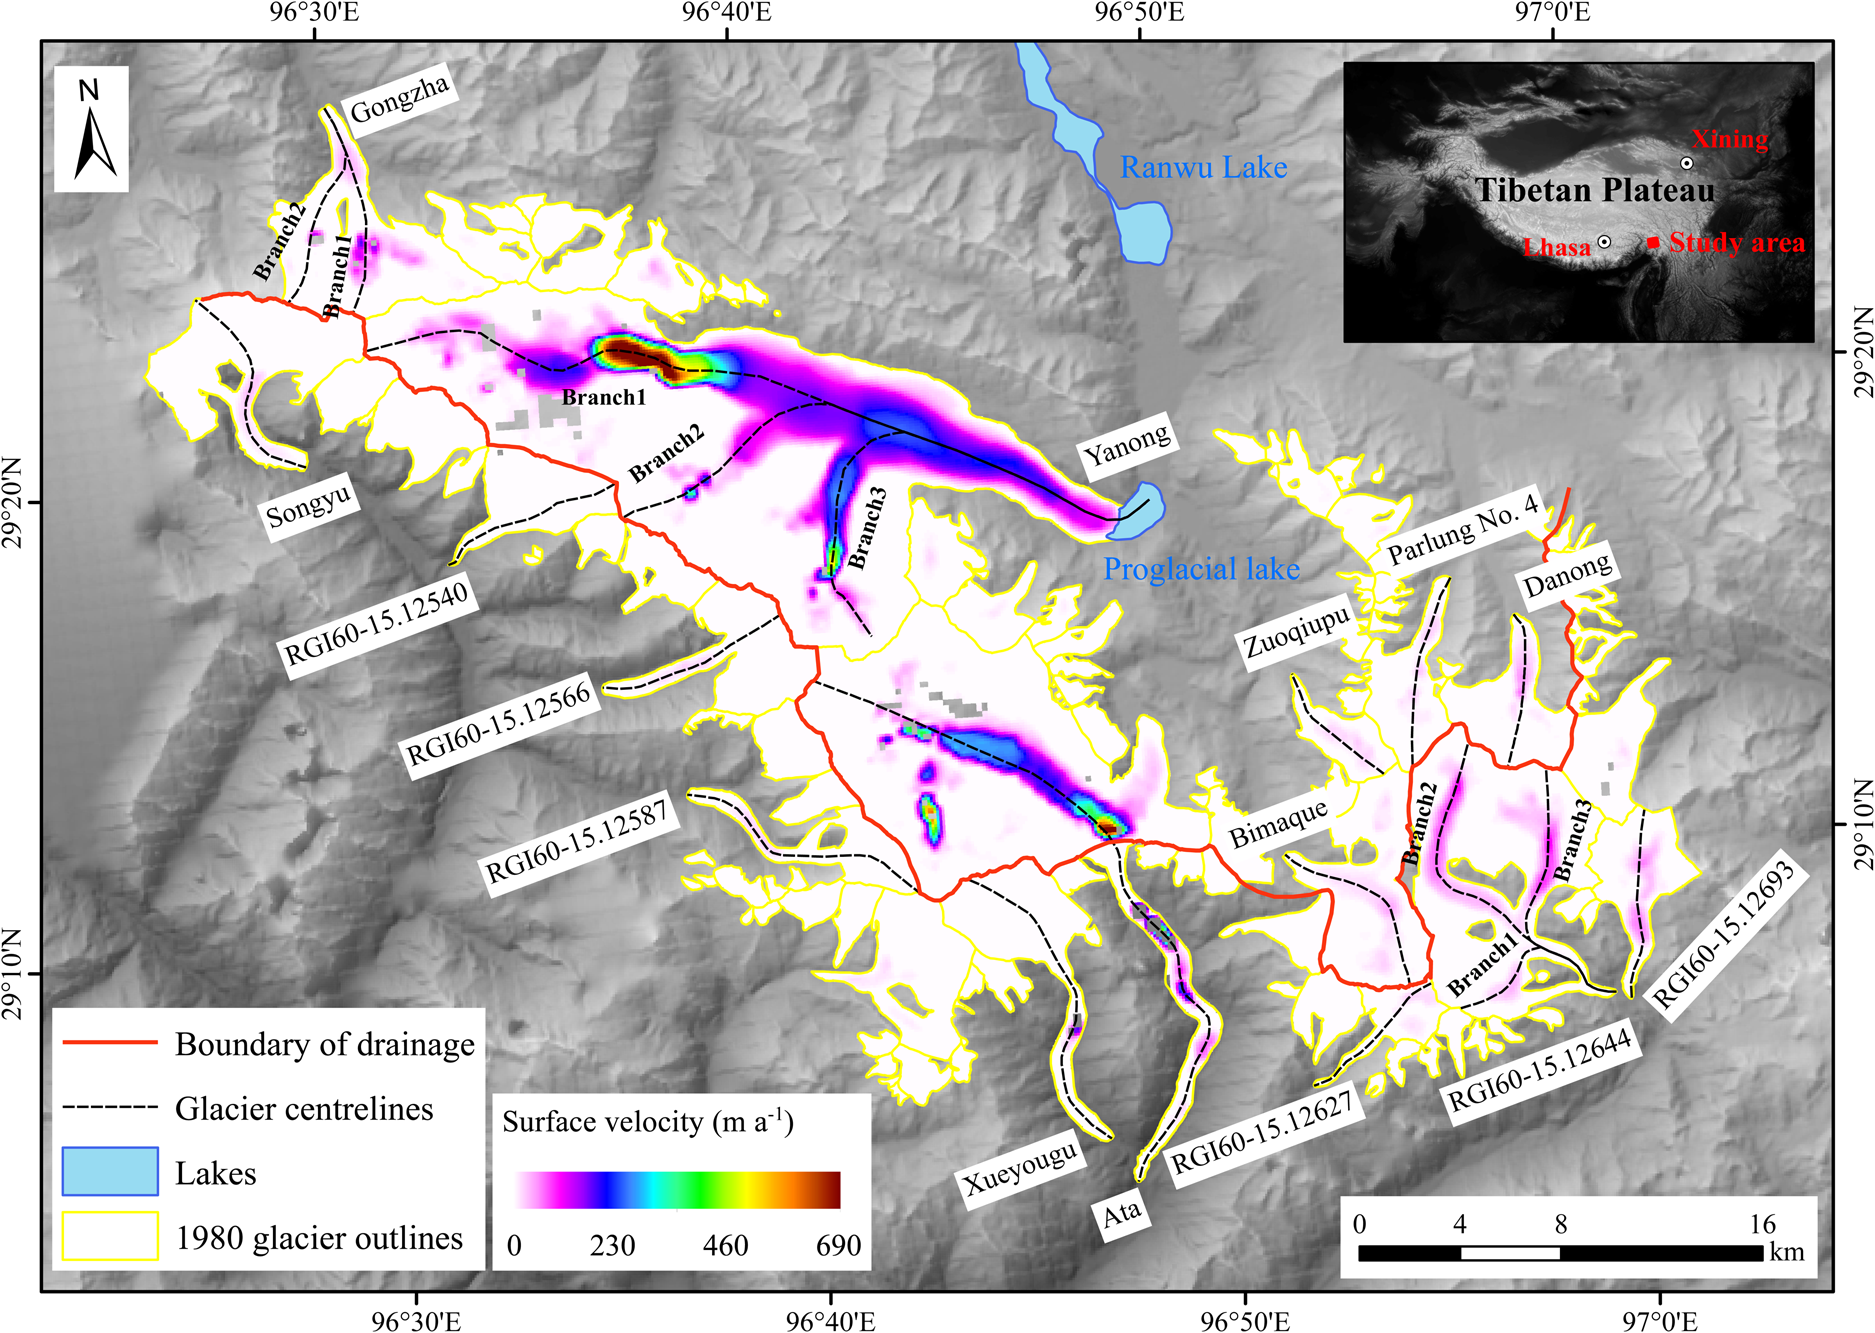
Fig. 1. Glacier surface velocities of Kangri Karpo Mountains, averaged over the period 1988–2019, overlain onto a SRTM C-band DEM. The location of the study area is shown in the inset. The 1980 glacier outlines are from the First Chinese Glacier Inventory and the SRTM C-band DEM from the USGS (http://glovis.usgs.gov).
2. Methods
To generate glacier surface velocity maps, we processed eight Landsat Thematic Mapper (TM) images from December 1987 to December 2004 as well as seven Landsat Operational Land Imager (OLI) images from January 2014 to December 2019 (Table S1).
In our study, an application for correlation of Landsat imagery, COSI-Corr (Co-registration of Optically Sensed Images and Correlation; Leprince and others, Reference Leprince, Barbot, Ayoub and Avouac2007), was used to observe glacier surface displacement in the KKM. COSI-Corr, an IDL module for the remote sensing platform ENVI© by RSI, can be downloaded from the Caltech Tectonics Observatory website (http://www.tectonics.caltech.edu). The application can process ASTER, SPOT, Pleiades, QuickBird, and Landsat satellite images, and has been proven to be an effective method for measuring glacier surface displacement from optical satellite imagery (Scherler and others, Reference Scherler, Leprince and Strecker2008; Heid and Kääb, Reference Heid and Kääb2012; Lv and others, Reference Lv2019).
Before implementing the phase-correlation procedure, the appropriate band of Landsat imagery was selected. This selection is difficult because it depends on the sensor and glacier surface conditions (e.g. debris cover or clean ice). Due to intense reflectance of snow and clean-ice, the visible bands 1–3 (blue, green, and red) have low performance. Previous studies showed that band 4 (near-infrared) and band 5 (mid-infrared) give the best results for the Kunlun Mountain and Karakoram Mountain (Dehecq and others, Reference Dehecq, Gourmelen and Trouve2015). In the KKM, ~95% of the glacier area is clean-ice, only 5% of the glacier area is covered by debris (Wu and others, Reference Wu2018). Hence, the near-infrared band of a Landsat TM image has greater contrast in the KKM and gives better phase-correlation results. Thus, we used the near-infrared band of Landsat TM images for all surface velocity extraction. For Landsat OLI imagery, the 15 m panchromatic band was used for all image pairs, which generally provides better results than 30 m resolution images.
Next, horizontal ground displacements were measured from sub-pixel correlation of multi-temporal images. Image correlation was achieved with an iterative, unbiased processor that estimates the phase plane in the Fourier domain (Scherler and others, Reference Scherler, Leprince and Strecker2008). The correlation step yields three images, including the horizontal ground displacement component (East–West and North–South) and signal-to-noise ratio (SNR) for each measurement, with search-area windows of 24 × 24 to 64 × 64 pixels (pattern size) and 32 × 32 to 128 × 128 pixels (Quincey and others, Reference Quincey, Glasser, Cook and Luckman2015). The horizontal ground displacements were combined to obtain the magnitude and direction of glacier surface displacement. A SNR threshold of >0.9 was chosen for confidence in image matching. Image matches that deviated from the dominant glacier flow direction by >30° and extreme values (i.e. exceeding a stipulated maximum threshold in each dataset) were removed to improve the accuracy of glacier surface displacement (Quincey and others, Reference Quincey, Glasser, Cook and Luckman2015).
The aforementioned displacement, obtained from the sub-pixel correlation, represents the displacement during the interval time of an image pair. To acquire interannual glacier surface velocity, the displacement was calculated using the following equation:

where V Glacier surface is the glacier surface velocity, D Image pair is the displacement measured between each image pair, Ti is the time interval of the image pair in days, and Ty is the number of days in the year, a constant of 365 or 366.
The uncertainties of glacier velocity were reflected by the residual value in non-deformation areas. The residual error in a non-glacier area without rugged topography (with slopes <5°) is used to calculate the uncertainty σ:
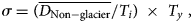
where $\overline {D_{{\rm Non}-{\rm glacier}}}$ is the mean displacement in the non-glacier area without rugged topography, Ti is the time interval of the image pair in days, and Ty is the number of days in the year, a constant of 365 or 366. However, uncertainty in feature tracking can also arise from other sources. Owing to the variable surface conditions of the glacier (e.g. debris cover or clean ice) and the relatively small size of several glaciers, autocorrelation of the image pair is an inevitable error in the KKM. To avoid the effect of autocorrelation, Gaussian low path filtering was used to smooth the velocity map (Lv and others, Reference Lv2019). The longer the temporal separation, the smaller the error in the displacement estimate, but the poorer the correlation between the image pair. This is attributable to changes in the scattering properties of the glacier surface (Yasuda and Furuya, Reference Yasuda and Furuya2013). Thus, image pairs separated by ~365 days were used to measure interannual glacier surface velocity. The uncertainties in interannual glacier surface velocity range from 15 to 30 m a−1 and depend on the time separation between the images (Table S1). The distribution of overall uncertainty in glacier surface velocity is presented in Figure 2.
Fig. 2. The distribution of the overall uncertainty in glacier surface velocity overlain onto a SRTM C-band DEM. The 1980 glacier outlines are from the First Chinese Glacier Inventory and the SRTM C-band DEM from the USGS (http://glovis.usgs.gov).
3. Results
Based on Landsat images, the surface velocity of monsoon temperate glaciers in the KKM during 1988–2019 was heterogeneous (Fig. 1). The surface velocity of the KKM reached a mean of ~70 ± 28 m a−1 and a maximum of ~690 ± 25 m a−1 over the past 30 years (Table S2). The velocity of a large glacier is higher than that of a small one in the same geographic location with the same topographic conditions. The maximum velocity of more than 600 m a−1 has been measured for the Yanong (191.4 km2 in area and 32.5 km in length) and Ata (13.8 km2 in area and 16.7 km in length) glaciers. The surface velocity of Yanong Glacier over an entire year reached a maximum of ~660 ± 25 m a−1 between 20 and 23 km up-glacier from the terminus over the past 30 years. The altitude of maximum velocity in the Yanong Glacier ranges from 4900 to 5200 m a.s.l., which is consistent with the ELA of 5040 m a.s.l. (Figs 3, 4). The maximum velocity of Ata Glacier was ~690 ± 25 m a−1 between 13 and 15 km up-glacier from the terminus. Large velocity of Ata Glacier can be demonstrated by distinct marking of debris, which originated from a rockfall in the upper section of the glacier (13 km up-glacier from the terminus) in 2015, and moved >450 m between 2015 and 2016 (Fig. S1).
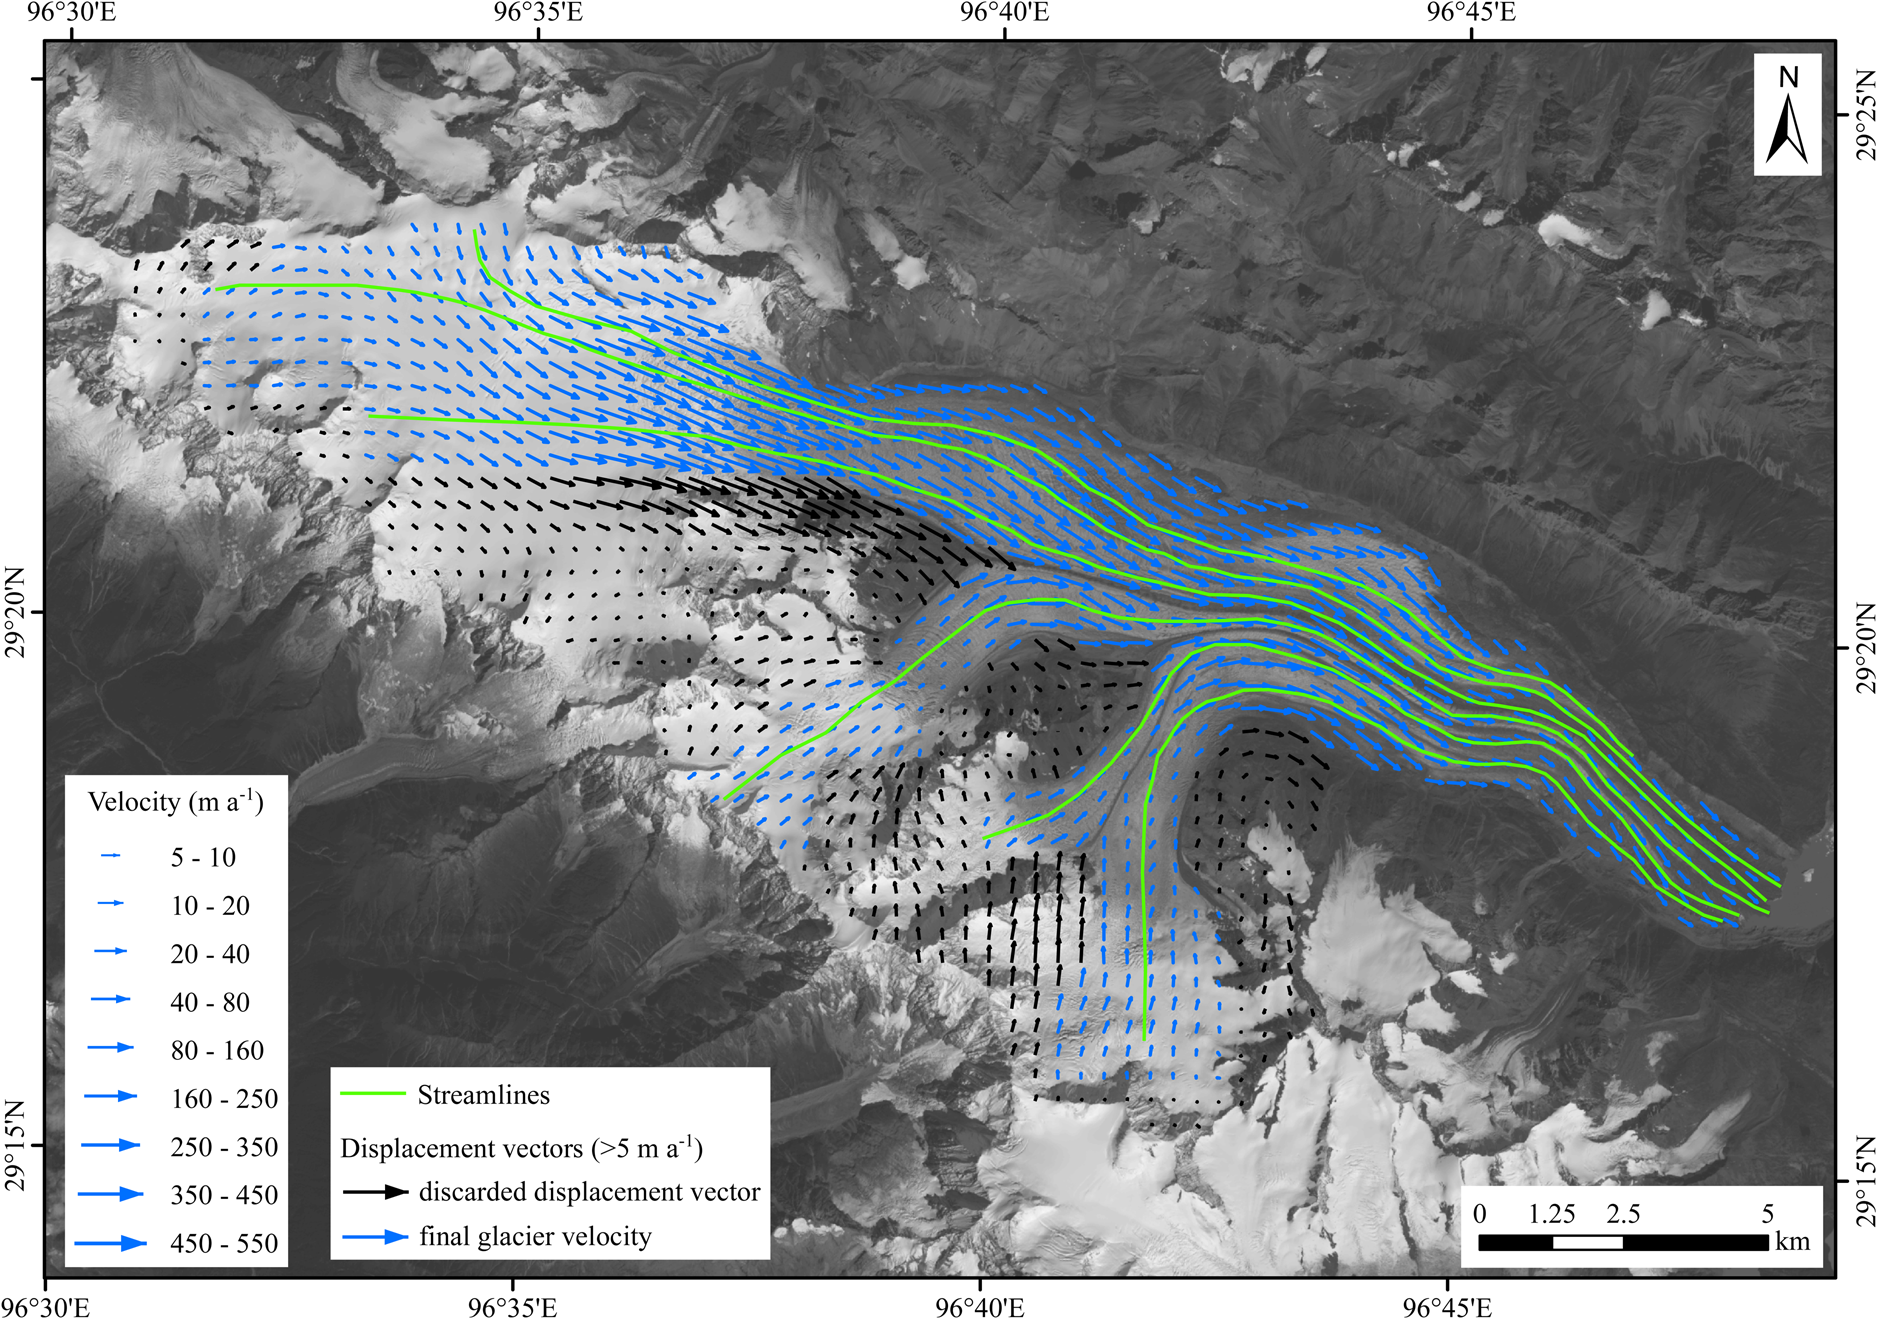
Fig. 3. Velocity field of Yanong Glacier derived from phase-correlation feature tracking during 2014–2015. Landsat image in background is from 6 October 2015. Displacements >5 m a−1 are shown. Through filtering data by direction and magnitude, most miscorrelations and extreme values were discarded. Blue arrows indicate filtered velocity vectors consistent with flow features on glacier surface. Streamlines in green were constructed using retrieved velocity vectors.
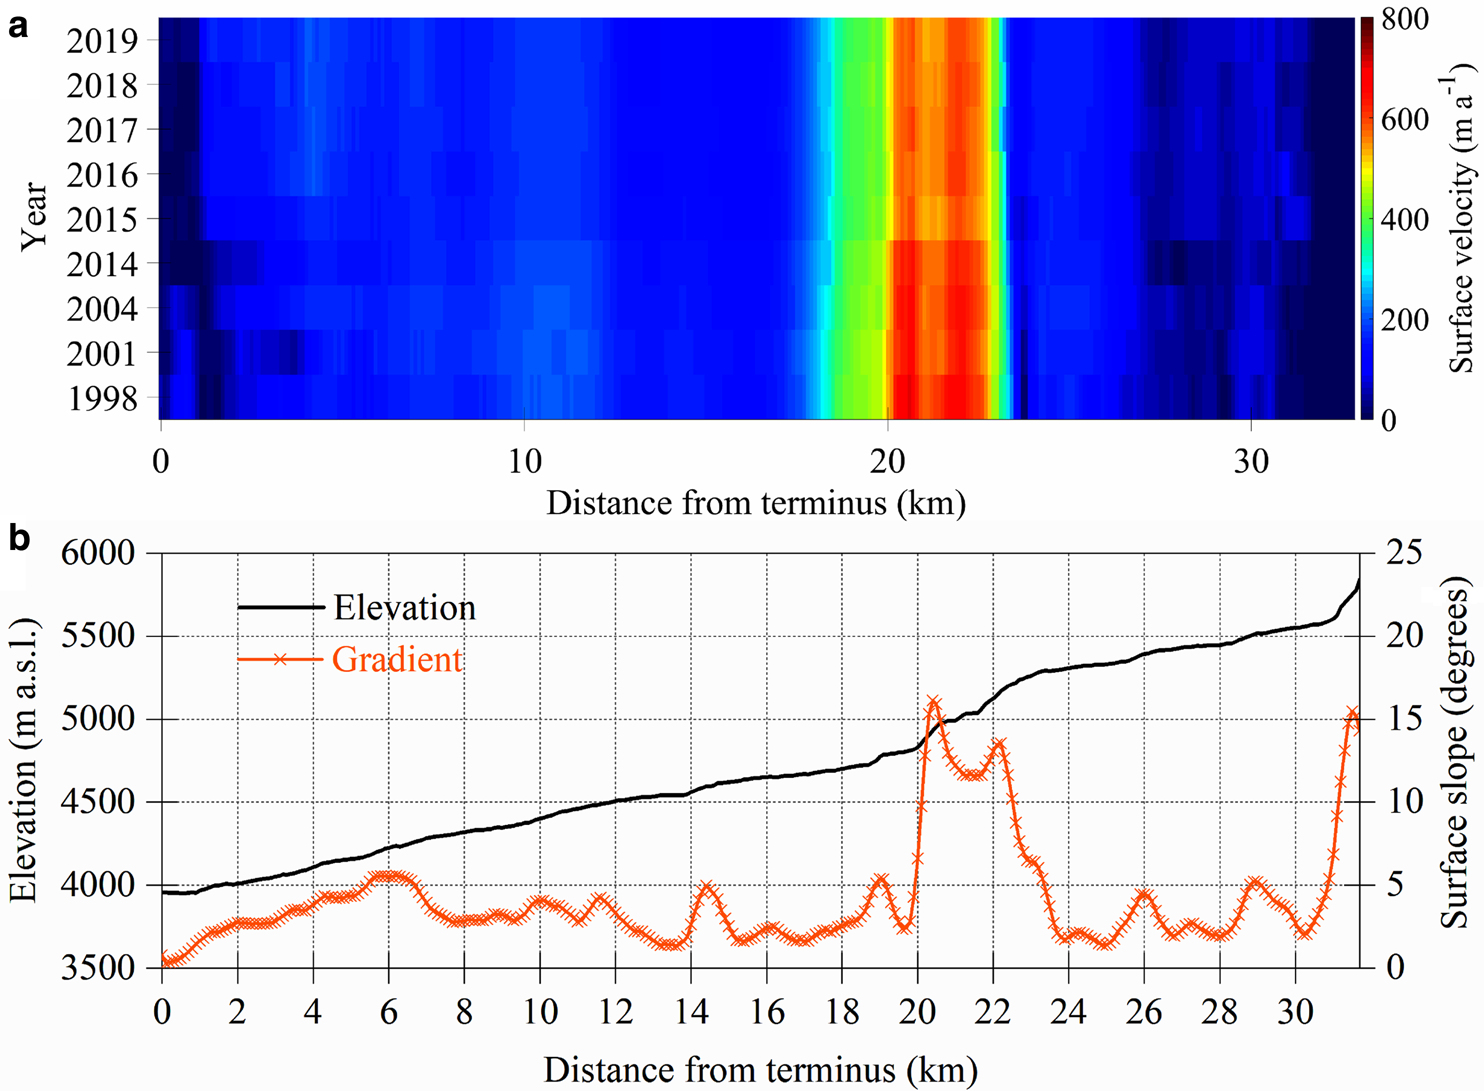
Fig. 4. Centre flowline surface velocity evolution of the first branch of Yanong Glacier. (a) Spatiotemporal evolution of surface velocities between 1988 and 2019. (b) Elevation and surface slope profiles along the flowline.
All glaciers in the study region have large regions with decreased flow speed (Fig. 2), with 76% of the study area flowing slower in 2019 than in 1988 (Fig. 2a). The changes of surface velocities along altitude showed that a significant slowdown was observed below an elevation of 4900 m, while an accelerated ice flow was found at an elevation of 4900–5800 m over the past 30 years. Linear regression shows a clear trend in glacier velocity from 1988 to 2019 (cf. Dehecq and others, Reference Dehecq2019). Despite interannual variability, there was a robust overall trend of −2.3 and 0.6 m a−1 dec−1 at elevations below and above 4900 m a.s.l., respectively. (Fig. 2b). The record of glacier velocity can be divided into two statistically significant periods. The trend of slowdown was −0.1 m a−1 dec−1 during 1988–2000, and then it increased to −0.5 m a−1 dec−1 during 2001–2019. This is consistent with the rate of glacier surface thinning. On average, glaciers experienced a mass loss of 0.24 ± 0.16 m w.e. a−1 over 1980–2000, and then a mass loss of 0.71 ± 0.10 m w.e. a−1 over 2000–2014 (Wu and others, Reference Wu2018) (Fig. 5).
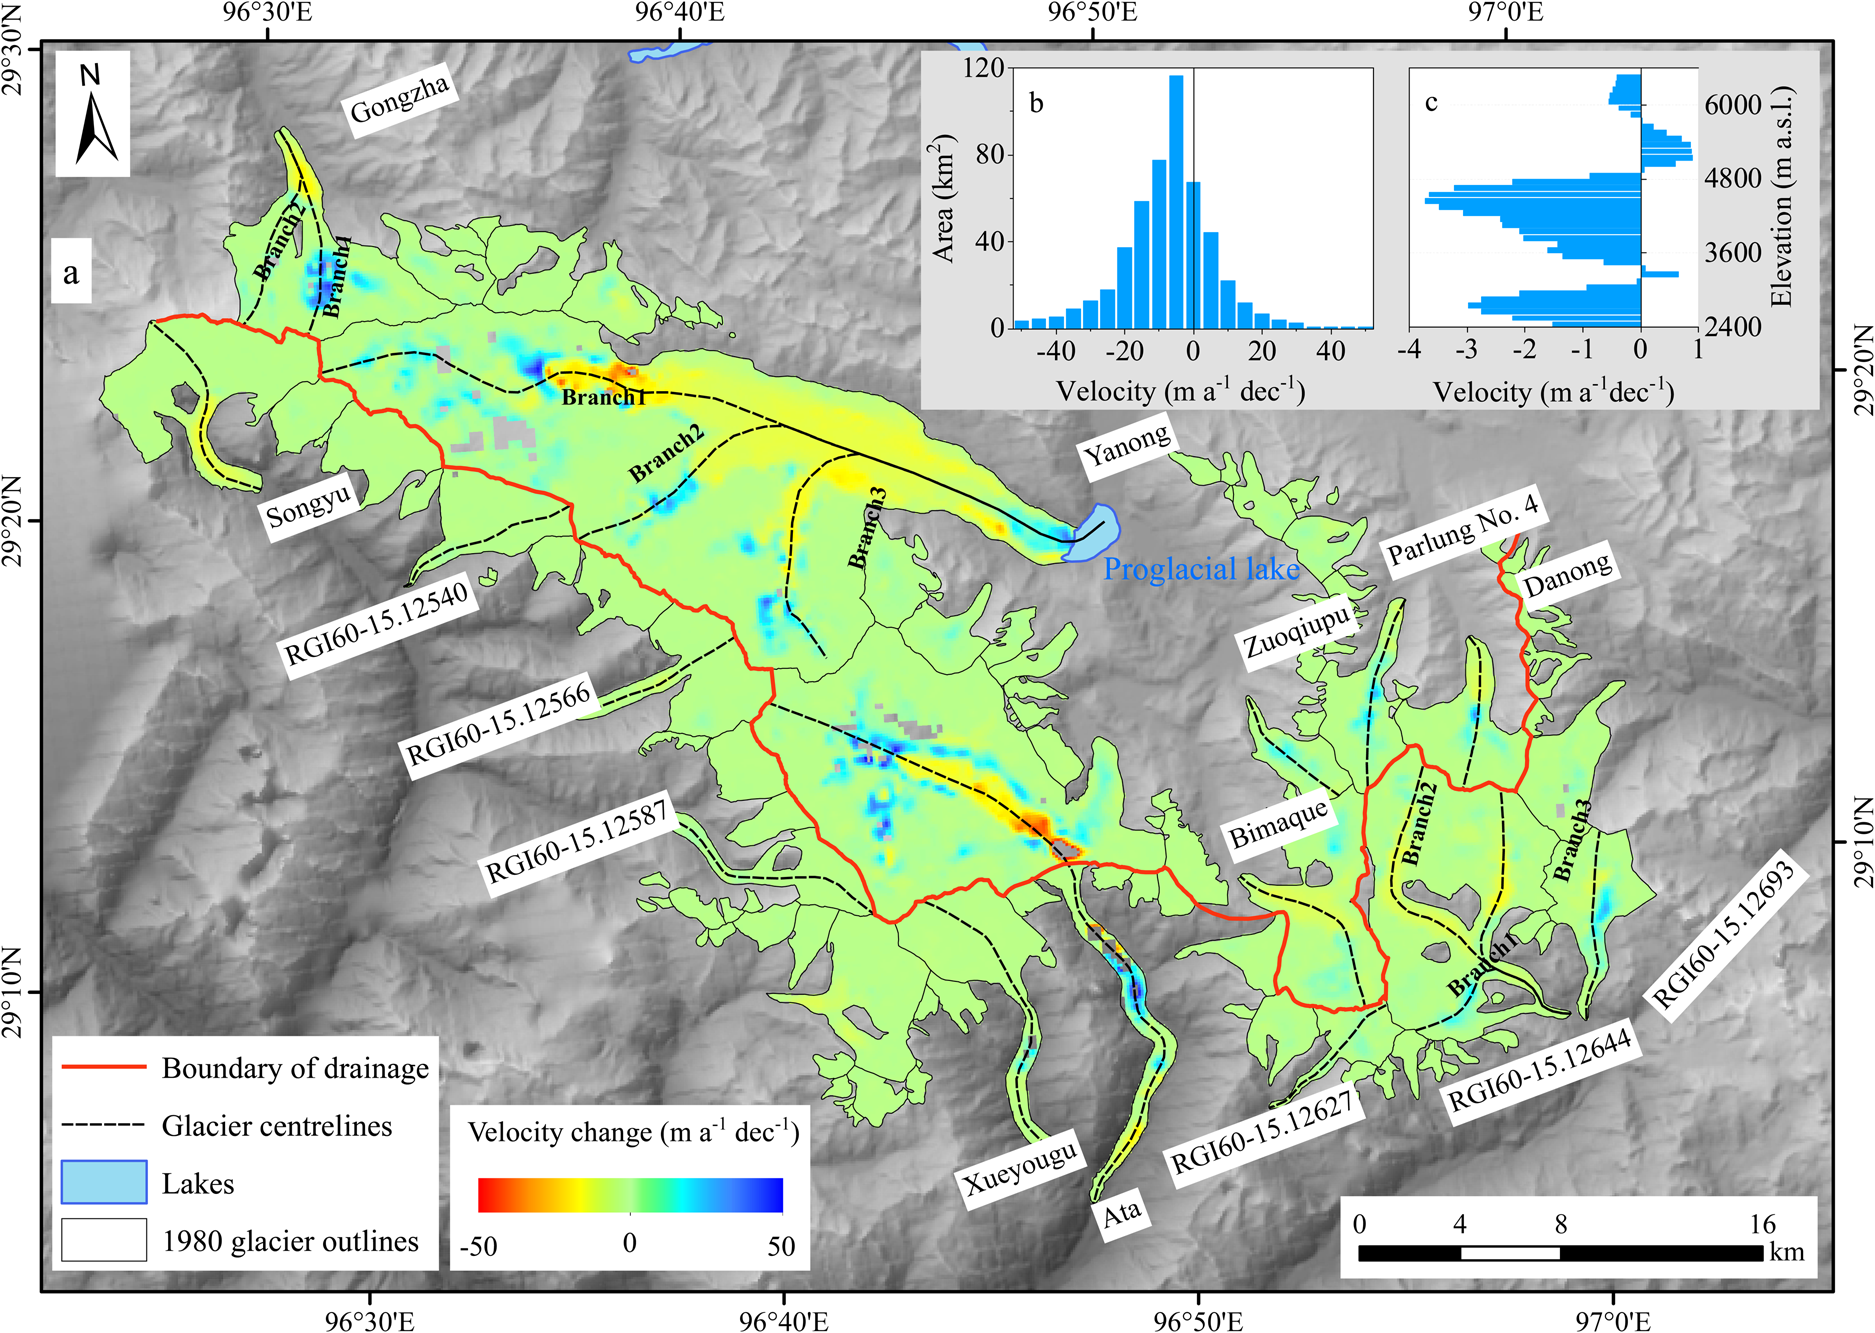
Fig. 5. (a) Change in surface velocity between 1988 and 2019; (b) area distribution of surface velocity changes between 1988 and 2019; (c) median change in surface velocity in each 300 m elevation band between the elevations of 2400 and 6600 m a.s.l. SRTM C-band DEM from the USGS (http://glovis.usgs.gov).
Maximum glacier velocities of the different glaciers are in the order of 30–690 m a−1 and, as expected, the highest velocities occur on the steepest parts of the largest glaciers (Fig. 1). The range in velocity is not significantly different between the north and south slopes of the mountain range: glaciers on the north slope are larger, with an average of 8.9 km2 vs 4.9 km2 for those on the south slope. However, glaciers on the south slope have a steeper gradients and narrower valleys.
4 Discussion and conclusion
The surface velocity of the KKM reached a mean of ~70 ± 28 m a−1 and a maximum of ~ 690 ± 25 m a−1 over the past 30 years, which is in general agreement with the dataset of Inter-Mission Time Series of Land Ice Velocity and Elevation (ITS_LIVE) (Gardner and others, Reference Gardner, Fahnestock and Scambos2019). While the maximum surface velocity in the Yanong Glacier in our study has significant difference with the result from Zhang and others (Reference Zhang, Jia, Menenti, Ren and Zhang2019), who only have the maximum velocity up to 180 m a−1. The main reason for this discrepancy is the different search-area windows in the step of correlation. If the displacement of glacier surface is larger than the search-area windows, an effective result cannot be acquired.
Glaciers in the KKM showed a substantial decrease in velocity between 1988 and 2019, which is in general agreement with recent glacier deceleration in other monsoon temperate glaciers (Zhang and others, Reference Zhang, Fujita, Liu, Liu and Wang2010; Neckel and others, Reference Neckel, Loibl and Rankl2017; Zhang and others, Reference Zhang, Jia, Menenti, Ren and Zhang2019) and other alpine glaciers in regions with high accumulation rates and therefore high mass turn-over (e.g. Alaska; New Zealand: e.g. Burgess and others, Reference Burgess, Forster and Larsen2013; Millan and others, Reference Millan2019). Glaciers in the eastern Nyainqentanglha Mountains experienced deceleration rates varying from 4 to 30% per decade during the period from 1988–1990 to 2014–2016 (Fu and Zhou, Reference Fu and Zhou2019). Slower glacier retreat has also been reported for Hailuogou Glacier in the Gongga Mountains, where the average annual velocity declined by 24% between 1981 and 2008 (Zhang and others, Reference Zhang, Fujita, Liu, Liu and Wang2010). The decelerations of the eastern Nyainqentanglha Mountains and Hailuogou are in line with our observations of monsoon temperate glaciers in the KKM.
Glaciers with positive mass balances are known to accelerate as more mass is transported down the glaciers (Heid and Kääb, Reference Heid and Kääb2012). Ice cover presents a slight mass gain above 6300 m a.s.l. (Wu and others, Reference Wu2018), while the accelerated ice flow was found at an elevation of 4900–5800 m, this cannot result from positive mass balance. However, the ELA rose significantly from 4800 to 4850 m in the period of 1980–2015 (Wu and others, Reference Wu2018), this means an increase of surface meltwater around the elevation of 4850 m. This could increase the driving stress and result in an accelerated ice flow, especially at the elevation above the ELA. Except the elevation of 4900–5800 m, the accelerated ice flow was also found at the terminus of Yanong Glacier. Surface lowering of lake-terminating glacier shows remarkably negative mass balance than surrounding land-terminating glacier (Wu and others, Reference Wu2018; King and others, Reference King, Bhattacharya, Bhambri and Bolch2019). The proglacial lake at the terminus of Yanong Glacier expanded rapidly in recent years, from 1.15 ± 0.07 km2 in 1986 to 3.15 ± 0.10 km2 in 2017 (Yang and others, Reference Yang, Zhang, Zhu and Ju2019), the accelerated ice flow at the terminus of Yanong might result from the increase of water pressure and basal sliding.
Uncertainties of the glacier surface velocities are dominated by the precision of the image-to-image registration, the feature-tracking algorithm, and the characteristics of glacier surface (Heid and Kääb, Reference Heid and Kääb2012; Dehecq and others, Reference Dehecq, Gourmelen and Trouve2015; Altena and others, Reference Altena, Scambos, Fahnestock and Kääb2019). The precision of the image-to-image registration and the feature-tracking algorithm are quantifiable, while the characteristics of glacier surface could bring difficult in uncertainty estimation. Ice flow in icefalls is often difficult to measure, and collapsing seracs and avalanching that may further complicate the correlation, and that the region around the snowline may suffer from differential brightness in the different years, which introduces additional uncertainty (Dehecq and others, Reference Dehecq, Gourmelen and Trouve2015). Appropriate search-area windows and the interval time of an image pair could minimize the effects of glacier surface characteristics (Heid and Kääb, Reference Heid and Kääb2012; Altena and others, Reference Altena, Scambos, Fahnestock and Kääb2019).
Some glaciers in the KKM have considerable debris cover, with well-developed supraglacial ponds and proglacial lakes, such as Yanong Glacier. Debris-covered regions at lower altitudes with warmer temperatures and the development of supraglacial lakes and ice cliffs likely contributed to the greater mass loss in those areas (Sakai and Fujita, Reference Sakai and Fujita2010; Benn and others, Reference Benn2012; Wu and others, Reference Wu2018), reducing ice flux and surface velocities. A considerable amount of meltwater is retained by supraglacial ponds, and water storage is essential to control any fast-moving event. Due to the lack of field measurements, the influence of the surface features (e.g. debris cover and supraglacial lakes) on surface velocity requires further investigation.
Supplementary material
The supplementary material for this article can be found at https://doi.org/10.1017/jog.2020.98.
Acknowledgements
This work was supported by the Fundamental Programme of the National Natural Science Foundation of China (grant no. 41801031, 41761144075), the International Partnership Programme of the Chinese Academy of Sciences (grant no. 131C11KYSB20160061), a grant for talent introduction of Yunnan University (YJRC3201702), a project of the State Key Laboratory of Cryospheric Science (grant no. SKLCS-OP-2019-07). The Landsat images and SRTM C-band data can be freely downloaded from http://glovis.usgs.gov (last access: 10 September 2019). The authors thank the USGS for free access to Landsat and SRTM C-band data. They also thank the anonymous reviewers and the editors for their help in improving the presentation of this work.


 Open access