


1. Introduction
Extensive fluvial supraglacial hydrologic networks are observed across the southwest Greenland Ice Sheet (GrIS) ablation zone (Smith and others, Reference Smith2015, Reference Smith2017; Yang and Smith, Reference Yang and Smith2016; Pitcher and Smith, Reference Pitcher and Smith2019). These networks, consisting of interlinked supraglacial streams, rivers and lakes, drain large volumes of surface meltwater into the ice sheet via moulins and crevasses (Chu, Reference Chu2014; Flowers, Reference Flowers2018; Pitcher and Smith, Reference Pitcher and Smith2019), with corresponding impacts on GrIS subglacial water pressures, and ice flow dynamics (Zwally and others, Reference Zwally2002; Bartholomew and others, Reference Bartholomew2011; Hoffman and others, Reference Hoffman, Catania, Neumann, Andrews and Rumrill2011; Andrews and others, Reference Andrews2014).
Interconnected supraglacial lakes and rivers are particularly extensive on the southwest GrIS (Fitzpatrick and others, Reference Fitzpatrick2014; Smith and others, Reference Smith2015; Flowers, Reference Flowers2018). In concert with a non-channelized, often porous, near surface weathering crust atop bare ice (Cooper and others, Reference Cooper2018), they control surface meltwater storage and routing on this area of the ice sheet (Smith and others, Reference Smith2017). Supraglacial lakes are located in surface topographic depressions (Liang and others, Reference Liang2012) and are estimated to impound 5–13% of instantaneous surface meltwater during the melt season (Leeson and others, Reference Leeson, Shepherd, Palmer, Sundal and Fettweis2012; Arnold and others, Reference Arnold, Banwell and Willis2014; Fitzpatrick and others, Reference Fitzpatrick2014). While most of these lakes drain laterally into supraglacial rivers over timescales of weeks to months (Tedesco and others, Reference Tedesco2013; Smith and others, Reference Smith2015), some drain vertically via hydrofracture and moulin formation over hours to days (Das and others, Reference Das2008), and others retain meltwater overwinter (Koenig and others, Reference Koenig2015; Lampkin and others, Reference Lampkin, Koenig, Joseph and Box2020). Both rivers and lakes inject meltwater into the ice sheet via moulins and crevasses, thus modulating basal water pressure and evolution of the subglacial hydrologic system (Hoffman and others, Reference Hoffman, Catania, Neumann, Andrews and Rumrill2011; Andrews and others, Reference Andrews2014).
Supraglacial stream/river networks exhibit complex drainage patterns and high drainage densities (Rippin and others, Reference Rippin, Pomfret and King2015; Smith and others, Reference Smith2015; Yang and others, Reference Yang2016). These well-developed fluvial networks route surface meltwater into lakes and moulins (Banwell and others, Reference Banwell, Willis and Arnold2013), and the shape/area of their supraglacial catchments helps control the amplitude and timing of meltwater penetration into the GrIS (Smith and others, Reference Smith2017).
Despite functioning as interconnected hydrologic networks, supraglacial lakes and streams/rivers are often investigated as independent features. Consequently, the relationship between surface meltwater storage and routing remains poorly understood (Yang and others, Reference Yang2018). For example, it remains unknown if the areas and volumes of supraglacial lakes and rivers correlate differently with surface melting, and what the relative storage capacities of lakes and river are. Such measures could reduce uncertainties in both surface runoff simulations (Smith and others, Reference Smith2017; van As and others, Reference van As2017; Yang and others, Reference Yang2018) and ice flow models that incorporate surface meltwater forcing (Andrews and others, Reference Andrews2014; Flowers, Reference Flowers2018).
Current understanding of the coupling between supraglacial lakes and rivers is largely derived from topographic and conceptual models. Banwell and others (Reference Banwell, Arnold, Willis, Tedesco and Ahlstrøm2012) developed the Surface Routing and Lake Filling (SRLF) model to simulate surface meltwater routing through the base of a saturated snowpack or over bare ice to fill supraglacial lakes. For a saturated snowpack, supraglacial streams/rivers evolve as the snowline retreats; for a bare-ice surface, SRLF routes supraglacial streams/rivers over a theoretically impervious surface assuming a constant routing network and efficiency (Arnold and others, Reference Arnold, Richards, Willis and Sharp1998). However, supraglacial streams/rivers are found to evolve seasonally (Lampkin and VanderBerg, Reference Lampkin and VanderBerg2014; Yang and others, Reference Yang, Karlstrom, Smith and Li2017). This leads to varying spatial partitioning between slow-flowing interfluve (i.e. hillslope) and fast-flowing open-channel zones, and thus changing routing efficiency over the course of the melt season. To investigate this, Yang and others (Reference Yang2018) arbitrarily varied contributing area thresholds (100–5000 m2) in a digital elevation model, but this approach fails to capture the true seasonal evolution of the supraglacial hydrologic networks or the seasonal infilling of lakes.
In this study, we use seven medium-resolution (30 m) Landsat 8 Operational Land Imager (OLI) satellite images to map the seasonal evolution of surface meltwater area and volume throughout the 2015 melt season, a colder than average year. Rather than separating lakes from rivers, we quantify their integrated seasonal evolution. Next, we compare remotely sensed meltwater area and volume with surface runoff simulations from three climate models (MERRA-2, MAR 3.6 and RACMO 2.3). Special attention is paid to high-elevation (>1600 m) areas where well-developed supraglacial hydrologic networks appear to develop despite their location above the equilibrium line altitude (ELA) (~1550 m in this area, van de Wal and others, Reference van de Wal2012; Poinar and others, Reference Poinar2015).
2. Study area and data
Two major drainage basins, sourcing the Isortoq and Watson (Qinnguata Kuussua) proglacial rivers, were selected as the study area (×Fig. 1). Each summer, supraglacial lakes and streams/rivers from across the icescapes of these two basins (Fitzpatrick and others, Reference Fitzpatrick2014; Smith and others, Reference Smith2015; Yang and Smith, Reference Yang and Smith2016). Their boundaries were derived using CryoSheds (Pitcher and others, Reference Pitcher, Smith and Gleason2016) and their combined basin ice-surface area below 2000 m (a conservative upper limit of melt extent) was calculated as ~11 000 km2 (~6000 km2 for the Isortoq river basin and ~5000 km2 for the Watson river basin, respectively).

Fig. 1. Landsat 8 OLI image of the Isortoq and Watson (Qinnguata Kuussua) river basins, southwest GrIS (acquired 8 July 2015, R5G4B3). Black crosses show the locations of three PROMICE automatic weather stations (AWS) used in this study.
Seven multi-spectral Landsat 8 OLI satellite images covering the study area from 13 June to 25 August 2015 were acquired from the United States Geological Survey (USGS, https://www.usgs.gov/) (×Table 1). While large supraglacial lakes are often mapped using 250 m spatial resolution MODIS images (Liang and others, Reference Liang2012), Landsat 8 offers superior lake mapping accuracy due to its 30 m spatial resolution and available spectral bands (Yang and others, Reference Yang, Smith, Chu, Gleason and Li2015b; Pope and others, Reference Pope2016; Williamson and others, Reference Williamson, Banwell, Willis and Arnold2018a).
Table 1. Seven multispectral Landsat 8 images acquired over the study area (Isortoq and Watson river basins, with a combined ice-surface area of 10 946 km2 below 2000 m) during the 2015 melt season

Multi-temporal supraglacial lakes and rivers were mapped and surface meltwater areal extent and storage were calculated
a Although cloud cover on the 24 July 2015 Landsat 8 image is high, most clouds are located to the north of our study area and have slight impacts on supraglacial lake and river mapping in our study area.
We specifically focus on the 2015 year rather than inter-annual variations between years. Note that surface runoff during 2015 was generally lower than the 2000–2018 average (×Fig. 2). As such, surface melting in 2015 began one month later than is typical for southwest GrIS (early June rather than early May) and runoff during August was similarly below average. Overall, compared to the last two decades, the 2015 melt season can be considered a lower limit of GrIS surface runoff and meltwater extent. Outside of a modest runoff pulse in September, the seven Landsat 8 images analyzed here are broadly representative of the 2015 melt season.

Fig. 2. Modeled (a) daily and (b) cumulative surface runoff of the Isortoq and Watson river basins during the colder-than-average 2015 melt season as simulated by the Modèle Atmosphérique Régionale (MAR) 3.6 regional climate model. For context, modeled values for the extremely warm melt year 2019 and the long-term 2000–2019 average are also presented. Gray uncertainty envelope presents the one std dev. range of surface runoff. Red dots mark the 2015 image acquisition dates for seven Landsat 8 images, while the two blue dots represent the 2019 acquisition dates two higher-resolution images (i.e. a 2 m WorldView-2 image acquired on 25 July 2019 and a 10 m Sentinel-2 image acquired on 4 August 2019, see Figs S2, S3).
Daily ice-sheet surface runoff values for the Isortoq and Watson river basins were extracted from three widely-used climate models (MAR 3.6, RACMO 2.3 and MERRA-2). Detailed descriptions of these climate models are provided by Smith and others (Reference Smith2017). Daily estimates of proglacial discharge in the Watson River were obtained from van As and others (Reference van As2017), and were compared with daily surface runoff simulations from the climate models. In situ measurements of ice motion were obtained from three Programme for Monitoring of the GrIS (PROMICE) automatic weather stations (AWS) located in the study area. From low to high elevations, they are KAN_L, KAN_M and KAN_U, located at 670, 1270 and 1840 m elevation, respectively (Fig. 1). In addition to their meteorological sensor suites, these stations contain GPS units used to calculate ice surface motion. We used a 5 d smoothing window to eliminate outlier velocity measurements. Additionally, the AWS are equipped with sensors to measure surface accumulation and ablation.
3. Methods
3.1 Surface meltwater area delineation
Supraglacial lakes and rivers were automatically delineated from Landsat 8 images using a Normalized Difference Water Index (NDWI) adapted for ice (NDWIice = (BLUE–RED)/(BLUE + RED)) as per Yang and Smith (Reference Yang and Smith2013). A high-value, global NDWIice threshold (t ndwi = 0.25) was applied to delineate supraglacial lakes and wide river segments, and narrower river segments were then enhanced from the NDWIice images using Gabor filtering and path opening (Yang and others, Reference Yang2015a). Finally, a second global threshold (t watermask = 25 out of 255) was applied to classify the enhanced images and to create binary surface meltwater masks.
The two thresholds, t ndwi and t watermask were set relatively high, rendering conservative delineation of surface meltwater. We selected t ndwi = 0.25 because it captures supraglacial lake boundaries reasonably well from all seven Landsat 8 images. This global t ndwi threshold value also performs well on the Antarctic Ice Sheet (Bell and others, Reference Bell2017), and is similar to a value of 0.23 previously used to detect southwest GrIS supraglacial lakes (Moussavi and others, Reference Moussavi2016). In addition, Moussavi and others (Reference Moussavi2020) used t ndwi = 0.19 to identify Antarctic supraglacial lake boundaries and then used additional band calculations to discern lakes from cloud-shadowed snow surfaces. While dynamic thresholding techniques have been used to map supraglacial lakes (Selmes and others, Reference Selmes, Murray and James2011; Williamson and others, Reference Williamson, Arnold, Banwell and Willis2017), we find that a global threshold t ndwi = 0.25 is satisfactory given the limited spatial domain and number of images used here.
3.2 Identification of supraglacial lakes, rivers and moulins
Supraglacial lakes and rivers are inseparable in our binary meltwater masks. To broadly partition them, lake polygons and river polylines were created using the ArcScan vectorization tool (ESRI, 2010). The maximum polyline width was set to 5 pixels (150 m) based on visual inspection of small supraglacial lakes. As such, surface meltwater bodies wider than 5 pixels were summarily categorized as supraglacial lakes, and narrower bodies summarily categorized as supraglacial rivers.
This threshold likely miscategorizes some small supraglacial lakes (Williamson and others, Reference Williamson, Banwell, Willis and Arnold2018a). However, the impact of this on overall surface meltwater area and volume calculations is small. For example, a miscategorized rectangular lake having width × length of 5 × 50 pixels (i.e. 150 m × 1500 m) has a relatively small surface area of 0.225 km2. Yang and others (Reference Yang, Smith, Chu, Gleason and Li2015b) showed that the summed area of small (<0.25 km2) lakes is <15% of the total lake area on the southwest GrIS. Similarly, Williamson and others (Reference Williamson, Banwell, Willis and Arnold2018a) found that meltwater drained by small (<0.125 km2) lakes represents only 5% of the total meltwater volume drained by lakes on the western GrIS (north of our study area). Finally, numerous small lakes are correctly categorized using a width threshold of 5 pixels (see Fig. S1). We conclude that the impact of small, miscategorized lakes on computed surface meltwater areas and volumes is small.
Small supraglacial streams are ubiquitous on the southwest GrIS yet are largely undetected in 30 m resolution Landsat 8 images (Yang and Smith, Reference Yang and Smith2016; Yang and others, Reference Yang2019b). Although small streams enhance surface meltwater routing (Decaux and others, Reference Decaux, Grabiec, Ignatiuk and Jania2018; Yang and others, Reference Yang2018), coarser images of large supraglacial rivers capture the overall drainage pattern of supraglacial hydrologic networks effectively (see Table S1 and Fig. S2). These images are also a primary requirement for identifying terminal moulins (Smith and others, Reference Smith2015; Yang and Smith, Reference Yang and Smith2016). Therefore, 30 m Landsat 8 imagery is sufficient for capturing the broad-scale seasonal evolution of supraglacial hydrologic networks on the southwest GrIS.
To investigate high-elevation surface-to-bed meltwater connections, we mapped terminal supraglacial river moulins at elevations >1600 m in a 2 August 2015 Landsat-8 image. We selected early August for this analysis as moulins are best developed near the end of melt season (Yang and Smith, Reference Yang and Smith2016), yet surface runoff remains sufficiently high to enable their detection in visible/NIR satellite imagery.
3.3 Surface meltwater volume estimation
Surface meltwater volumes of supraglacial lakes and rivers were estimated from their spectral characteristics. To retrieve water depths, we used the band ratio between the coastal and green bands of Landsat 8 following Pope and others (Reference Pope2016). This approach uses empirical parameters calibrated from in situ spectral and bathymetric data (Pope and others, Reference Pope2016) as follows: z = a + bX + cX 2, X = ln(B1/B3), where a = 0.1488, b = 5.0370 and c = 5.0473, B1/B3 is the ratio of the reflectance of Landsat 8 OLI band 1 (coastal) and 3 (green), and z is the derived lake depth. Meltwater volumes were calculated by multiplying Landsat 8 pixel area (900 m2) by the sum of water depth derived for water pixels (Yang and others, Reference Yang2019a). Meltwater volume uncertainties were calculated by multiplying RMSE = 0.38 m (Pope and others, Reference Pope2016) by pixel area and the number of water pixels, as per Williamson and others (Reference Williamson, Banwell, Willis and Arnold2018a).
3.4 Quantitative metrics of supraglacial hydrology
The resultant map products were surface meltwater mask and depth rasters, and lake and river vectors. The areas and depths of supraglacial lakes and rivers exhibit large spatial and temporal variations over the melt season (Chu, Reference Chu2014; Fitzpatrick and others, Reference Fitzpatrick2014; Yang and Smith, Reference Yang and Smith2016; Williamson and others, Reference Williamson, Banwell, Willis and Arnold2018a). To characterize this variability, we analyzed supraglacial lakes and rivers at 200 m elevation intervals (<1000, 1000–1200, 1200–1400, 1400–1600, 1600–1800 and >1800 m). These six elevation intervals span differing melt intensities and surface conditions (Sundal and others, Reference Sundal2009; Fitzpatrick and others, Reference Fitzpatrick2014). For example, the ice surface below 1200 m is heavily crevassed with relatively few lakes and rivers (Colgan and others, Reference Colgan2011), whereas the ice surface between 1200 and 1600 m is smoother, with numerous supraglacial lakes and rivers (Fitzpatrick and others, Reference Fitzpatrick2014; Yang and Smith, Reference Yang and Smith2016). Above 1600 m, the ice surface is typically covered by firn/snow, with an end-of-season snowline elevation of 1520 ± 113 m in 2015 (Ryan and others, Reference Ryan2019).
Two quantitative metrics, surface meltwater area proportion and surface meltwater storage, were computed over the 2015 melt season. Surface meltwater area proportion (%) was calculated by dividing the total surface meltwater area by the study area, and surface meltwater storage (mm) was calculated by dividing the total meltwater volume by the study area. For each satellite image, these two metrics were calculated for each elevation interval. Supraglacial river width was not included because, due to mixed pixel effects, 30 m Landsat 8 images overestimate the widths of supraglacial rivers (Fig. S3).
For each elevation interval, a mean supraglacial lake (river) depth was calculated from each Landsat 8 image, yielding times series of instantaneous surface meltwater volumes binned by elevation. Mean depths and std dev. over time were also calculated for each elevation interval to compute seasonally-averaged storage volume and variability, respectively. The coefficient of variation (c v = std dev./mean) was used to investigate the dispersion of lake and river depth.
We defined a ‘lake disappearance ratio’ as:

This ratio quantifies the relative ratio of lakes that drain via moulins or lateral outlet channels by the end of the melt season. We used the supraglacial lake count during late melt season as the denominator because most supraglacial lakes have drained by this time (Selmes and others, Reference Selmes, Murray and James2011). We repeated the calculations for large (0.25 km2, the minimum lake area identifiable in MODIS satellite imagery) lake drainage events as they have a large impact on subglacial hydrologic system evolution (Selmes and others, Reference Selmes, Murray and James2011; Andrews and others, Reference Andrews2018).
3.5 Comparison of satellite-observed supraglacial hydrology with modeled surface runoff
We hypothesize that the seasonal evolution of supraglacial lakes and rivers is correlated with the seasonal surface meltwater runoff. To test this hypothesis, we calculated the correlation between remotely sensed quantitative metrics of surface meltwater and modeled surface runoff. The modeled surface runoff was binned into six elevation intervals (see section 3.4) and used to create linear regression models with remotely sensed surface meltwater area, similar to previous studies (Sundal and others, Reference Sundal2009; Fitzpatrick and others, Reference Fitzpatrick2014; Yang and Smith, Reference Yang and Smith2016).
Large uncertainties in modeled surface runoff have been reported (Smith and others, Reference Smith2017; Yang and others, Reference Yang2019a). Although meltwater retention in snow/firn/weathering crust (Rennermalm and others, Reference Rennermalm2013; Machguth and others, Reference Machguth2016; Steger and others, Reference Steger2017; Cooper and others, Reference Cooper2018; Vandecrux and others, Reference Vandecrux2019) is not considered here, we suggest that remotely sensed surface meltwater reflects ice surface melting and runoff conditions. Therefore, we explored whether satellite-derived supraglacial lake and river maps correlate with modeled surface runoff, and also compared them with in situ measurement of proglacial discharge.
4. Results
4.1 Seasonal evolution of supraglacial lakes and rivers
Supraglacial lakes and rivers progressively migrate from low (<1000 m) to high (>1600 m) elevations in our study area (×Fig. 3), consistent with previous studies (Sundal and others, Reference Sundal2009; Lampkin and VanderBerg, Reference Lampkin and VanderBerg2014). At low elevations (<1200 m), both supraglacial lake and river area proportions peak on 1 July. Above 1200 m, supraglacial river area proportions peak 7–10 d earlier than supraglacial lakes (Figs 4a, b). This time-lag has not previously been reported, but is not surprising given that supraglacial topographic depressions are small and surface runoff intense below 1200 m (Yang and others, Reference Yang, Smith, Chu, Gleason and Li2015b), resulting in rapid small (mean area 0.10 km2) lake infilling. Above 1200 m, topographic depressions are larger (mean area 0.36 km2) so lake infilling takes longer. In contrast, supraglacial rivers fill quickly because they are highly responsive to surface runoff generation, evacuating runoff from the ice-sheet surface within hours (Smith and others, Reference Smith2017; Yang and others, Reference Yang2020).

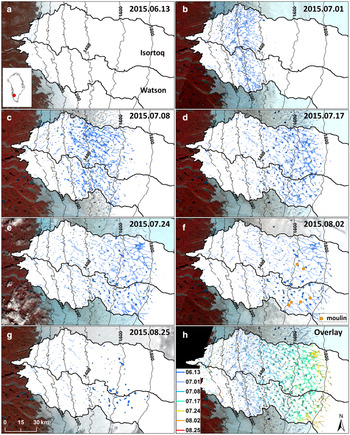
Fig. 3. Seasonal evolution of supraglacial lakes and rivers on the southwest Greenland Ice Sheet as mapped from seven Landsat 8 OLI satellite images acquired throughout the 2015 melt season. Panels (a)–(g) show blue supraglacial lakes and rivers with the boundaries of the Isortoq and Water river basins overlaid. Panel (h) presents a temporal composite of all seven maps, revealing the temporal evolution of supraglacial lakes and rivers from low to high elevations.
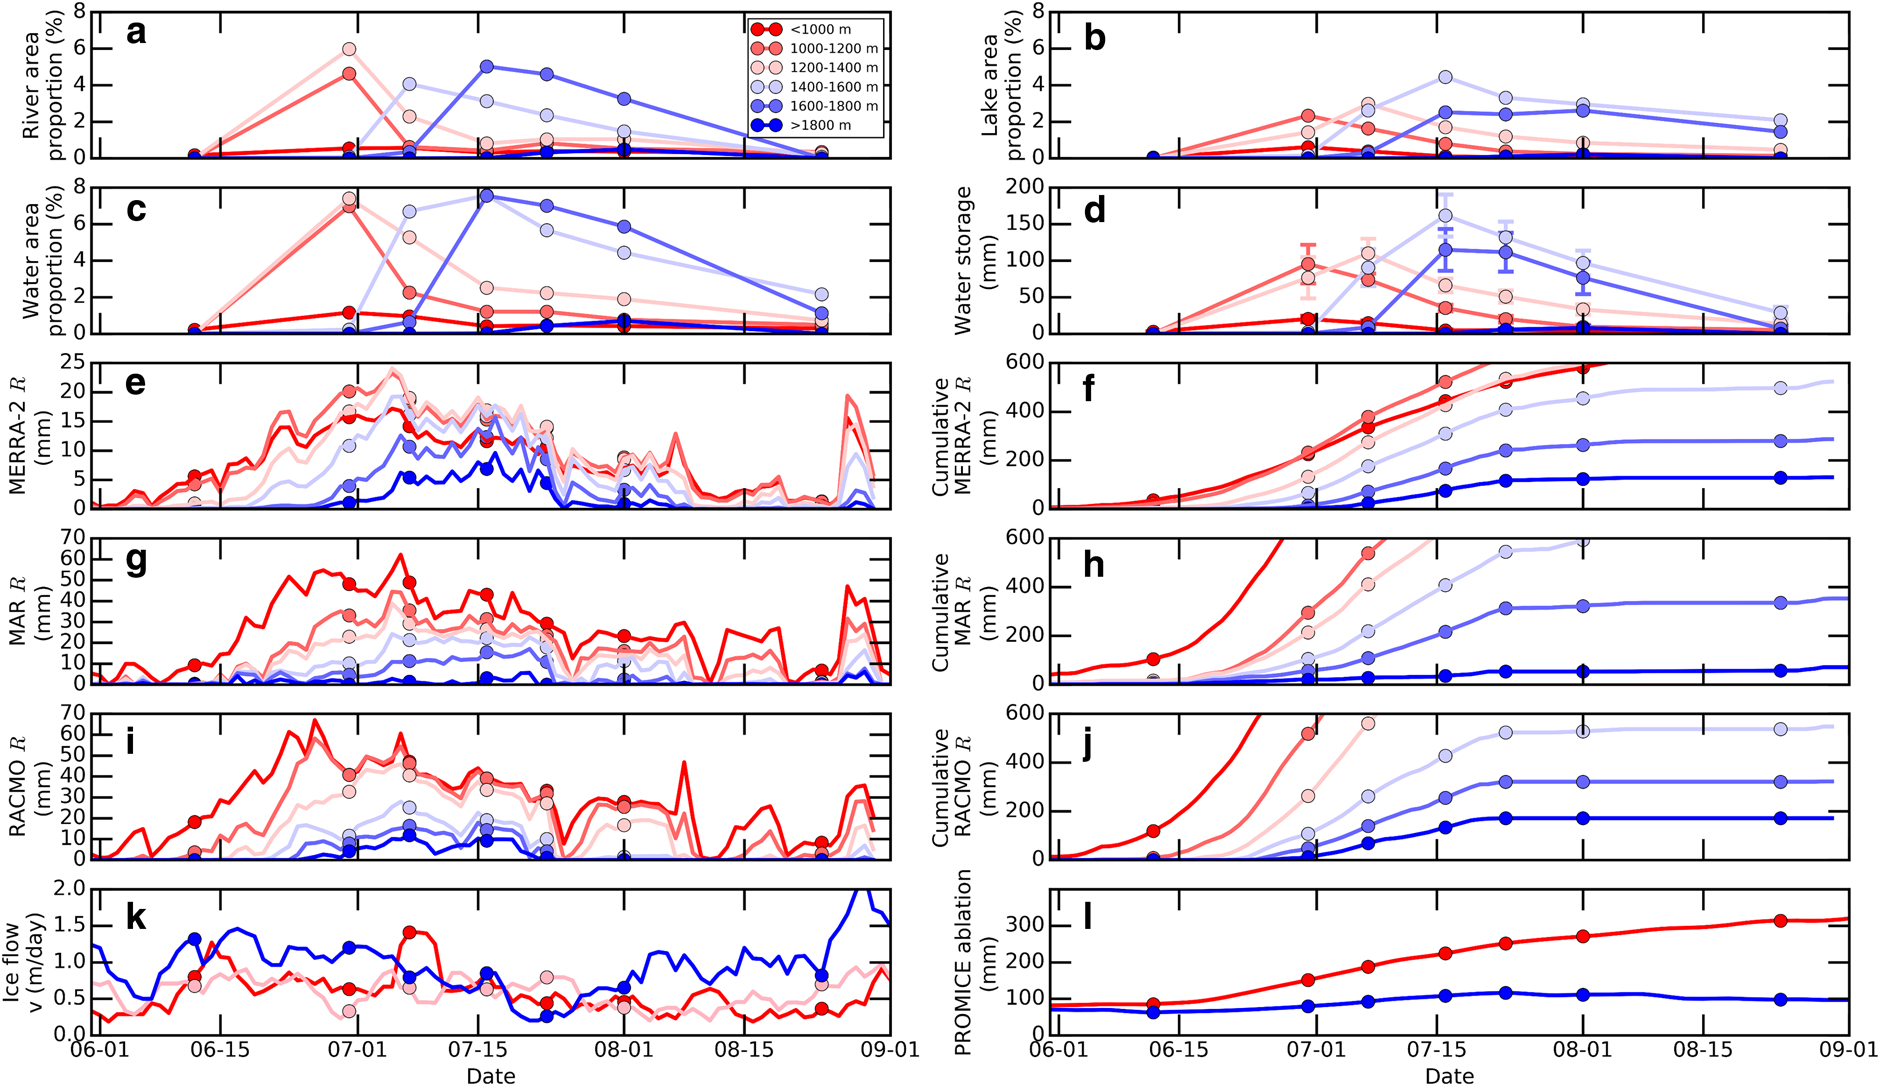
Fig. 4. Seasonal evolution of (a) river area proportion, (b) lake area proportion, (c) surface meltwater area proportion, (d) surface meltwater storage, (e) daily MERRA-2 runoff and (f) cumulative MERRA-2 runoff, (g) daily MAR runoff and (h) cumulative MAR runoff, (i) daily RACMO runoff and (j) cumulative RACMO runoff, (k) ice flow velocity, and (l) surface ablation measured by three PROMICE stations (KAN_L, KAN_M and KAN_U in Fig. 1).
4.2 High-elevation supraglacial lake and river evolution
High-elevation (>1600 m) supraglacial hydrologic networks become well-developed by 17 July (Figs 3, 4a–d). Peak surface meltwater area proportions (lakes and rivers combined) between 1000–1800 m elevation are all ~7% (Fig. 4c). Peak river area proportion is 4.1–5.0% above 1400 m and 4.6–5.9% below 1400 m. Peak lake area proportion at 1400–1600 m (4.5%) is higher than below 1400 m (2.3–3.0%). Peak lake area proportion at 1600–1800 m (2.6%) is ~87% of its low-elevation counterpart at 1200–1400 m (3.0%), more than quadruple than occurred during the 2003 melt season (~20%, Sundal and others, Reference Sundal2009). Moreover, peak surface meltwater storage at 1600–1800 m is ~104% that of at 1200–1400 m (Fig. 4d), more than double that of the Watson river basin for the 2010 melt season (~40%, Fitzpatrick and others, Reference Fitzpatrick2014). This confirms that supraglacial lakes and rivers advanced further inland and up-elevation in summer 2015, consistent with model predictions (Leeson and others, Reference Leeson2015) and satellite observed trends from 1972 to 2012 (Howat and others, Reference Howat, de la Peña, van Angelen, Lenaerts and van den Broeke2013).
Above 1600 m elevation, six moulins are observed on 2 August 2015 (Fig. 3f). Their combined upstream river length is 302 km, accounting for 28% of the total mapped high-elevation river length (1078 km). This signifies the presence of surface-to-bed meltwater connections at high elevations, consistent with previous reports (Yang and Smith, Reference Yang and Smith2016; Gagliardini and Werder, Reference Gagliardini and Werder2018). A total of 198 km (18%) of high-elevation river length is observed draining into terminal supraglacial lakes, with 579 km (54%) flowing to lower elevations where most rivers terminate in moulins between 1400 and 1600 m elevation (Fig. 3f).
4.3 Surface meltwater area, depth and volume
Total surface meltwater area proportion and storage increase after 13 June, peak on 17 July, then decrease through 25 August. The peak meltwater area proportion and storage are 3.4% and 66.5 mm, respectively (Table 1). Averaged across all elevations and dates, the mean supraglacial lake depth is 1.7 ± 0.7 m and mean supraglacial river depth is 0.9 ± 0.2 m. The coefficient of variation of meltwater depth is 0.41 for supraglacial lakes and 0.22 for supraglacial rivers, suggesting that lake depth is generally more variable than river depth.
Peak meltwater area proportion is primarily controlled by supraglacial rivers, while peak meltwater storage volume is primarily controlled by supraglacial lakes. Both display large variations at different elevation intervals throughout the 2015 melt season (×Figs 4a–d, 5). Other than 1400–1600 m elevation on July 17, the area proportions of rivers are consistently larger than those of lakes (Figs 4a, b). The mean contribution of rivers to peak meltwater proportion is 62%, ranging from 41% at 1400–1600 m to 81% at 1200–1400 m.

Fig. 5. Remotely sensed instantaneous surface meltwater storage in (a) lakes and rivers, (b) lakes only and (c) rivers only, during the 2015 melt season. Error bars are obtained by multiplying RMSE = 0.38 m of water depth estimation using Landsat 8 coastal and green bands (Pope and others, Reference Pope2016) by the Landsat 8 pixel size (900 m2) and the number of water pixels.
Peak meltwater storage is primarily attributed to supraglacial lakes. Lake storage is larger than river storage in all satellite images except for 1600–1800 m elevation on 17 July and 1200–1400 m elevation on 1 July (Fig. 5). The mean contribution of supraglacial lakes to peak meltwater storage is 68%, ranging from 46% at 1600–1800 m to 81% at 1400–1600 m (Fig. 5b). This is because topographic depressions can store large volumes of surface meltwater (Arnold and others, Reference Arnold, Banwell and Willis2014; Fitzpatrick and others, Reference Fitzpatrick2014), whereas supraglacial rivers are shallow and their instantaneous channel storage is small (Legleiter and others, Reference Legleiter, Tedesco, Smith, Behar and Overstreet2014; Gleason and others, Reference Gleason2016). However, for all elevation intervals, supraglacial rivers contain small but significant instantaneous meltwater storage in the early melt season (Figs 3, 5c). We also note that meltwater flux (discharge) is vastly larger in supraglacial rivers, despite their small instantaneous storage volume (Smith and others, Reference Smith2017).
4.4 Supraglacial lake drainage
We find that small (<0.25 km2), low-elevation supraglacial lakes are more likely to drain, while large (≥0.25 km2), high-elevation supraglacial lakes are more likely to persist throughout the 2015 melt season. Supraglacial lake count evolves seasonally from low to high elevations (×Fig. 6), as do surface meltwater area proportions and volumes (Figs 4a–d). Between 1000 and 1800 m, for example, supraglacial lake counts are higher earlier in the season than their areas (Fig. 6a), indicating large lakes often continue growing while small lakes drain or evolve into narrow channels. The concurrent increase of large lake area (≥0.25 km2) and count further supports this finding (Fig. 6b).

Fig. 6. Seasonal evolution of (a) all; and (b) large (≥0.25 km2) supraglacial lakes during the 2015 melt season. (c) Large (solid line) and all (dashed line) lake disappearance ratios decrease from low to high elevations, while mean lake areas (with one std dev. error bar) increase. Black solid line presents mean lake areas for the same study region during the 2003 melt season as reported in Sundal and others (Reference Sundal2009).
From low to high elevations, the supraglacial lake disappearance ratio decreases while mean lake area increases, again indicating that supraglacial lakes at lower elevations are more likely to drain (Fig. 6c). Above 1400 m elevation, supraglacial lake areas are more variable than at lower elevations, suggesting that high-elevation lakes experience greater seasonal expansion. Moreover, 21% of these large lakes drain rapidly via hydrofracture, suggesting the presence of surface-to-bed meltwater connections at high elevations even during a colder-than-average melt season (Yang and Smith, Reference Yang and Smith2016; Gagliardini and Werder, Reference Gagliardini and Werder2018).
4.5 Supraglacial hydrology and modeled surface runoff
Remotely sensed meltwater area and modeled surface runoff positively correlate for all three climate models. The mean correlation coefficient (R 2) between surface runoff and meltwater area proportion across all elevation intervals is 0.90, 0.84 and 0.79 for MERRA-2, MAR and RACMO, respectively. At high elevation intervals (1600–1800 and >1800 m), the corresponding R2 values are 0.88, 0.74 and 0.65, respectively (×Fig. 7). Out of the three models, we find that MERRA-2 displays the highest correlation with observed meltwater area. However, due to the intermittent temporal sampling of Landsat 8 images, it is unknown whether time lags exist between peak surface runoff and maximum meltwater area proportion (Figs 4c–j).

Fig. 7. Correlations between MERRA-2 modeled surface runoff and remotely sensed surface meltwater area proportion. Larger circle sizes indicate later image acquisition dates. Except for very high (>1800 m) elevations, positive linear correlations are obtained at all elevations during 17 July to 25 August, indicating that greater (modeled) surface runoff is associated with greater surface meltwater area proportion.
MAR and RACMO runoff progressively declines for elevations >1400 m, whereas MERRA-2 simulates roughly similar runoff between 1000 and 1600 m (Figs 4e–j). MERRA-2 best simulates surface runoff during 8 and 24 July, when supraglacial hydrologic networks are well developed at 1400–1600 m elevation (Figs 4c, e). MERRA-2 cumulative runoff also best matches in situ ablation measurements from the PROMICE stations (Fig. 4l). The gradient of this positive linear relationship is steeper at higher elevations (Fig. 7), suggesting that high elevations are more sensitive to increasing meltwater runoff supply.
Surface meltwater storage accounts for 2.5–14.4% of modeled surface runoff over the 2015 melt season (Table 1), partitioned as 1.7–9.8% in lakes and 0.8–4.6% in rivers. A low percentage on 13 June (2.5%) is mainly attributed to the late start of the 2015 melt season (Fig. 2). While the percentages of lake/river storage (as compared to modeled surface runoff) show large variations at different elevation intervals (Fig. S4), our lake percentages are generally consistent with previously reported values (e.g. 5–13%, Leeson and others, Reference Leeson, Shepherd, Palmer, Sundal and Fettweis2012; Arnold and others, Reference Arnold, Banwell and Willis2014; Fitzpatrick and others, Reference Fitzpatrick2014).
4.6 Supraglacial hydrology and ice flow
No direct correlation between surface meltwater area and storage and ice surface velocity is found (Fig. 4k). As the 2015 melt season progresses, slight decreases in ice velocity are observed, particularly at lower elevations (Fig. 4k). This is consistent with previous studies demonstrating reduced ice velocities in response to increased surface melt and development of an efficient subglacial hydrologic system (e.g. Bartholomew and others, Reference Bartholomew2011; Tedstone and others, Reference Tedstone2015). Surface meltwater area proportion peaks on 1 July, after which supraglacial lakes continue expanding (Figs 4a–c), while ice flow decreases at 1200–1400 m (KAN_M station). On 24 July, a similar phenomenon occurs at a higher elevation (>1600 m, KAN_U station). This suggests that the well-developed supraglacial hydrologic networks observed at higher elevations drain meltwater into the ice sheet late in the melt season, causing ice flow velocities to accelerate, as occurs earlier in the melt season at lower elevations.
4.7 Supraglacial hydrology and proglacial river discharge
Modeled surface runoff is compared with remotely sensed surface meltwater area proportion and observed proglacial discharge in the Watson (Qinnguata Kuussua) River (×Fig. 8). Two major peaks (~1000 m3/s) in proglacial discharge occur around 8 and 24 July, a time of high surface meltwater area proportion. All three models simulate the 8 July discharge peak, with one-daytime lag between peak surface runoff and peak proglacial discharge. All three models also simulate a second runoff peak around 16–17 July, some 7–8 d before the observed proglacial discharge peak on 24 July. This suggests that the first proglacial discharge peak is driven mainly by low-elevation (<1600 m) meltwater contributions (Figs 4a–d), whereas the second proglacial peak includes high-elevation (>1600 m) meltwater contributions (Figs 4a–d). At higher elevations, a longer lag time is required for surface meltwater to reach the ice edge via subglacial pathways (Chandler and others, Reference Chandler2013; Andrews and others, Reference Andrews2014; van As and others, Reference van As2017).

Fig. 8. Daily in situ proglacial discharge in the Watson River at Kangerlussuaq (van As and others, Reference van As2017) and corresponding surface runoff as predicted by the MERRA-2, MAR 3.6 and RACMO 2.3 climate models (not including routing delays). Red crosses indicate surface meltwater area proportions derived from Landsat 8 satellite images. Observed proglacial discharge is most closely tracked by remotely sensed surface meltwater area proportions, and MERRA-2 runoff simulations based on simple correlation statistics.
MERRA-2 slightly underestimates observed peak discharge in both cases (by 15.0 and 25.1%, respectively, see ×Fig. 8), and is the only model to simulate a second peak comparable in magnitude to the first peak. MAR and RACMO both simulate smaller second peaks (21.0 and 16.2% lower than the first peak, respectively), and significantly overestimate both peak magnitudes (46.3 and 8.4% by MAR, and 86.2 and 46.4% by RACMO). This finding confirms previous reports of overestimated runoff in MAR and RACMO simulations (Rennermalm and others, Reference Rennermalm2013; Overeem and others, Reference Overeem2015; Smith and others, Reference Smith2015, Reference Smith2017; van As and others, Reference van As2017).
Among these three models, MERRA-2 runoff best matches observed proglacial discharge in the Watson River, with a Nash-Sutcliffe model efficiency (Nash and Sutcliffe, Reference Nash and Sutcliffe1970) of E = 0.34. In contrast, E for MAR and RACMO are 0 and −1.27, respectively. MERRA-2 matches early-season proglacial discharge before July 19 particularly well (E = 0.88), significantly outperforming the other two models (E = −0.09 for MAR and −2.27 for RACMO). All three models simulate increasing proglacial discharge during July 19–24, just several days too early due to non-representation of routing delays. After July 24, MERRA-2 captures the overall decreasing trend of proglacial discharge but underestimates proglacial discharge by ~50% (Fig. 8).
5. Discussion
5.1 Supraglacial lakes and rivers are well developed at high elevations
This study provides enhanced detail to the temporal and spatial evolution of the southwest GrIS supraglacial hydrologic network and its variation with elevation (Fig. 4). In particular, our finding of well-developed supraglacial lakes and rivers above 1600 m signifies the presence of considerable surface runoff at high elevations. Indeed, we find that peak surface meltwater area proportion at high elevations (7.5%) is slightly larger than at low elevations (7.0–7.4%, Fig. 4d). Peak surface meltwater storage is also slightly greater at high elevations (115 mm) than low elevations (95–110 mm, Fig. 4d), perhaps due to the presence of large supraglacial lakes that persist overwinter (Koenig and others, Reference Koenig2015; Lampkin and others, Reference Lampkin, Koenig, Joseph and Box2020).
We also document the presence of significant surface-to-bed meltwater connections at high elevations (Figs 5, 6). Because high-elevation supraglacial catchments/depressions are typically large, they can drain significant volumes of meltwater into moulins despite having lower overall ablation rates (Yang and Smith, Reference Yang and Smith2016). The present study firmly asserts the presence of high-elevation (>1600 m) moulins on the southwest GrIS, with 21% of high-elevation supraglacial lakes and 28% of rivers draining into them (Figs 3f, 5c). This affirms the substantial presence of surface-to-bed meltwater connections at high elevations even in a colder-than-average year (Yang and Smith, Reference Yang and Smith2016; Gagliardini and Werder, Reference Gagliardini and Werder2018), contrary to high-elevation meltwater evacuation via very long supraglacial rivers (Poinar and others, Reference Poinar2015).
While the long-term ELA of our study area (~1550 m, van de Wal and others, Reference van de Wal2012) is supported by remotely sensed end-of-season snowline elevation (averaging 1520 ± 113 m from 2001 to 2017, Ryan and others, Reference Ryan2019), recent field measurements suggest the ELA is rising and is now situated above 1700 m (Smeets and others, Reference Smeets2018). Our finding of well-developed supraglacial lakes and rivers at elevations >1600 m is therefore not particularly surprising. Future studies should further investigate the impact of these supraglacial hydrologic features on surface mass balance and ice flow at higher elevations in the ice-sheet interior (Poinar and others, Reference Poinar2015; Yang and Smith, Reference Yang and Smith2016; Gagliardini and Werder, Reference Gagliardini and Werder2018).
5.2 Modeled surface runoff is correlated with satellite-observed meltwater area and volume
Positive linear relationships are found between modeled surface runoff and satellite-observed surface meltwater area proportions (Fig. 7). These relationships offer a new tool for understanding GrIS surface runoff where direct observations are difficult to obtain. In addition, we find 2.5–14.4% of surface runoff is stored in supraglacial lakes and rivers, a finding consistent with: (1) a model study for Paakitsoq (north of our study area), which reports values of 5–10% of runoff stored in supraglacial lakes in 2001, 2002 and 2005 (Arnold and others, Reference Arnold, Banwell and Willis2014); (2) a value of 12% modeled for the entire southwest sector of the GrIS in 2003 (Leeson and others, Reference Leeson, Shepherd, Palmer, Sundal and Fettweis2012); and (3) remotely sensed values of 7–13% for the Watson river basin in 2010 and 2012 (Fitzpatrick and others, Reference Fitzpatrick2014). Supraglacial storage capacity is thus relatively small but stable during both cold (e.g. 2015) and warm (e.g. 2010 and 2012) years. This finding also signifies that supraglacial rivers remove >85% of meltwater runoff from the ice surface, consistent with Smith and others (Reference Smith2015). In this area of the GrIS, supraglacial rivers are therefore the dominant mechanism by which surface meltwater runoff enters the subsurface, not supraglacial lake drainage events.
Because supraglacial lakes and rivers are both fed by surface meltwater runoff (Banwell and others, Reference Banwell, Arnold, Willis, Tedesco and Ahlstrøm2012; Arnold and others, Reference Arnold, Banwell and Willis2014; Chu, Reference Chu2014; Fitzpatrick and others, Reference Fitzpatrick2014; Smith and others, Reference Smith2017; Pitcher and Smith, Reference Pitcher and Smith2019; Yang and others, Reference Yang2019a), it is perhaps not surprising to find a positive linear relationship between surface meltwater area proportion and modeled surface runoff (Fig. 7). However, while numerous positive correlations between numbers/areas/volumes of supraglacial lakes and ice surface temperature/melt/runoff have been reported (McMillan and others, Reference McMillan, Nienow, Shepherd, Benham and Sole2007; Sundal and others, Reference Sundal2009; Liang and others, Reference Liang2012; Howat and others, Reference Howat, de la Peña, van Angelen, Lenaerts and van den Broeke2013; Fitzpatrick and others, Reference Fitzpatrick2014; Langley and others, Reference Langley, Leeson, Stokes and Jamieson2016; Kingslake and others, Reference Kingslake, Ely, Das and Bell2017; Macdonald and others, Reference Macdonald, Banwell and MacAyeal2018; Williamson and others, Reference Williamson, Willis, Arnold and Banwell2018b; Yang and others, Reference Yang2019a), supraglacial rivers are rarely considered.
Our results suggest that surface meltwater area proportion increases with modeled surface runoff (Fig. 7). This first empirical demonstration of a direct correlation between these two variables holds promise for calibration and validation of ice-sheet runoff models. It may be possible, for example, to parameterize ice surface drainage density and surface meltwater routing delays and peak discharges to moulins directly from modeled surface runoff. This knowledge would improve estimates of the diurnal timing of surface meltwater delivery to moulins (Arnold and others, Reference Arnold, Banwell and Willis2014; Banwell and others, Reference Banwell, Hewitt, Willis and Arnold2016), which modulates subglacial water pressures and impacts ice flow dynamics (Andrews and others, Reference Andrews2014, Reference Andrews2018; Gagliardini and Werder, Reference Gagliardini and Werder2018; Yang and others, Reference Yang2020). This exciting potential application of empirical regression models relating observed meltwater area proportion to modeled surface runoff warrants further investigation.
One limitation of this study is the intermittent acquisition of clear-sky Landsat 8 images over our study area. Just a small number of observations (five each) were used to create the regression models presented in Figure 7. Therefore, these regression models are sensitive to the inclusion or removal of data points. Additionally, the evolution of supraglacial lakes and rivers is influenced by ice surface topography (Ádám and others, Reference Ádám2016; Crozier and others, Reference Crozier, Karlstrom and Yang2018) and crevassing, which are not captured by climate model simulations. Therefore, we do not recommend using climate models to directly compute surface meltwater area proportions. Instead, we suggest that the primary utility of such regressions (e.g. Fig. 7) is to parameterize ice-sheet runoff models (Smith and others, Reference Smith2017; Yang and others, Reference Yang2018, Reference Yang2020).
5.3 Modeled and observed ice-sheet surface runoff
Of the three climate models examined here, MERRA-2 best matches both satellite-observed surface meltwater area and proglacial discharge (Figs 4, 8). This result is consistent with previous reports of reasonable agreement between MERRA-2 and supraglacial river discharge (Smith and others, Reference Smith2017) and lake infilling rate (Yang and others, Reference Yang2019a). MERRA-2 replicates proglacial discharge in the Watson River more closely than MAR and RACMO, particularly in the early melt season (Fig. 7). Moreover, MERRA-2 simulates more surface runoff at higher elevations (>1400 m) than lower elevations (<1400 m), which is consistent with our observations of a well-developed supraglacial hydrologic network there (Fig. 4e). The reason for this is unclear and lies beyond the scope of this study, but one possible explanation might be that MERRA-2 uses spatially variable albedo and fractional snow cover (Reichle and others, Reference Reichle2017), possibly better representing GrIS surface energy balance.
Proglacial discharge is commonly compared with modeled surface runoff (Overeem and others, Reference Overeem2015; Smith and others, Reference Smith2015; van As and others, Reference van As2017) but large discrepancies are common due to subglacial delays and other processes (Rennermalm and others, Reference Rennermalm2013; Overeem and others, Reference Overeem2015; Smith and others, Reference Smith2015; van As and others, Reference van As2017). While our focus here is on meltwater area and storage volume, not discharge, we suggest that remotely sensed meltwater area and storage may correlate with proglacial discharge as much or more than modeled runoff (Fig. 8). Therefore, observations of time-evolving supraglacial hydrologic network should be included in models that simulate proglacial discharge. The contributions of surface meltwater at high elevations (>1600 m), in particular, warrant further study.
5.4 Issues of temporal and spatial scale
This study used a seasonal time series of seven Landsat 8 images to track the evolution of surface meltwater on the southwest GrIS during a colder-than-average melt season. However, seven satellite images are likely intermittent to comprehensively reveal the temporal evolution of a highly dynamic supraglacial hydrologic network (Liang and others, Reference Liang2012; Chu, Reference Chu2014; Yang and others, Reference Yang, Karlstrom, Smith and Li2017). The 30 m resolution of Landsat 8 also overestimates the widths of large supraglacial rivers due to mixed pixels (Yang and Smith, Reference Yang and Smith2016), while failing to detect numerous small supraglacial streams (Figs S2, S3). We suggest that these mapping uncertainties influence absolute river area proportions, but not their relative pattern (e.g. high-elevation vs. low-elevation comparisons). As the number of higher-resolution satellites increase (e.g. Sentinel-2A/B twin satellites with 10 m spatial resolution; Planet CubeSats with 3–5 m spatial resolution), the prospects for investigating the temporal evolution of supraglacial hydrologic network at finer temporal and spatial scales will improve (Williamson and others, Reference Williamson, Banwell, Willis and Arnold2018a; Yang and others, Reference Yang2019b).
6. Conclusions
Using multi-temporal Landsat 8 satellite imagery, we quantified the evolving area and volumetric storage of supraglacial meltwater lakes and rivers on the southwest GrIS during summer 2015, a colder-than-average year. Supraglacial rivers dominate total surface meltwater area and discharge, whereas supraglacial lakes dominate total surface meltwater volume. Owing to their greater storage capacity, lakes require more time to fill and attain maximum area 7–10 d later than supraglacial rivers, confirming that rivers respond rapidly to surface runoff variations. Some supraglacial rivers and lakes drain into moulins at high elevations (>1600 m), signifying the presence of high-elevation surface-to-bed meltwater connections even in a relatively cold year.
Remote sensing of time-varying supraglacial hydrology offers a unique opportunity to validate and improve climate model simulations of ice-sheet runoff. In particular, we present a first quantitative relationship that correlates modeled surface runoff with satellite-observed surface meltwater area proportion, signifying that surface melting intensity drives the formation of supraglacial hydrologic networks. Integrating satellite observations with climate models should therefore improve the parameterization of ice-sheet runoff models, and mechanistic understanding of how surface mass balance drives ice-sheet runoff, moulin inputs and associated subglacial water pressures.
Supplementary material
The supplementary material for this article can be found at https://doi.org/10.1017/jog.2021.10.
Acknowledgements
K.Y. acknowledges support from the Strategic Priority Research Program of the Chinese Academy of Sciences (XDA19070201), the National Natural Science Foundation of China (41871327) and the Fundamental Research Funds for the Central Universities (14380070). L.C.S. and M.G.C. acknowledge support from the NASA Cryospheric Science Program (80NSSC19K0942) managed by Thorsten Markus. Data and codes used to generate results reported in this study are available through Figshare (https://doi.org/10.6084/m9.figshare.9770798.v1).


 Open access