


1. Introduction
When polar firn transforms into ice, i.e. loss of permeability, the surrounding atmospheric gases are trapped in the ice matrix as air bubbles (e.g. Cuffey and Paterson, Reference Cuffey and Paterson2010). In the depths of inland ice sheets, air bubbles crystallize into air clathrate hydrates (Shoji and Langway, Reference Shoji and Langway1982). The air constituents preserved in the air bubbles and hydrates (air inclusions) provide unique archives to reconstruct past atmospheric compositions (e.g. Petit and others, Reference Petit1999). Moreover, gases extracted from polar ice cores are useful as various climate proxies. For example, the composition ratio of nitrogen and oxygen, N2/O2 (or O2/N2), is known to co-vary with local summer insolation (Bender, Reference Bender2002). Such ratios are therefore used to construct an ice core chronology (Kawamura and others, Reference Kawamura2007). Although little is known about how the N2/O2 climate signal forms, it is believed to originate from changes in surface-snow texture caused by solar radiation: the snow texture might determine the duration of firn-to-ice transition and thus might determine the degree of gas fractionation during bubble close-off (Fujita and others, Reference Fujita, Okuyama, Hori and Hondoh2009; Lipenkov and others, Reference Lipenkov, Raynaud, Loutre and Duval2011).
For correct interpretation of gas records, understanding of processes in ice sheets that alter gas compositions is crucially important. In the most upper part of firn, bulk movement of gases (convection) can mix air rapidly inside pores with the atmosphere above the snow surface. However, at deeper depths, where air is stagnant, the dominant mechanism for gas transport is molecular diffusion. In deep firn, heavier gas components tend to settle to the bottom of firn because of gravity effects (Craig and others, Reference Craig, Horibe and Sowers1988), while they are also subject to migration towards colder regions (Severinghaus and others, Reference Severinghaus, Grachev and Battle2001), both resulting in gas fractionation. Moreover, in the process of bubble close-off, gas separation is regarded as occurring during gas transport from compressed air bubbles to open pores connected to the atmosphere because of differences in diffusivity through the lattice of ice crystals between gas species (Huber and others, Reference Huber2006; Severinghaus and Battle, Reference Severinghaus and Battle2006). Even in deep ice, the modification of gas compositions is unavoidable: molecular-size-dependent gas diffusion from air bubbles to hydrates is known to take place at depths where air bubbles and clathrate hydrates coexist (the so-called bubble-to-hydrate transition zone) (Ikeda and others, Reference Ikeda1999; Ikeda-Fukazawa and others, Reference Ikeda-Fukazawa, Hondoh, Fukumura, Fukazawa and Mae2001).
Micro-Raman spectroscopy, which can provide information about the gas composition of each air inclusion (Nakahara and others, Reference Nakahara, Shigesato, Higashi, Hondoh and Langway1987), is a powerful tool to investigate gas fractionation phenomena in polar ice, as described below. Measurements of N2/O2 inside individual air bubbles at various depths in the EDML Antarctic ice core were performed by Weikusat and others (Reference Weikusat, Freitag and Kipfstuhl2012). They found that small bubbles, with a diameter less than 200 μm, in deep ice are enriched markedly in O2 compared to larger bubbles. They inferred that phenomenon to be an effect of pressure relaxation during storage of the core. Considerable gas fractionation has been found from micro-Raman analyses of air inclusions in the bubble-to-hydrate transition zones of Vostok and Dome Fuji, Antarctica (Ikeda and others, Reference Ikeda1999; Ikeda-Fukazawa and others, Reference Ikeda-Fukazawa, Hondoh, Fukumura, Fukazawa and Mae2001). These observations show clearly that O2 is enriched in clathrate hydrates, while it is depleted in air bubbles. The observed differences in N2/O2 between the air bubbles and hydrates in the transition zones have been attributed to higher gas permeation (the product of gas diffusivity and solubility) of O2 in the ice matrix than that of N2.
Only one report in the relevant literature describes the application of micro-Raman spectroscopy to the investigation of air bubbles in firn (Ikeda and others, Reference Ikeda1999), probably because of two difficulties related to measurement. The first difficulty is detection of the extremely weak Raman signals from firn samples. Because of the low overburden pressure, the density of gases inside bubbles is lower in firn than in deep ice, considerably reducing the Raman scattering intensity. The second difficulty is microscopic observation inside ‘un-transparent’ firn. In firn, snow–air interfaces with large areas and irregular shapes give rise to the strongly-diffused reflection of the observation light that severely disturbs the optical path for measurement. Consequently, earlier work necessarily relied on extremely long laser exposure times (a few hours) to obtain a single spectrum from a shallow sample (Ikeda and others, Reference Ikeda1999). In this work, we demonstrate that the combined use of pure rotational Raman spectroscopy and the inert-fluid immersion method can overcome these difficulties.
2. Methods
Instead of using traditional vibrational Raman spectroscopy, we have applied pure rotational Raman spectroscopy to the measurement of air bubbles in polar firn.
Pure rotational energy levels of a linear molecule such as N2 or O2 in the rotational quantum state J are

where h is Planck's constant, c represents the velocity of light, B is the rotational constant and D is the centrifugal distortion constant (Atkins and Paula, Reference Atkins and Paula2014). Because of the rotational Raman selection rule, the energy-level transitions with ΔJ = ± 2 (change in the rotational quantum number is + 2 or −2) are Raman-active for a linear molecule (Atkins and Paula, Reference Atkins and Paula2014). ΔJ = + 2 corresponds to Stokes Raman scattering, while ΔJ = –2 corresponds to antiStokes Raman scattering. Because of strong scattering intensity, Stokes scattering rather than antiStokes scattering is usually analyzed in Raman spectroscopy.
The differential backscatter cross section for a Stokes line of the pure rotational Raman spectrum is

where g is the statistical weight factor, which depends on the nuclear spin I. Also, ν 0 stands for the incident light frequency, Δν denotes the frequency shift, γ signifies the anisotropy of the molecular polarizability tensor, k is Boltzman's constant and T expresses the temperature (Penny and others, Reference Penny, Peters and Lapp1974). The intensity in a pure rotational line is proportional to σ, the incident light power and the density of molecules of interest.
In the pure rotational Raman spectra, as a result of nuclear statistics, N2 shows alternation in intensity (Fig. 1), whereas transitions between even values of J are missing in O2 (Fig. 1). A pure rotational Raman spectrum of air is regarded as the superposition of the Raman lines from N2 and O2 (Fig. 2). Pure rotational Raman signals from other Raman-active species in air, such as CO2, are too small compared with those of the two dominant atmospheric components. As depicted in Figure 3, Raman scattering of air (N2 and O2) from pure rotational modes is considerably stronger than that from vibrational modes, providing a benefit for the measurement of N2 and O2 gases with low density, as in the case for air bubbles in polar firn. Deconvolving heavily overlapped lines from N2 and O2 into two peaks is difficult (Fig. 2). Measurements of minor lines usually result in a poor signal-to-noise ratio, giving rise to considerable experimental error. Therefore, for this study, N2/O2 in air bubbles in polar firn was estimated by analyzing the pure rotational Raman intensities of strong and isolated lines.

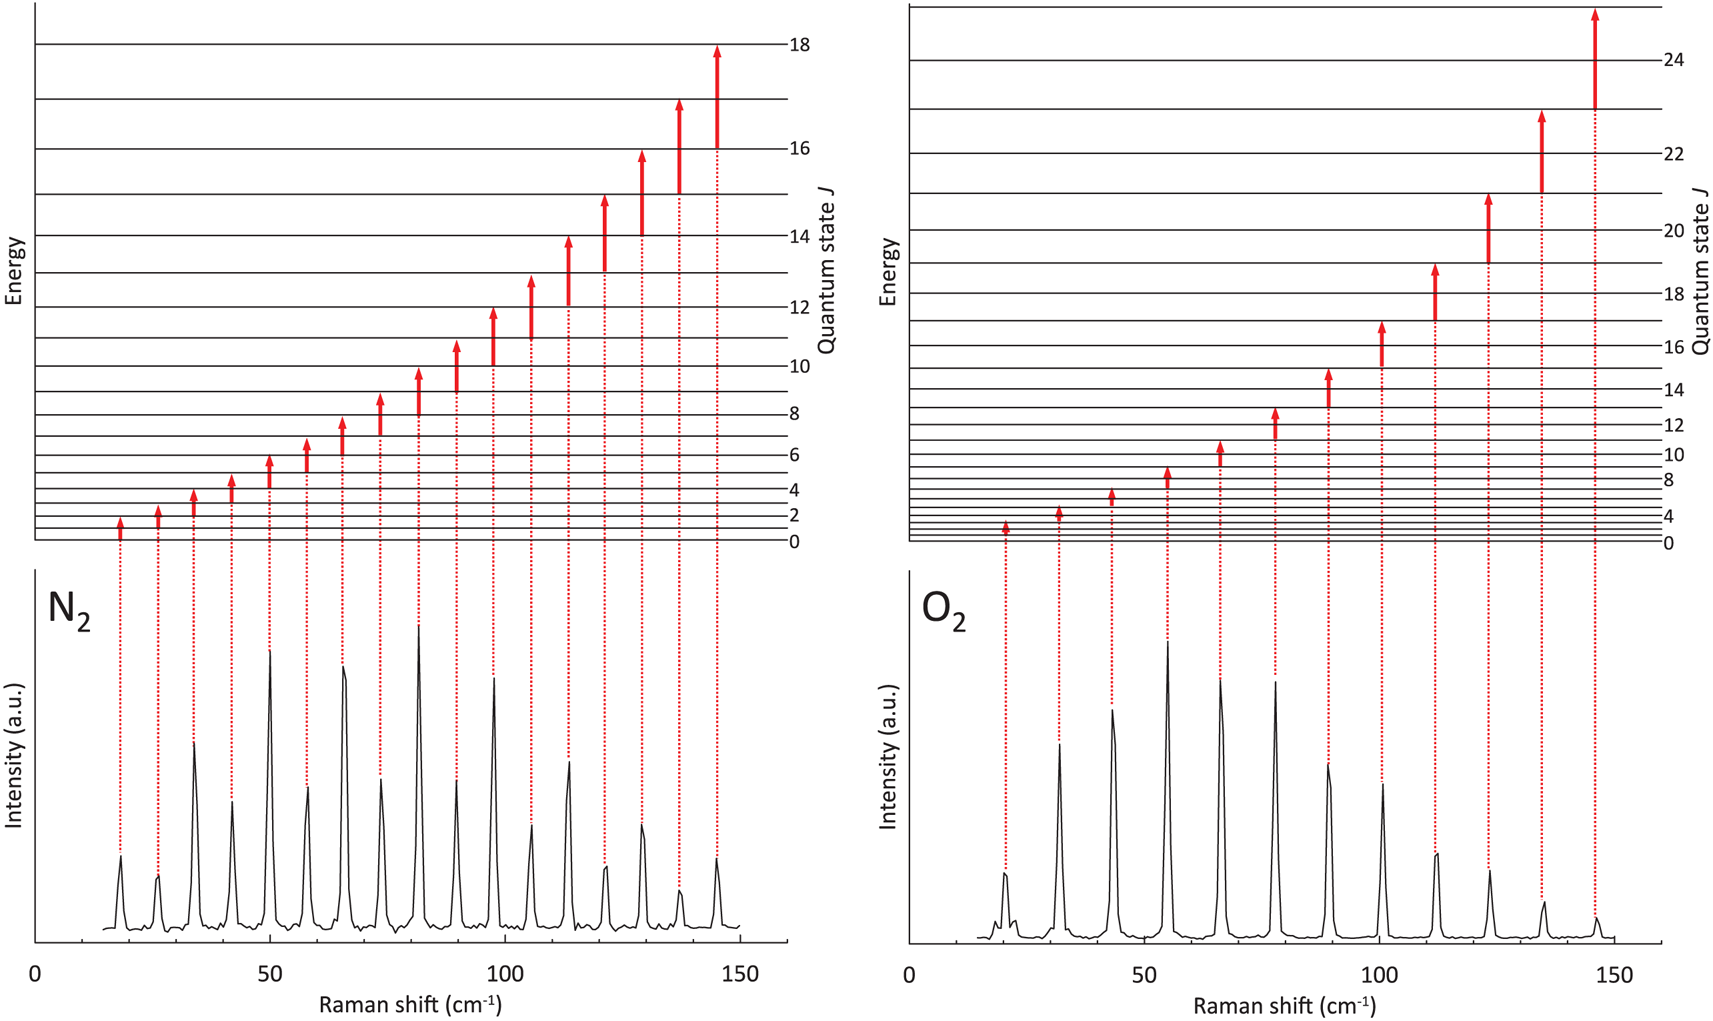
Fig. 1. Pure rotational Raman spectra of N2 and O2 measured at −15°C and 0.1 MPa. Schematics above the spectra indicate pure-rotational energy-level transitions which cause each Raman line.
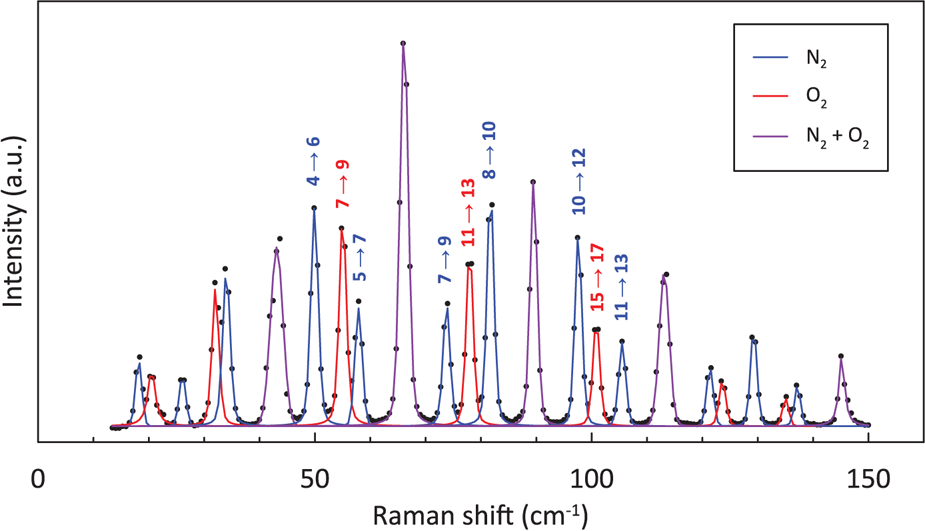
Fig. 2. Pure rotational Raman spectra of air at −15°C and 0.5 MPa. Numbers above lines denote the energy-level transition which causes the lines.
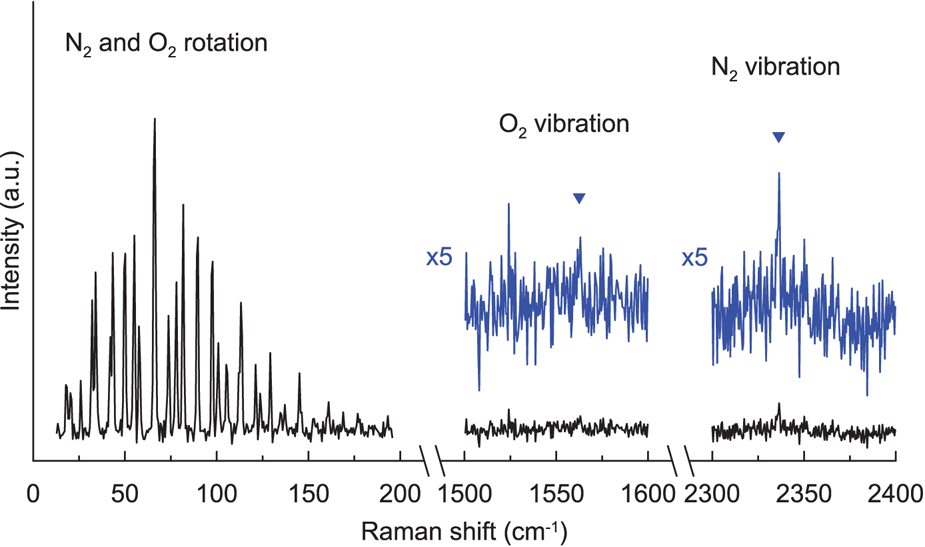
Fig. 3. Pure rotational and vibrational Raman spectra of ambient air at room temperature and atmospheric pressure.
In that equation, α is a correction factor (an apparatus-dependent constant), $I_{N_2}$ and $I_{O_2}$
 , respectively represent the scattering intensities of pure rotational Raman lines for N2 and O2, and subscript J x→x+2 denotes the energy-level transition which causes pure rotational Raman scattering (Figs 1, 2). By analyzing the relative intensities of pure rotational Raman lines in ambient atmospheric air (N2/O2 = 3.7), α in our experimental setup was found to be 2.0.
We used Fluorinert FC-40TM (3M Inc.), a stable fluorocarbon-based transparent fluid, to suppress diffused reflection at snow–air interfaces. The pour point and density of FC-40 are, respectively, −57°C and 1.87 g cm−3 at 25°C. Importantly, its water solubility is extremely low (<5 ppmw). Also, its refractive index (1.29 at 25°C) is very close to that of ice (1.31). By replacing atmospheric gas with the Fluorinert, the intensity of diffused reflection at the interfaces is reduced by two orders of magnitude. As portrayed in Figure 4, ‘white’ firn becomes ‘transparent’ with the Fluorinert-immersion technique, thereby enabling microscopic observation inside firn. A Raman spectrum of Fluorinert FC-40 exhibits no lines in the low-frequency range (<120 cm−1). It, therefore, does not disturb the pure rotational Raman measurement of air.

Fig. 4. Firn section of the JARE39 core (from 51 m depth) in the optical cell: (a) in air and (b) immersed in the fluorocarbon-based inert fluid (Fluorinert FC-40TM). The scale bar in each image is 1 cm.
An Antarctic firn core (JARE39) was analyzed to test the new methods described above. The JARE39 core, 108 m long, was retrieved by the 39th Japanese Antarctic Research Expedition (JARE39) in 1998 at the Dome Fuji station (77°19′S 39°42′E). This site is characterized by annual mean temperature of −54°C and annual accumulation rate of 25.2 (±0.2) kg m−2 a−1 (Igarashi and others, Reference Igarashi2011). After transportation to the Institute of Low Temperature Science, Hokkaido University, Sapporo, Japan, the firn core was stored in a cold room at −50°C. The pore close-off depth at Dome Fuji was estimated as ~104 m (Watanabe and others, Reference Watanabe1997). In inland Antarctica, pore closure takes place mostly in the deepest several tens of meters of the firn (Burr and others, Reference Burr2018). Consequently, firn cores at depths of 51 and 90 m (the former and latter, respectively correspond to the initial and middle stages of the closure process) were used as test samples. Densities at 51 and 90 m were estimated, respectively, as 655 and 795 kg m−3 (Fujita and others, Reference Fujita2016). Samples were prepared in a cold room at −20°C. Using a band saw, the innermost parts of the core 94 mm in diameter were cut into sections ~7 mm thick, 7 mm width and 30 mm long along the core axis (Fig. 4). The firn section was put into an optical cell made of quartz glass (10 × 10 × 58 mm) with a screw cap. Then the cell was filled with Fluorinert FC-40 precooled at −20°C (Fig. 4). The firn sample immersed in Fluorinert FC-40 was transferred to a cold chamber of a spectrometer set at −15°C.
Details of the cold chamber and sample-cooling system were presented in an earlier report by Sakurai and others (Reference Sakurai2010). In prior work, the temperature inside the chamber was controlled by regulating the flow rate of cold N2 gas evaporated from liquid nitrogen, but the N2 gas surrounding a sample gives rise to noticeable background Raman scattering in pure rotational Raman measurements because of large scattering cross-sections for the rotational modes. Consequently, in place of liquid nitrogen, liquid argon, which is Raman-inactive, was used as a coolant for this experiment. Pure rotational Raman spectra of samples were obtained using a triple monochromator (T6400; Horiba, Ltd.) with three 1800 gr. mm−1 gratings (Plane Holographic Package Aberration Correction Grating; Horiba, Ltd.), and a CCD detector (Symphony II; Horiba, Ltd.). The subtractive configuration of the monochromator was used for pure rotational Raman measurements: in the subtractive mode, the first and second gratings function as a filter to remove Rayleigh scattering, enabling one to obtain spectral information very close to the laser line (Gauglitz and Vo-Dinh, Reference Gauglitz and Vo-Dinh2003). Incidentally, for a spectrometer with a single grating, which cannot use the subtractive mode, low-wavenumber Raman measurements can be achieved by installing an ultra-narrow-line notch filter in the spectrophotometer system (Glebov and others, Reference Glebov2012). Air bubbles inside the firn were observed using a microanalysis system (RSM-500; Horiba, Ltd.) connected to the monochromator. Laser light of 532 nm wavelength with the power of 700 mW (mpc3000; Laser Quantum) was focused on a bubble through the optical window of the cell using a long-working-distance objective lens with a focal length of 13 mm (M Plan Apo 50 × ; Mitutoyo Corp.). Backscattered light was corrected with the objective lens and was sent to the spectrometer system. Using the multi-channel CCD detector, superimposed pure rotational Raman spectra from N2 and O2 were acquired at the same time (Fig. 2). It is noteworthy that distant vibrational Raman lines from N2 and O2 (Fig. 3) are usually recorded separately. The simultaneous signal acquisition for N2 and O2 provides better accuracy of the relative line intensity between the two components. This is because the optical path and laser focal point during measurement, which may change with time due to various factors (e.g. thermal drift of a sample) in the case of the separate signal acquisition, are regarded as being completely the same for the two components. The acquisition time for one spectrum was 180 s. Raman frequencies were calibrated using neon emission lines. To estimate N2/O2 using Eqn (3), deconvolution of the pure rotational Raman lines was performed using a commercial peak-fitting program (GRAMS/AI; Galactic Industries Corp.).
3. Results and discussion
Through the window of the optical cell and the Fluorinert, air bubbles inside the firn were clearly observable (Figs 5a–c). Figures 5d–f show that, despite the short data acquisition time, the simultaneous use of pure rotational Raman spectroscopy and the inert-fluid immersion technique can support sufficient intensity of Raman lines for analyses of air bubbles inside firn. For each air bubble, measurements were repeated 5–8 times. The mean N2/O2 values calculated using Eqn (3) are presented in Table 1. Additionally, twice the standard errors of N2/O2 calculations are shown as measurement errors (Table 1). The range of measurement errors was 0.2–1.9, depending on the scattering intensity from a bubble.

Fig. 5. (Left) Micrographs of air bubbles in the firn from depths of 51 m (a) and 90 m (b, c). The scale bar in each image is 50 μm. (Right) Pure rotational Raman spectra of the bubbles. Panels d–f, respectively, portray the spectra of bubbles (a–c).
Table 1. N2/O2 of air bubbles in the JARE39 firn core, where SE denotes a standard error of the N2/O2 measurements

At 51 m, two air bubbles were analyzed (Table 1). The composition ratios of N2 and O2 for the bubbles are presented, respectively, as 4.1 and 4.3 (Table 1). Although these values are slightly larger than that of the atmospheric composition (3.7), the observed differences are within experimental error (twice the standard error). To clarify this point, further measurements are necessary.
At 90 m, six air bubbles were investigated (Table 1). It is particularly interesting that N2/O2 values in this sample were observed over the wide range of 3.6–8.8 (Table 1). Judging from the reproducibility of N2/O2 measurements (SE × 2 in Table 1), differences in the measurements between the bubbles are significant in most cases. For most bubbles, N2/O2 values are significantly higher than the atmospheric composition. Enrichment of nitrogen (depletion of oxygen) in bubbles was also reported from bulk gas measurements of Antarctic coastal ice core D-10 at a bubble-close-off depth (55 m) by Sowers and others (Reference Sowers, Bender and Raynaud1989). Furthermore, our findings are consistent with measurements of noble gases, oxygen, and nitrogen in firn air (atmosphere in open pore channels) in the firn–ice transition region, where bubbles are closing off, at polar sites (Huber and others, Reference Huber2006; Severinghaus and Battle, Reference Severinghaus and Battle2006). After accounting for well-known gravitational effects (Craig and others, Reference Craig, Horibe and Sowers1988), they found systematic enrichments of elemental ratios of Ne/He, O2/N2, O2/Ar and Ar/N2 with depth. These observations have been interpreted as a result of molecular-size-dependent gas fractionation during bubble formation: small gases, such as Ne, O2 and Ar are preferentially excluded from shrinking or occluding bubbles (Ikeda and others, Reference Ikeda1999; Ikeda-Fukazawa and others, Reference Ikeda-Fukazawa, Hondoh, Fukumura, Fukazawa and Mae2001). These gases, therefore, accumulate in the residual firn air. It is noteworthy that the molecular weight of O2 is greater than that of N2, although the van der Waals diameter of O2 is smaller than that of N2 (Ikeda and others, Reference Ikeda1999). Using molecular dynamics simulations, Ikeda-Fukazawa and others (Reference Ikeda-Fukazawa, Kawamura and Hondoh2004) confirmed that the effective molecular size, rather than the molecular mass, is important for gas diffusion through the ice lattice.
The variety of N2/O2 values observed at 90 m (Table 1) indicates clearly that the degree of gas fractionation is variable between the air bubbles, even at the same depth. The stochastic nature of bubble formation might be responsible for this phenomenon: the earlier the air bubbles form (the longer duration), the further gas fractionation progresses. As reported by Burr and others (Reference Burr2018), progressive closure of pores takes place in firn. To investigate the gas fractionation after bubble formation in firn, Kobashi and others (Reference Kobashi2015) analyzed δAr/N2 data from the GISP2 (Greenland Ice Sheet Project 2), North GRIP (North Greenland Ice Core Project) and Dome Fuji ice cores by using a numerical model of gas loss from air inclusions (Ikeda-Fukazawa and others, Reference Ikeda-Fukazawa2005). They found that air bubbles formed in the shallow firn are so depleted in δAr/N2 at the bubble close-off depth and thus dominate the total δAr/N2 changes in spite of their smaller air contents.
At Vostok, five bubbles were measured at the surface. Six bubbles were analyzed at 83 m (Ikeda and others, Reference Ikeda1999). The average composition ratios of N2 and O2 for the bubbles were 3.9 at the surface. That for the 83 m was 3.7. The observed range of N2/O2 values at the deeper depth (3.2–4.1) was slightly wider than at the surface (3.8–4.1). For these measurements, experimental error (reproducibility of each N2/O2 measurement) was not shown. Although their N2/O2 values were close to the atmospheric ratio at both depths, it seems that the earlier observations were consistent with the discussion above in terms of an increase in the N2/O2 variety with depth.
As described herein, we demonstrate that the application of pure rotational Raman spectroscopy improves the efficiency of the N2/O2 analysis of air bubbles in polar firn considerably. For a comprehensive understanding of gas separation processes between the air bubbles and open pores in polar firn, systematic N2/O2 measurements for polar firn cores using the new methods presented herein are now underway.
Acknowledgements
We thank all participants for fieldwork, ice sampling, and logistic support. The present research is supported by a Grant-in-Aid for Scientific Research on Creative Scientific Research, Japan. This study was supported by MEXT/JSPS KAKENHI grants 18H05292 and 18H05294, the Joint Research Program of the Institute of Low Temperature Science, Hokkaido University, and the General Collaboration Project of the National Institute of Polar Research.


 Open access