


Introduction
The c-axis Fabric of an ice sample reflects its deformational history and affects its softness for further deformation (e.g. Reference HookeHooke. 1981; Reference Azuma and HigashiAzuma and Higashi, 1985: Reference Dahl-Jensen and GundestrupDahl-Jensen and Gundestrup, 1987; Reference Fujita, Nakawo and MaeFujita and others. 1987: Reference AlleyAlley. 1988; Reference Budd and JackaBudd and Jacka, 1989; Reference Lipenkov, Barkov, Duval and PimientaLipenkov and others, 1989; Reference PatersonPaterson. 1991; Reference Van der Veen and WbillansVan der Veen and Whillans, 1994). Ordinarily, thin-section fabric stuck involves optically measuring the orientations of c axes of ≈ 100 grains or more, using a Rigsby universal Stage, and then presenting the data as a scatter plot or contour plot on an equal-area projection (Reference LangwayLangway, (1958). Given the tedious nature of the measurements, further data usually have not been collected, although Reference Gow and WilliamsonGow and Williamson (1976) examined relationships between ≈-axis orientations and grain-size, and Reference RigsbyRigsby (1968) traced individual grains through serial thin sections to map three-dimensional grain shapes.
Here, we present a method for mapping the spatial patterns of c-axis orientations in adjacent grains, which may provide a significant increase in the scientific return for a small increase in the tedium of the measurement. We demonstrate this method by addressing a single question in grain growth, but we believe the method is more generally applicable. Throughout, we follow the metallurgical convention of treating “grain” and “crystal” as synonymous, which is accurate in ice though not necessarily in shallow firn (Reference GowGow, 1969).
Problem
The cross-sectional area of crystals in ice is observed to increase linearly with increasing age in the nearly isothermal upper parts of cold ice sheets (Reference GowGow. 1969; Reference Alley, Perepezko and BentleyAlley and others. 1986. The curvature and surface tension of grain boundaries cause the pressure, and thus the chemical potential, to be higher on the concave side of a boundary than on the convex side. Molecules diffuse down the gradient in chemical potential from the concave side to the convex side of the boundary, causing the grain boundary to move towards its concave side. Because a boundary between two grains usually is concave toward the smaller grain, small grains shrink until they disappear, causing the average grain-size to increase in a process analogous to growth of soap bubbles (e.g. Reference VerhoevenVerhoeven, 1975. p. 203–06).
At many sites, however, including Byrd Station. Antarctica (Reference Gow and WilliamsonGow and Williamson. 1976), and Dye 3 (Reference Herron, Langway, Brugger, Langway, Oeschger and DansgaardHerron and others, 1985), GISP2 (Reference Gow, Meese, Alley and FitzpatrirkGow and others, 1993; Reference WoodsWoods, 1994) and GRIP (Reference Thorsteinsson and EickenThorsteinsson and others, 1993). Greenland, (his growth slops at an age and depth (near 400 m at Byrd Station; Fig. 1) where there is no obvious change in the temperature, impurity content, c-axis fabric or other properties of the ice. This is different from the downward decrease in grain-size into ice-age ice observed at Byrd Station (below 1200 m in Figure 1) and at other sites (e.g. Reference Duval and LoriusDuval and Lorius 1980) for Dome C and Reference Lipenkov, Barkov, Duval and PimientaLipenkov and others (1989) for Yostok, Antarctica; Reference Langway, Shoji and AzumaLangway and others (1988) for Dye 3, Reference Gow, Meese, Alley and FitzpatrirkGow and others (1993) and Reference WoodsWoods (1994) for GISP2, and Reference Thorsteinsson and EickenThorsteinsson and others (1993) for GRIP, Greenland), which is correlated with large changes in other physical properties.
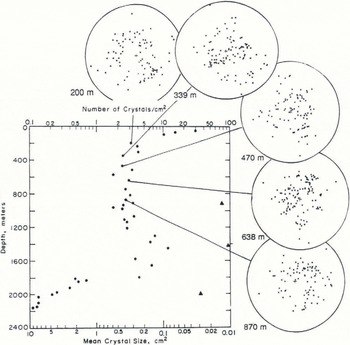
Fig. 1. c-axis scatter plots relative to grain-size variations in the Byrd Station deep core, Grain-sizes were measured by Reference Gow and WilliamsonGow and Williamson (1976); ordinary ice is shown by solid circles, and anomalously fine-grained, volcanic-ash-rich horizons by triangles. Notice that grain growth with increasing depth stops near 400 m, within the range of depths considered in our study. The grain-size decrease below 1200 m is related to Wisconsinan-age ice, and the grain-size increase near the bed may be the product of high-temperature annealing (Reference Gow and WilliamsonGow and Williamson, 1976). All thin sections were cut horizontally, and c-axes are plotted on equal-area nets. The center of each net is the core axis, which is approximately vertical.
We will concentrate on samples from Byrd Station. Three working hypotheses to explain why grain growth stops below 400 m are:
-
(1) Boundary pinning, involving impurity or dust content of the ice being large enough that the impurity drag equals the driving force for grain growth for the grain-size at 400 m and no further growth is possible: in short, the boundaries are pinned (Reference Alley, Perepezko and BentleyAlley and others, 1986).
Alternatively, below 4(10 m new grains may be created at the same rate as old grains disappear. The new grains may be produced by (e.g. Reference VerhoevenVerhoeven, 1975, chapter 10):
-
(2) Recrystallization, involving new, strain-free grains that nucleate and grow with c axes at high angles to the c axes of their neighbors; or
-
(3) Polygonization, involving progressive rotation of sub-grains until they become new grains.
Reference PoirierPoirier (1985) refers to case (2) as migration recrystallization and case (3) as rotation recrystallization; we follow Reference VerhoevenVerhoeven (1975) in calling these recrystallization and polygonization.
Grain boundaries interact with impurities and second-phase particles (e.g. Reference VerhoevenVerhoeven, 1975, p. 207 11), allowing the possibility of boundary pinning. For example, a particle intersected by a grain boundary replaces some of the area of that boundary. When a migrating grain boundary pulls away from a particle, enough new boundary must be created to replace the area that was occupied by the particle. Because the boundary has an associated energy, creating new grain-boundary area raises the free energy of the system. If enough particles are present, the reduction in free energy caused by grain growth will not balance the increase in free energy caused by separation from particles, and grain growth will stop. Addition of second-phase particles is widely used in metallurgical practice to prevent undesired grain growth (e.g. Reference VerhoevenVerhoeven, 1975, p. 210), and second-phase particles can have similar effects in ice (e.g. Reference Duval and LoriusDuval and Lorius, 1980).
In recrystallization, it is believed (e.g. Reference VerhoevenVerhoeven, 1975, chapter 10) that strain-free grain nuclei form in a strained ice matrix by any one of several mechanisms. Molecules diffuse to a small nucleus and cause it to grow because the contrast in stored strain energy (dislocations, vacancies, stacking faults, etc.) between the nucleus and the surrounding ice matrix has a larger effect on the chemical-potential gradient across the grain boundary of the nucleus than do the curvature and surface tension of the boundary. Diffusion across a grain boundary is rapid, giving the boundary high mobility, when a large mismatch in lattice orientations between adjacent grains produces a disordered, high-angle grain boundary. Diffusion across a boundary is slow, giving the boundary low mobility, when the adjacent grains have similar orientations. Nuclei that grow rapidly enough to reach macroscopic size before being consumed by other nuclei are likely to be those that have high-mobility boundaries because they formed at high angles to their neighbors. Recrystallization thus is expected to produce ice with abundant grains at high angles to their neighbors (e.g. Reference PoirierPoirier, 1985, p. 75). Indeed, the onset of recrystallization in ice is usually associated with large changes in c-axis fabrics (Reference Budd and JackaBudd and Jacka, 1989; Reference AlleyAlley, 1992), as one would expect if the nuclei of new grains form at large angles to old grains.
Polygonization occurs when a pre-existing grain is split into two or more new grains with similar orientations, through the alignment of dislocations into low-angle grain boundaries. Deformation of ice produces dislocations such as the edge dislocations shown in Figure 2a, each of which is an extra plane of molecules oriented normal to the plane of the figure and extending upward along the leg of the inverted-“T” symbol shown. Interactions of the elastic stress fields of these dislocations tend to cause them to slide to the positions shown in Figure 2b. essentially “on top of one another” (Reference Weertman and WeertmanWeertman and Weertman, 1964, p. 66–67). The occurrence of many such extra planes of molecules in a narrow region causes a misorientation of the ice lattices on either side, as shown in Figure 2b. That narrow region is called a low-angle, “till” grain boundary. Formation of such a boundary splits a pre-existing grain into two grains with similar orientations, and thus reduces the average grain-size in a sample.
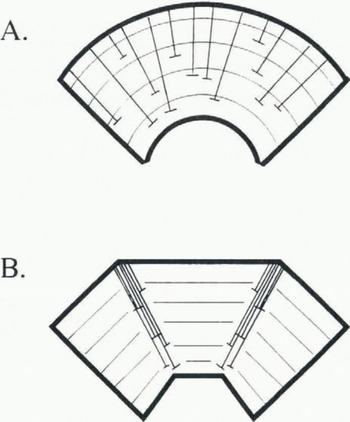
Fig. 2. Diagram illustrating the process of polygonization. a. Bending of the grain has produced edge dislocations, which are extra planes of molecules extending upward along the stems of the inverted “T” symbols, b. The dislocations have glided to minimize the elastic strain energy. The occurrence of several extra planes of molecules in a narrow region causes the ice lattice on one side to be tilted significantly from that on the other side. Such a narrow region is called a low-angle, “tilt” grain boundary, and the single original grain has been subdivided or polyganized. In this case, two till boundaries are shown producing three grains from one initial grain. The tilting shown is exaggerated.
Recrystallization in the laboratory produces strong ring or multi-pole fabrics (e.g. Reference Budd and JackaBudd and Jacka. 1989) quite different from those shown in Figure 1 from our samples, suggesting that recrystallization involving growth of new. strain-free grains has not occurred in our samples. Grain-growth calculations using measured impurity and dust concentrations suggest that boundary pinning should not have occurred in our samples, although boundary pinning probably is important in the anomalously fine-grained, volcanic-ash-rich layers shown by triangles in Figure 1 (Reference Gow and WilliamsonGow and Williamson. 1976; Reference Alley, Perepezko and BentleyAlley and others. 1986). Additionally, the grains from near and below 400 m show strain shadows also called undulatory extinction; Reference Gow and WilliamsonGow, and Williamson. 1976). These are caused by slight misorientations of regions within a grain, and thus are an intermediate step to polygonization, said to have occurred when boundaries are clearly visible between misoriented regions. Thus, it can be argued that polygonization is the most likely explanation for the stabilization of grain-size below 400 m at Byrd Station.
We can test whether boundary pinning, recrystallization involving nucleation and growth of strain-free grains, or polygonization is most important by mapping c-axis fabrics. Boundary pinning should preserve a population of grains, causing nearest-neighbor relations from below 100 m to be similar to those above, which are random as shown in the next section. Recrystallization should cause an increase in large angles between c-axes of neighboring grains below 100 m. Polygonization should cause an increase in small angles between c-axes of neighboring grains below 400 m. Our test is described in the next section. We ask whether below 400 m the observed grains have more, as many, or fewer nearest neighbors with similar c-axis orientations than would occur if the same population of c axes were present but the nearest neighbors of grains were randomly chosen.
Method and Results
We analyzed live thin sections from the Byrd core (Table 1). All were cm when the core was drilled in 1967–68, and have been archived ever since at the U.S. Army Cold Regions Research and Engineering Laboratory (CRRFL) at –30 ° G. Comparison of the sections today with photographs taken in 1968 shows that, aside from a little sublimational thinning, there have been no changes in texture. This excellent preservation of the original texture is a result of the ice having been stored as thin sections rather than in the bulk (Reference GowGow, 1987). Furthermore, scatter plots of c axes measured today agree well with the original measurements made during the period 1968 70 (cf. Figure 1; Reference Gow and WilliamsonGow and Williamson (1976)).
Table 1. Byrd Station ice-core thin sections measured in this study. The statistical confidence level that the number of pairs in the first bin is greater than would occur with a random distribution is given in the final column; if observed = expected in the first bin, this confidence would he 50%

We re-photographed each section (Fig. 3). We then used a Rigsby stage to measure the c-axis orientations (Fig. 1) of the ≈ 100 contiguous grains on each section that could be observed with confidence (Table 1). We used the techniques described by Reference LangwayLangway (1958 with the refraction corrections of Reference KambKamb (1962), in the same way as Reference Gow and WilliamsonGow and Williamson (1976). Each grain was numbered on its picture, and the orientation data were recorded with the identification number.

Fig. 3. Crystalline textures of ice used in the present study. Photographs were taken between crossed polarizing filters. The smallest-scale sub-division is 1 mm.
To extract the nearest-neighbor angles, we made a table of all pairs of measured grains that were observed to be touching on each photograph (≈250 pairs on each; Table 1). We then calculated the acute angle, ![]() , between the c axes of each pair of grains (m, n) observed in contact.
, between the c axes of each pair of grains (m, n) observed in contact.
These ![]() should not be compared directly between sections, however, because the sections may have different fabrics. For example, a section in which all of the c axes plot in a cone with half-angle of 20 will have
should not be compared directly between sections, however, because the sections may have different fabrics. For example, a section in which all of the c axes plot in a cone with half-angle of 20 will have ![]() , whereas a section in which the c axes are randomly distributed may exhibit angles up to 90 °. Reference Azuma and HigashiAzuma and Higashi (1985) showed that deformation of an existing population of grains changes the c-axis fabric and that at Dye 3, Greenland, increasing cumulative deformation with increasing depth causes the c axes to cluster toward the vertical. This would cause an increase with depth in the number of nearest-neighbor grains having c axes pointing in similar directions. The Byrd Station fabrics clearly show a similar trend of c-axis clustering toward the vertical with increasing depth (Reference Gow and WilliamsonGow and Williamson, 1976). In our subset of the Byrd data the clustering is only slightly larger than the sampling noise and natural variability, but careful examination shows that our deeper samples do have more c-axis clustering toward the vertical than our shallower samples (Fig. 5a). However, even if only random fluctuations in fabric strength occurred between sections, they could affect the
, whereas a section in which the c axes are randomly distributed may exhibit angles up to 90 °. Reference Azuma and HigashiAzuma and Higashi (1985) showed that deformation of an existing population of grains changes the c-axis fabric and that at Dye 3, Greenland, increasing cumulative deformation with increasing depth causes the c axes to cluster toward the vertical. This would cause an increase with depth in the number of nearest-neighbor grains having c axes pointing in similar directions. The Byrd Station fabrics clearly show a similar trend of c-axis clustering toward the vertical with increasing depth (Reference Gow and WilliamsonGow and Williamson, 1976). In our subset of the Byrd data the clustering is only slightly larger than the sampling noise and natural variability, but careful examination shows that our deeper samples do have more c-axis clustering toward the vertical than our shallower samples (Fig. 5a). However, even if only random fluctuations in fabric strength occurred between sections, they could affect the ![]() .
.

Fig. 5. Weights of observed misorientations between c axes of adjacent grains in sections from the Byrd Station core. The increase with depth in weights at small misorientation angles indicates that polygonization is active, a. The boundaries of the ten bins are shown by the nearly vertical dotted lines. The deviations of these lines from vertical are caused by fabric changes between sections, and the general tendency of them to slant towards the lower left of the figure indicates that c axes of grains on a section become more nearly parallel with increasing depth, b. A perspective view of the same data as in (a).
To normalize for fabric variation, on each section we compared the ![]() to the angles
to the angles ![]() that would occur if the grains were positioned randomly on the section, and we interpreted the changes with depth in the difference between the
that would occur if the grains were positioned randomly on the section, and we interpreted the changes with depth in the difference between the ![]() and
and ![]() patterns. To randomize the grain positions on a thin section, we used a random-number generator to select two grains for which c-axis orientations were measured, and we calculated the angle
patterns. To randomize the grain positions on a thin section, we used a random-number generator to select two grains for which c-axis orientations were measured, and we calculated the angle ![]() , between their c axes. We then repeated this for another pair of grains, and another, for a total of 10 000 pairs (which obviously sampled some pairs multiple times).
, between their c axes. We then repeated this for another pair of grains, and another, for a total of 10 000 pairs (which obviously sampled some pairs multiple times).
For case of computation, we rank-ordered these ![]() into ten bins, each containing 10% of the
into ten bins, each containing 10% of the ![]() , and recorded the angles
, and recorded the angles ![]() delineating the bins. We then took the
delineating the bins. We then took the ![]() and compared them to the expectation for a random distribution by calculating the weights,
and compared them to the expectation for a random distribution by calculating the weights, ![]() . Here, o
i is the number of
. Here, o
i is the number of ![]() falling in the range
falling in the range ![]() and e
i, is the number expected, which is 10% of the total number of pairs measured.
and e
i, is the number expected, which is 10% of the total number of pairs measured.
The orientation of an individual c axis probably can be measured with errors a little smaller than 5 ° (Reference LangwayLangway, 1958). We chose to use ten bins rather than more so that the bins would be wider than the uncertainty introduced by this measurement error, and so each bin would contain enough pairs of grains to keep random variations small.
Figure 4 shows, diagramatically, the expected distributions of weights with increasing depth in the ice sheet for the three models considered: boundary pinning, polygonization and recrystallization. This can be compared to the data listed in Table 2, and plotted in Figure 5, where for each of the ten bins we have plotted the weight wi
. Weight ![]() indicates a shortage of pairs of grains with the ith range of angles between their c axes: weight
indicates a shortage of pairs of grains with the ith range of angles between their c axes: weight ![]() indicates an excess of pairs of grains in that range. The bin widths change between adjacent sections because of changes in the fabric strength (seen most clearly in the widening with increasing depth of the tenth, highest-angle bin in Figure 5a), but each bin would always contain 10% of the
indicates an excess of pairs of grains in that range. The bin widths change between adjacent sections because of changes in the fabric strength (seen most clearly in the widening with increasing depth of the tenth, highest-angle bin in Figure 5a), but each bin would always contain 10% of the ![]() if the locations of the grains in the section were random. Inspection of Figure 5 shows that there is progressive increase with increasing depth in nearest-neighbor grains having similar c-axis orientations, as expected for polygonization.
if the locations of the grains in the section were random. Inspection of Figure 5 shows that there is progressive increase with increasing depth in nearest-neighbor grains having similar c-axis orientations, as expected for polygonization.

Fig. 4. Diagram of trends in misorientation-angle weights expected with increasing depth for boundary-pinning, recrystallization and polygonization models along with smoothed version of observed grain-size trend.
Table 2. Weight table. For each thin section, the weight wi the number of grains in the bin divided by the number expected, is listed for each bin. Bin No. 1 contains small ![]() (c axes of neighboring grains pointing in similar directions) and bin No. 10 contains large
(c axes of neighboring grains pointing in similar directions) and bin No. 10 contains large ![]() (c axes of neighboring grains pointing in very different directions). The polygonization hypothesis predicts large weights in bin No. 1 for the three deepest sections (bins marked off by the box); the recrystallization hypothesis predicts large weights in the higher-numbered bins for those sections; and the boundary-pinning hypothesis predicts uniform weights in all bins in all sections. The three highest observed weights occur in the three bins predicted by the polygonization hypothesis, a statistically unlikely event unless polygonization is active
(c axes of neighboring grains pointing in very different directions). The polygonization hypothesis predicts large weights in bin No. 1 for the three deepest sections (bins marked off by the box); the recrystallization hypothesis predicts large weights in the higher-numbered bins for those sections; and the boundary-pinning hypothesis predicts uniform weights in all bins in all sections. The three highest observed weights occur in the three bins predicted by the polygonization hypothesis, a statistically unlikely event unless polygonization is active

To verify this hypothesis, we made a binomial test of whether the number of ![]() plotting in the first, smallest-angle bin was significantly larger than the 10% expected for a random distribution. The two shallowest sections are not significantly different from random distributions, but the three deepest sections base significantly more
plotting in the first, smallest-angle bin was significantly larger than the 10% expected for a random distribution. The two shallowest sections are not significantly different from random distributions, but the three deepest sections base significantly more ![]() with similar orientations than expected for a random distribution, with 97% confidence at 470 m and 99% confidence at 638 and 870 m. Of the 50 bins considered (ten bins at each of five depths), these three bins have the three highest weights. We can expect to obtain exactly three bins out of 50 in excess of the 97% confidence level in about 13% of tests, and three or more such bins in 19% of tests. However, to have chance processes cause the three highest weights to occur exactly in the three bins out of 50 expected based on the polygonization hypothesis would be exceedingly unlikely, occurring in only 0.005% of those tests in which three such high weights were present. We can have high confidence that the observed pattern results from a physical process rather than a random fluctuation.
with similar orientations than expected for a random distribution, with 97% confidence at 470 m and 99% confidence at 638 and 870 m. Of the 50 bins considered (ten bins at each of five depths), these three bins have the three highest weights. We can expect to obtain exactly three bins out of 50 in excess of the 97% confidence level in about 13% of tests, and three or more such bins in 19% of tests. However, to have chance processes cause the three highest weights to occur exactly in the three bins out of 50 expected based on the polygonization hypothesis would be exceedingly unlikely, occurring in only 0.005% of those tests in which three such high weights were present. We can have high confidence that the observed pattern results from a physical process rather than a random fluctuation.
Discussion and Conclusions
The observed trend in c-axis misorientations with increasing depth matches that predicted if initially randomly located grains are subdivided by polygonization below 400 m. We thus find support for the hypothesis that the average grain-size ceases to increase with increasing depth below 400 m at Byrd Station because polygonization below that depth divides grains at the same rate that boundary migration consumes them, not because of recrystallization or boundary pinning. If recrystallization, boundary pinning, or other processes are active, they are not rapid enough to emerge from the statistical noise of the technique.
We believe that the techniques outlined here can be used to learn much about ice deformation — some active processes should affect nearest-neighbor relations more strongly than they affect bulk c-axis fabrics. We arc applying these techniques to the study of folding and other processes in the GISP2 deep core from central Greenland.
If we are to make significant progress in understanding the processes active during ice deformation, it would help to have c-axis maps from a variety of naturally deformed and laboratory-deformed samples. Measurements of re-crystallized ice with girdle fabrics would be especially valuable, so that we could verify the expectation based on theory and metallurgical observations (e.g. Reference PoirierPoirier, 1985) that recrystallization causes c axes of nearest-neighbor grains to form at high angles. We encourage other investigators to make the small additional effort needed to map their c axes during Rigsby-stage fabrie measurements and to contribute to the community data base needed to understand ice deformation.
Acknowledgements
We thank the U.S. National Science Foundation Division of Polar Programs for partial support; R. B. A. also thanks the David and Lucile Packard Foundation for partial support. We thank C. Alley and the Deasy Geographies Laboratory for figure preparation, and S. Anandakrishnan and C. Shuman for helpful suggestions.


