


1. Introduction
Ice aprons, also known as ice faces (Gruber and Haeberli, Reference Gruber and Haeberli2007; Hasler and others, Reference Hasler, Gruber and Haeberli2011), are scarce accumulations of massive ice found in glacierized basins, above the equilibrium line (Armstrong and Roberts, Reference Armstrong and Roberts1956; Bhutiyani, Reference Bhutiyani, Singh, Singh and Haritashya2011; Cogley and others, Reference Cogley2011; Guillet and Ravanel, Reference Guillet and Ravanel2020). Such a definition typically encompasses ice masses from different settings like isolated massive ice patches on rock walls (e.g. north face of Mount Alberta, Canadian Rocky Mountains) or any steep ice body lying over a glacial bergschrund, defined by Cogley and others (Reference Cogley2011) as ‘a crevasse at the head of a glacier that separates flowing ice from stagnant ice, or from a rock headwall’ (e.g. the Triangle du Tacul ice apron, Mont-Blanc massif, cf. Section 2.1, see Guillet and Ravanel (Reference Guillet and Ravanel2020) for more details).
Unlike other cryospheric objects, most notably large valley and cirque glaciers, ice aprons received little attention from the scientific community until now. Due to their small spatial extent (typically ranging between 0.01 and 0.1 km2) compared to other glaciers, ice aprons are not expected to have a significant impact on water resource availability. However, in populated mountainous regions relying heavily on the high mountain environment for recreation and tourism like the Chamonix valley (Barker, Reference Barker1982; Hall and Higham, Reference Hall and Higham2005), the shrinkage of ice aprons raises concerns. Glacial recession and thermal destabilization of the permafrost have been identified as important factors for the recent increase in high mountain rock wall instabilities (Huggel and others, Reference Huggel, Clague and Korup2012; Ravanel and others, Reference Ravanel, Deline, Lambiel and Vincent2013; Deline and others, Reference Deline, Haeberli and Whiteman2021). Ice aprons, covering steep rock walls, protect the underlying permafrost from thawing. Reduction in their surface area or complete disappearance would thus accelerate the ongoing destabilization of rock walls (Gruber and Haeberli, Reference Gruber and Haeberli2007; Kenner and others, Reference Kenner2011; Guillet and Ravanel, Reference Guillet and Ravanel2020). In addition, in the Mont-Blanc massif (MBM; France), ice aprons are often mandatory passing points for most classical mountaineering routes, existing since the beginning of alpinism in Europe in the 18th century (Mourey and others, Reference Mourey, Marcuzzi, Ravanel and Pallandre2019). The disintegration of ice aprons would therefore also lead to an important loss in European alpine culture heritage.
In a companion paper, focused on the surface area variations of ice aprons in the MBM, Guillet and Ravanel (Reference Guillet and Ravanel2020) showed that ice aprons have been losing mass since the end of the Little Ice Age (LIA), with accelerated shrinkage since the 1990s. Building on previous studies focusing on ‘miniature ice caps’ and other small-sized perennial ice bodies (Haeberli and others, Reference Haeberli, Frauenfelder, Kääb and Wagner2004; Bohleber, Reference Bohleber2019), Guillet and Ravanel (Reference Guillet and Ravanel2020) hypothesized the ice composing ice aprons to be quite old, with no clear insight on the potential age range. To get a better understanding of these particular ice bodies, knowledge about flow dynamics and ice ages in deeper layers, and in particular close to bedrock, is needed. To fill this knowledge gap, texture investigation and radiometric dating, suitable for potential ice ages older than a few hundred years, are considered. Since the pioneering studies of Perutz and others (Reference Perutz, Seligman and Bragg1939), Kamb (Reference Kamb1959) and Gow and Williamson (Reference Gow and Williamson1976), texture investigations have proven to be a valuable tool in the study of the mechanics driving ice creep and glacier flow in glaciers and ice sheets (see e.g. Hudleston, Reference Hudleston, Saxena, Bhattacharji, Annersten and Stephansson1977; Alley, Reference Alley1988; Duval and others, Reference Duval, Arnaud, Brissaud, Montagnat and de la Chapelle2000; Montagnat and others, Reference Montagnat2012, Reference Montagnat2014). In the following work, texture refers to both microstructure, i.e. size and shape of the ice crystals, and to lattice-preferred orientation (LPO), i.e. the distribution of orientations of the optical axis (c-axis, < 0001 >) in the analyzed sample. The recent refinement of radiocarbon measurement techniques for microscopic organic material from glacier ice (Uglietti and others, Reference Uglietti2016; Hoffmann and others, Reference Hoffmann, Friedrich, Kromer and Fahrni2017), and its successful deployment for near-bedrock ice at high-altitude cold Alpine glaciers (Jenk and others, Reference Jenk2009; Hoffmann and others, Reference Hoffmann2018; Preunkert and others, Reference Preunkert2019a) as well as lower altitude cold-based glaciers (Bohleber and others, Reference Bohleber, Hoffmann, Kerch, Sold and Fischer2018; Bohleber, Reference Bohleber2019) make it a well-suited tool to estimate the age of ice aprons.
In this study we focus on a systematic investigation of a single ice apron in the MBM. To do so, we sampled the lower ice apron of the Triangle du Tacul north face (further denoted as TDT, 3970 m a.s.l.). This specific sampling site was selected since the climb to this ice apron (i.e. the only possibility to access such steep ice spots) is neither very long nor particularly exposed to objective hazards. Also, previous on-site drilling showed that the ice apron was only ~1 m thick at the drill site, allowing the extraction of a complete surface-to-bedrock cross section of the ice apron using a portable drill device. In April 2018 and 2019 three ice cores were drilled down to the bedrock and used to investigate the ice texture. Without prior knowledge on the possible age of the ice apron, radiometric dating was used as a first approach.
2. Sampling site and methods
2.1. Sampling site
The ice cores presented in this study originate from the north face of the TDT in the MBM, France (see Figs 1 and 2).

Fig. 1. (a) Localization map of the Chamonix valley and the study site. (b) The TDT (peak at 3970 m a.s.l.), its north face and the ice core drilling site at 3650 m a.s.l.
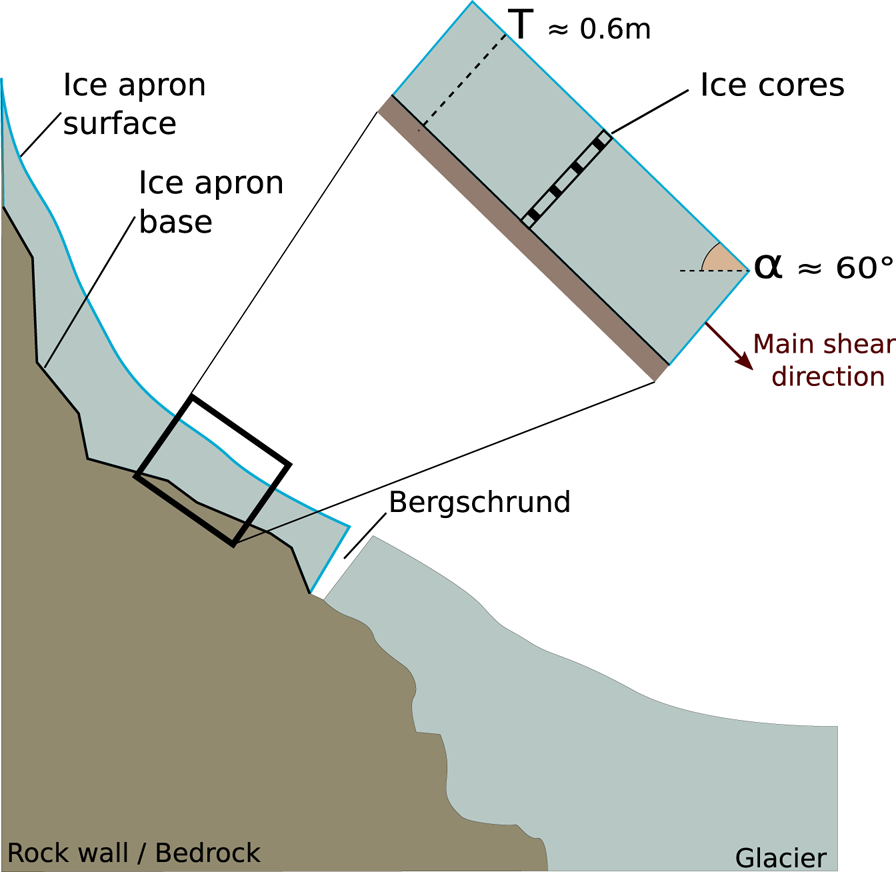
Fig. 2. Schematic representation and geometry of the TDT ice apron.
The mountain face has two distinct ice aprons; only the lower one was sampled. Lying between 3570 and 3690 m a.s.l., it extends over 4000 m2 and has a mean slope of 59 ± 2° from horizontal. The retreat of the TDT ice apron since the 1940s has been quantified by Guillet and Ravanel (Reference Guillet and Ravanel2020). The ice apron has lost close to 20% of its 1940s surface area, with a noticeable increase in the mean melt rate since the 1990s (− 10 ± 24 m2 a−1 for the 1940–93 period, − 46 ± 6 m2 a−1 since). Guillet and Ravanel (Reference Guillet and Ravanel2020) did not note the presence of macroscopic flow features (crevasses or fractures) at the surface of the TDT.
Several drilling campaigns were carried out at the sampling site (close to 3640 m a.s.l.). In March 2017 the ice apron was steam-drilled to bedrock and the 0.6 m-deep borehole, traversing close to 20 cm of seasonal accumulation (fresh snow) and 80 cm of massive ice, was set up for thermal monitoring. The borehole is located close to 3640 m a.s.l. (see Fig. 1). The mean temperature at the ice/rock interface has been measured continuously from March 2017 to April 2019 with an hourly sampling rate. With an annual mean temperature of − 7.6 ± 4.5°C and all hourly measurements below the melting point, we conclude that the ice apron is still cold and frozen to bedrock. These measurements signal that the underlying bedrock stands under conditions of cold permafrost, and are consistent with the results of previous studies modeling permafrost distribution (Magnin and others, Reference Magnin, Deline, Ravanel, Noetzli and Pogliotti2015). Furthermore, on-site observations reported no evidence of fractures at the surface of the ice apron, suggesting that circulation of meltwater to the base of the apron is unlikely. In April 2018 and 2019, three 0.6 m-long ice cores (denoted as A, B and C) with a diameter of 5.5 cm were drilled to bedrock within 1 m distance from the 2017 borehole, using a portable drilling system (see Fig. 3) developed by Petzl and the Institut des Géosciences de l'Environnement, for drilling in technical terrain (Montagnat and others, Reference Montagnat2010). All three ice cores reached bedrock after 60 cm. Ice thickness measurements made at the 2017 borehole showed that the ice apron lost ~20 cm of thickness between March 2017 and April 2019 at the sampling location. All ice cores were kept at temperatures below − 7°C in refrigerated containers before being stored at − 25°C in freezers, 4–5 h after their extraction.

Fig. 3. Coring in the north face of TDT. Core A was drilled where the photographer stands.
2.2. Analytical methods
2.2.1. Texture and LPO
From core B, we produced thin sections covering the entire thickness of the ice apron, in order to study potential changes in the ice texture with depth. Thin sections were made following standard experimental protocols for texture analysis, using bandsaws and a microtome to cut and polish the samples (Schwarz and others, Reference Schwarz1981; Durand and others, Reference Durand2006). Typical thin sections are 9–10 cm long, 4–5 cm wide and 0.4–0.5 mm thick. From the thin sections, LPOs were measured using an automatic ice-texture analyzer (AITA, Russell-Head and Wilson Reference Russell-Head and Wilson2001). The AITA provides c-axis orientations over the thin section surface, at a spatial resolution of 20 μm (for this study), together with a quality criterion, enabling the removal of high-uncertainty sample areas, such as grain boundaries (see Peternell and others (Reference Peternell, Russell-Head and Wilson2011) for more details).
2.2.2. Particulate organic carbon (POC) content and radiocarbon dating
In the present study, we used a preparation protocol developed by Hoffmann and others (Reference Hoffmann2018) for radiocarbon analysis of POC. This protocol has previously been successfully applied to investigate the age of near-basal ice from cold, high-altitude Alpine glaciers (Hoffmann and others, Reference Hoffmann2018; Preunkert and others, Reference Preunkert2019a, Reference Preunkert2019b).
Without prior knowledge about the age of ice and the total POC content at the sampling site, we only sampled the deeper layers of cores A and C (core B was used for microstructure investigations, see Section 2.2.1), thus excluding potential bias from near-surface artifacts (Figure 4).
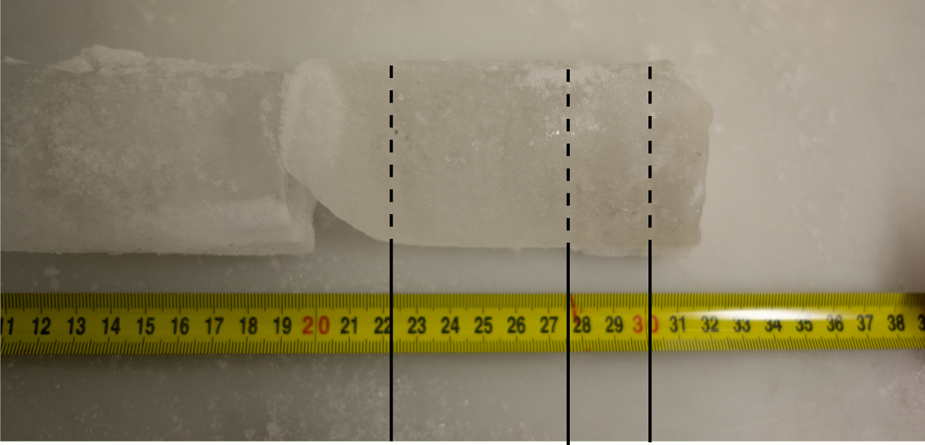
Fig. 4. Lowest part of core A. 12 and 32 cm on the measurement tape correspond to 20 cm above bedrock and the core end, respectively. Note the increase in impurity content between the 22, 27.5 and 30 cm marks (dashed lines).
Ice decontamination, melting, filtration, acidification and separation of the bulk organic carbon fraction from the total filtered insoluble carbonaceous particles by combustion at 340°C was done following the approach of Preunkert and others (Reference Preunkert2019a), using the in-line filtration–oxidation unit REFILOX (Reinigungs-Filtrations-Oxidationssystem (Hoffmann and others, Reference Hoffmann2018) with mean mass-related combustion efficiency of 0.7 (Hoffmann and others, Reference Hoffmann2018).
Due to the inevitable tradeoff between the necessary minimum sample mass needed to obtain a sufficient amount of POC (> 2 μg C with error of 3–7% and > 10 μg C with error <2%) (Hoffmann and others, Reference Hoffmann2018), and the length (i.e. the time interval covered by each sample), ice cores were cut into 9–20 cm long samples, after removing the outer parts. This resulted in three ice samples with masses of 130–350 g; further reduced to 63–220 g after decontamination by rinsing with ultra-pure water.
After cryogenic extraction of the CO2 produced from POC combustion, radiocarbon analyses were performed at the accelerator mass spectrometer (AMS) facility at the Curt-Engelhorn-Centre Archaeometry (CEZA, Mannheim, Germany), equipped with a Gas Interface System (GIS, Hoffmann and others Reference Hoffmann, Friedrich, Kromer and Fahrni2017).
AMS measured F14C (fraction modern carbon, see Stenström and others (Reference Stenström, Skog, Georgiadou, Genberg and Mellström2011); Taylor (Reference Taylor and Taylor1987); Donahue and others (Reference Donahue, Linick and Jull1990) for more details) values were corrected for blank contribution. Hereby, we accounted (1) for the mean F14C blank of the sample set (0.715 ± 0.07) obtained from regularly sampled ultra-pure water blanks (n = 4) for which four filters were respectively pooled, due to the very low carbon content in the blanks, (2) the carbon mass of the ultra-pure water blank determined directly before each sample extraction, ranging from 0.1 to 0.27 μg C (see Preunkert and others (Reference Preunkert2019a) for further details on the sample preparation procedure).
Calibrated 14C ages were finally obtained using the IntCal13 atmospheric curve (Reimer and others, Reference Reimer2013) OxCal version 4.3 (Bronk Ramsey, Reference Bronk Ramsey1995, Reference Bronk Ramsey2009). Calibrated 14C ages are rounded according to Millard (Reference Millard2014).
3. Results and discussion
3.1. Texture and stress state in the TDT ice apron
Microstructure and c-axis orientation pole figures (stereographic projections) from seven different depths covering the entire ice core are presented in Figure 5. Although the mean estimated grain size is ~1 cm, strong grain size differences can be observed (Fig. 5) within the sections, with some grains being several centimeters wide. We identify irregularly shaped grains, as well as grain boundary bulging and pinning by air bubbles throughout the ice samples (Fig. 6). It should be noted that, owing to the serrated shape of some grains, and the 2-D observation, small grains are the likely result of a protrusion sectioning. The characteristics of the observed microstructures (i.e. large spread in grain sizes, and a 3-D serrated grain boundaries) prevent from providing statistically representative grain size data. Nevertheless, we observe smaller grains the closer the sample is to the bedrock. This type of microstructure is typical of what is expected during deformation at high temperature when dynamic recrystallization is the main accommodating mechanism (Jacka and Maccagnan, Reference Jacka and Maccagnan1984; Treverrow and others, Reference Treverrow, Budd, Jacka and Warner2012). Indeed, dynamic recrystallization is known to induce elongated grains with serrated grain boundaries, owing to strain-induced grain boundary migration driven by the heterogeneously spread stored deformation energy. Dynamic recrystallization also produces bi-modal type of grain size distributions, owing to the small grains resulting from nucleation mechanisms (Montagnat and others, Reference Montagnat, Durand and Duval2009).

Fig. 5. AITA analyses of thin section for every sample of core B. Color-coded c-axis orientation is represented by the color wheel, along with the supposed shear plane. Pole figures (equal area) show the distribution of c-axis orientations as well as the core axis (CA). Color scale represents the relative number of pixels plotted. Indicated lengths correspond to depth interval of each sample.

Fig. 6. Close-up of thin section 4 of the TDT ice core. The black arrow indicates a bulging grain boundary while the white arrow highlights grain boundary pinning by an air bubble.
LPO, evaluated here with the orientations of the c-axes, is represented by means of pole figures (Fig. 5). On all pole figures, we observe c-axes preferentially clustered around a direction parallel to the core axis. Apart from the dominant contribution of grains with c-axes parallel to the core axis, several tilted grains (green colors in Fig. 5) can be observed throughout the ice core, with more occurrences when getting closer to the bedrock. The LPOs observed along this core are very similar to LPOs documented in some glacier configurations (Hudleston, Reference Hudleston, Saxena, Bhattacharji, Annersten and Stephansson1977, Reference Hudleston2015) or as a result of laboratory experiments (Bouchez and Duval, Reference Bouchez and Duval1982; Journaux and others, Reference Journaux2019) and are attributed to the deformation of ice under simple shear associated with the occurrence of dynamic recrystallization as a relaxation mechanism. Typical LPO patterns for ice deformed in simple shear and dynamically recrystallized are composed of two maxima, evolving to a single maximum with increasing strain, oriented normal to the shear plane (Hudleston, Reference Hudleston, Saxena, Bhattacharji, Annersten and Stephansson1977; Journaux and others, Reference Journaux2019). The single maximum LPO observed in the TDT ice therefore likely reveals a dominant shear regime, with a shear plane parallel to the surface slope of the ice apron. The inclined (relatively to the core axis) sub-maximum of the observed LPOs in the deeper samples could indicate a lower amount of shear and/or a reduced impact of dynamic recrystallization in the ice located closer to the bedrock. It would be coherent with the fact that the larger grains are observed when getting closer to the surface (samples B3 and B2). Hampering of grain boundary migration related to dynamic recrystallization could be due to pinning by either bubbles or impurities (see Fig. 6), which concentrations have not been evaluated here. From the intensity of the observed LPO, and by comparison with the previous studies mentioned above, we typically estimate the total cumulated shear strain γ to be, at minimum, in the range of 0.5 ≤ γ ≤ 0.8.
3.2. POC content and radiocarbon dating
By combustion of the filtered carbonaceous aerosols at 340°C, the fraction derived and denoted as organic carbon (OC) is – prior to the time of anthropogenic fossil fuel combustion – originating mainly from direct primary emission of the living biosphere and is therefore well suited for 14C dating (Jenk and others, Reference Jenk2006, Reference Jenk2009; Uglietti and others, Reference Uglietti2016; Hoffmann and others, Reference Hoffmann2018). Although at higher combustion temperatures age biasing is likely to occur due to additional combustion of already aged organic material and remaining carbonates in mineral-dust-rich layers (Jenk and others, Reference Jenk2006), Uglietti and others (Reference Uglietti2016) achieved to validate the accuracy of 14C dating using the water-insoluble OC fraction combusted at 340°C (here denoted as POC) of carbonaceous particles in ice by a direct comparison of the POC-14C derived ages with the ages determined independently by other methods (e.g. counting of annual layers) in the same samples of ice.
The resulting POC masses and FC values of the TDT samples after blank correction are given in Table 1. Final POC masses were 13.2 to 33.0 μg C, leading to POC concentrations of 330 ± 140 ng C g−1. These values are nearly 15 times higher than values found in the lowest meters of the neighboring Col du Dome glacier (hereafter denoted CDD), located 5 km southwest of the TDT ice apron, at an altitude of 4250 m a.s.l. (Preunkert and others, Reference Preunkert2019b).
Table 1. Overview of masses (corrected for blanks but not for combustion efficiency) and 14C ages of the TDT ice core samples combusted in the REFILOX system

Calibrated date ranges are shown at 68.2% probability and rounded according to Millard (Reference Millard2014). a Years before 1950.
The study of atmospheric free cellulose (a proxy for plant debris) in Europe by Sánchez-Ochoa and others (Reference Sánchez-Ochoa2007), between the altitudes of 0 and 3000 m a.s.l., showed that the annual decrease in mean airborne plant debris with elevation is similar to that observed for ${\rm SO_4^{2-}}$ during summer. Extrapolating these results via the vertical gradient of atmospheric ${\rm SO_4^{2-}}$
 during summer (Preunkert and others, Reference Preunkert, Legrand and Wagenbach2001) to the TDT ice apron and the nearby CDD (i.e. altitudes of 3640 and 4250 m a.s.l.), we expect a difference of a factor 4, which is not enough to explain the apparent difference between the TDT and CDD POC concentrations. To get further information about the origin of the high POC concentration found in the TDT ice, we analyzed major ions from two ice samples (C01 and C02) representing ice from 10–30 cm above bedrock (core C) using ion chromatography (IC; see Preunkert and Legrand (Reference Preunkert and Legrand2013) for analytical details). The mean of these two samples was compared to CDD yearly (summer and winter) ice layers dated to originate from the beginning of the 20th century, thus largely free of anthropogenic input (Preunkert and Legrand, Reference Preunkert and Legrand2013). Although the TDT core samples represent just a small portion of the ice apron, their overall ionic composition is likely to provide additional insights. As expected, major inorganic airborne impurities (e.g. ${\rm SO_4^{2-}}$
 , ${\rm NO_3^{-}}$
 ), and non-local (e.g. non-ammonium oxalate components, see below) ${\rm NH_4^{ + }}$
 , show TDT to CDD concentration ratios between 1.5 and 5, whereas crustal influenced species (e.g. Cl−, Na+, Ca2+, Mg2+, K+) result in ratios between 20 and 36, demonstrating the influence of the nearby bedrock. In addition to the inorganic composition, the C2 di-carboxylate (oxalate) was analyzed in the two samples and found to be abundant in the TDT ice, with an enhancement of a factor ≈55 compared to the CDD ice of the beginning of the 20th century. Being present most likely as ammonium oxalate this suggests, as demonstrated for the basal layers of the Greenland GRIP ice core (Tison and others, Reference Tison1998), the existence of considerable deglaciated areas with significant plant cover and efficient biological activities in the vicinity of the formation-site of the ice leaving a footprint during the formation of the ice apron.
Ice ages obtained in cores A and C suggest that the ice at depths between ≈30 and 50 cm (30–10 cm above bedrock) formed 630–3100 years ago, whereby the two samples from core C indicate an age increase with depth (Table 1).
Considering the small size and steep bedrock slope of the ice apron, a strong increase of ~2000 years over such a short interval of 10 cm (core C) might surprise. However the order of magnitude of the age–depth gradient, as well as the absolute ice age 10 cm above bedrock (i.e. ≈3000 years) are comparable to those already detected for basal ice in high-altitude cold Alpine glaciers. Basal ice ages were found to be ≈4000 cal years BP (gradient of ≈40 a cm−1) (Hoffmann and others, Reference Hoffmann2018) and >10 000 cal years BP (gradient of ≈120 a cm−1) (Jenk and others, Reference Jenk2009) for two different ice cores drilled at the high-altitude cold glacier site of Colle Gnifetti (4450 m a.s.l., Monte Rosa region, Switzerland), whereas ice dating ≈7000 cal years BP (gradient of ≈70 a cm−1) was found for Mount Ortles (3905 m a.s.l., Eastern Alps) (Gabrielli and others, Reference Gabrielli2016) and for the base of the Piz Murtèl (3433 m a.s.l., Grisons, Swiss Alps) miniature ice cap (Bohleber, Reference Bohleber2019). Very recently, near-bedrock ice from an ice core drilled at the CDD was estimated to be ≈ 5600 ± 600 year BP (gradient of ≈60 a m−1) (Preunkert and others, Reference Preunkert2019b)). In addition, the occurrence of such old ice is not confined to altitudes $\gtrsim$ 4000 m a.s.l. Bohleber and others (Reference Bohleber, Hoffmann, Kerch, Sold and Fischer2018) showed that the lowermost ice layers of the Chli Titlis cold-based glacier (3030 m a.s.l., Central Switzerland) are up to ≈ 5000 years old.
A common feature of the depth–age relationship at the above-mentioned sites and more generally under undisturbed and stable glacier flow conditions, is that the ice becomes older with increasing depth. In addition, due to glaciological flow characteristics both predicted in models (Nye, Reference Nye1963; Haeberli and others, Reference Haeberli, Frauenfelder, Kääb and Wagner2004, among others) and documented by direct measurements (Uglietti and others, Reference Uglietti2016), the age gradient with depth becomes strongly enhanced near bedrock. The two stacked samples in core C suggest that the TDT ice also becomes older with depth. Assuming an absence of basal melting during the past (see Section 2.1), and considering a largely regular shear deformation parallel to bedrock as suggested from ice texture investigations (see Section 3.1), we hypothesize the deepest part of the ice is older than the ice age estimated at a depth of 41 ± 11 cm, i.e. older than 3000 years.
3.3. Formation and evolution of the TDT ice apron
Our results showed that the ice composing the TDT ice apron mainly deforms under a low-strain rate simple shear stationary regime and that deformation is rather homogeneous along the axis of the core. Radiocarbon dating results further highlighted an increase in the age of the ice from the surface to the base of the apron, associated with an enhanced age–depth gradient in the lowermost layers (≈2000 a 10 cm−1, see Table 1). From our results, it is however not possible to decipher potential past variations of the ice apron's stress field. Still, further hypotheses can be proposed to explain the formation and evolution of the TDT ice apron.
In most of the cold high-altitude glaciers mentioned in the previous section, the enhanced age–depth gradient in the lowermost layers is a consequence of annual layer thinning. Such thinning results from the strong shear and high strain-rate above the bedrock in cold glaciers frozen to the bed (Uglietti and others, Reference Uglietti2016). Although thinning likely also occurs in the ice layers of the TDT apron, we do not believe it to be the main contributor to the observed depth-age gradient. Guillet and Ravanel (Reference Guillet and Ravanel2020) indeed demonstrated that the main mass balance drivers for ice aprons are climate and the local topography, as only snowfall between − 5 and 0°C can accumulate on such steep slopes (Kuroiwa and others, Reference Kuroiwa, Mizuno and Takeuchi1967; Guillet and Ravanel, Reference Guillet and Ravanel2020). Furthermore, bergschrunds at the foot of ice aprons (see Fig. 1) are widely recognized as separating two different regimes of ice dynamics: (1) the stagnant ice apron (above the bergschrund) and (2) the main flowing glacier (below the bergschrund) (Mair, Reference Mair and Kuhn1994; Cogley and others, Reference Cogley2011). Building on these considerations and the current study, we hypothesize that the TDT ice apron formed by accumulation and densification of snow into ice and has always been detached from the glacier beneath. We thus believe that the observed variations in the age–depth gradient are more likely to reflect modifications in accumulation rate (and by proxy climate) (Guillet and Ravanel, Reference Guillet and Ravanel2020) rather than layer thinning, and to lead to discontinuous depth age profile.
4. Conclusions
In this paper, we presented texture analysis and micro-radiocarbon dating of cores collected on the TDT ice apron. The study of the microstructure and LPO of the ice provided insight into the dynamic behavior of such objects. Similar single maximum LPOs throughout the core indicate simple shear deformation associated with dynamic recrystallization. The transition in LPO and grain size observed closer to the bedrock could likely be the consequence of a lower amount of cumulated shear strain, together with differences in concentrations of impurities and/or air bubbles, trapped while the ice formed. Dynamic recrystallization is the most probable driver for grain growth, producing irregularly shaped grains. Grain-boundary pinning seems to be mainly caused by air bubbles and impurities. Overall similar LPO throughout the ice core signals the lack of recent mass gain by snow accumulation or meltwater refreeze. Micro-radiocarbon measurements indicate that the TDT ice becomes older with increasing depth. We observed ice ages older than 600 year BP and greater than 3000 years in the lowest 30 cm.
The combination of ice dating back to several thousand years with the absence of meltwater influence, makes this kind of small ice body potentially useful as archive for reconstructing the environmental history of Europe. Ice aprons offer the distinct advantage of direct access to a millennial chronology compacted on a few meters of ice, accessible from the surface. However, such records are likely discontinuous and may not allow for trivial reconstruction of climate history. The potential to serve as an environmental archive still needs to be further demonstrated. Further investigations, preferentially on an ice apron with higher accumulation rates than the TDT to avoid bedrock influence, are therefore needed.
Acknowledgements
This study is part of the ANR 14-CE03-0006 VIP Mont Blanc and the EU ALCOTRA AdaPT Mont Blanc project. We thank Michel Legrand and Owen King for their help and constructive comments during the writing of the manuscript. We thank the Editor as well as W. Haeberli and two anonymous reviewers for their very valuable comments which helped to improve the manuscript significantly.


 Open access