Introduction
Reports of mountain glacier recession in response to sustained climatic warming are widespread, with some of the most extensive areas of stagnant, downwasting ice being observed in parts of the eastern Himalaya (Reference Bolch, Buchroithner, Pieczonka and KunertBolch and others, 2008; Reference Quincey, Luckman and BennQuincey and others, 2009). However, patterns of climate warming are not uniform, and the western Himalaya appears to be a region not conforming to the global trend (Reference Yadav, Park, Singh and DubeyYadav and others, 2004). Indeed, climate data for the period 1961–2000 show a reduction in mean and minimum summer temperatures (Reference Fowler and ArcherFowler and Archer, 2006), and an increase in winter mean and maximum temperature coincident with an increase in winter snowfall (Reference Archer and FowlerArcher and Fowler, 2004). Oxygen isotope data derived from tree-rings, largely indicative of winter precipitation, also suggest that the 20th century was the wettest period in the mountains of northern Pakistan of the past 1000 years (Reference TreydteTreydte and others, 2006). Consequently, some Karakoram glaciers have been observed to be thickening and advancing (Reference HewittHewitt, 2005).
The Karakoram is home to several of the highest mountains in the world, including K2. Extreme topography such as this enables the formation of large, dynamic glaciers (Reference KerrKerr, 1993); indeed four of the longest Asian glaciers (Biafo, Siachen, Sarpo Laggo and Baltoro) descend from the K2 and Gasherbrum groups (Reference Mayer, Lambrecht, Belò, Smiraglia and DiolaiutiMayer and others, 2006). The longterm dynamics (mass balance, horizontal and vertical fluctuations, ice flow) of these glaciers reflects regional climatic conditions (Reference Dyurgerov and MeierDyurgerov and Meier, 2000), although the short-term relationships are unclear due to the paucity of climate station data, particularly at high elevations (Reference Fowler and ArcherFowler and Archer, 2006). Modelled climate data therefore provide the only realistic means of estimating past precipitation and temperature data for the Karakoram, and are particularly appropriate for use on a regional scale (Reference UppalaUppala and others, 2005).
The short-term dynamic response of Karakoram glaciers is often inhibited by their thick surface-debris cover, which has an insulating effect on ablation (Reference Benn and LehmkuhlBenn and Lehmkuhl, 2000). However, rapid changes in flow characteristics, in particular glacier surges, have been widely noted in the region (Reference HewittHewitt, 1969, Reference Hewitt2005, Reference Hewitt2007). It has been shown that the flow of valley glaciers can fluctuate on seasonal and annual timescales, and that motion is often linked to variations in water supply to the subglacial drainage system (Reference WillisWillis, 1995; Reference Kavanaugh and ClarkeKavanaugh and Clarke, 2001; Reference Purdie, Brook and FullerPurdie and others, 2008). However, there is a paucity of such information for the Karakoram. Useful measurements of glacier velocity have been derived from point-based GPS data and the manual tracking of surface features across sequential imagery (Reference Mayer, Lambrecht, Belò, Smiraglia and DiolaiutiMayer and others, 2006). Automated feature tracking has also been used (Reference CoplandCopland and others, 2009), but without linkage to short- or long-term climatic variations.
Our aim is to build on this previous work and to examine the spatial and temporal variability in surface velocity exhibited by Baltoro Glacier, one of the longest non-polar glaciers in the world. Using robust cross-correlation feature-tracking algorithms (e.g. Reference Strozzi, Luckman, Murray, Wegmuller and WernerStrozzi and others, 2002), spatially comprehensive seasonal and annual velocity fields are presented from the mid- to late 1990s through to early 2008. These remote-sensing data are complemented and supported by two sets of field-based measurements from the summers of 2004 and 2005, periods of particularly interesting dynamical behaviour. Modelled climate data (European Centre for Medium-Range Weather Forecasts reanalysis, ERA-40) are presented for the period 1958–2001, showing temperature and precipitation trends on a seasonal scale. The controlling parameters on long-term glacier flow are discussed within the context of the modelled meteorological data, and the possible controls on short-term surface velocity fluctuations are explored.
Study Area and Relevant Previous Work
Baltoro Glacier
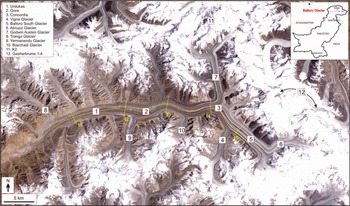
Baltoro Glacier descends from the western face of K2 (8611 m a.s.l.) via Godwin Austen Glacier, and terminates approximately 63 km down-valley at an elevation of ∼3500 m. It is fed by one other major tributary, Baltoro South Glacier, which itself descends from the Gasherbrum group of peaks (maximum elevation 8080 m) via Abruzzi Glacier (Fig. 1). A number of small debris-covered tributaries join the main glacier tongue along its northern and southern margins, some of which exhibit surge-type characteristics (Reference Diolaiuti, Pecci and SmiragliaDiolaiuti and others, 2003), although there is no evidence that Baltoro Glacier itself surges.

Fig. 1. Baltoro Glacier, with major peaks, tributary glaciers and profile locations (in yellow) highlighted.
The wider Karakoram climate is strongly influenced by troughs of low pressure in the westerly circulation (Reference Lüdecke and KuhleLüdecke and Kuhle, 1991), leading to maximum precipitation during winter and spring months (Reference Archer and FowlerArcher and Fowler, 2004), and by monsoonal incursions, which bring a small amount of additional summer precipitation. In the specific case of Baltoro Glacier, climatic variables are strongly influenced by topography: precipitation rates increase with altitude such that almost all precipitation above the equilibrium line (around 5500 m) falls as snow (Reference Mayer, Lambrecht, Belò, Smiraglia and DiolaiutiMayer and others, 2006), and on a local scale, ablation rates are influenced by slope and aspect as well as elevation (Reference Mihalcea, Mayer, Diolaiuti, Lambrecht, Smiraglia and TartariMihalcea and others, 2006).
The upper reaches of Baltoro Glacier are largely debris-free, but downstream of the equilibrium line the debris cover becomes increasingly thick and extensive. At the confluence between the Godwin Austen and Baltoro South tributaries, known as Concordia (∼4600 m a.s.l.; Fig. 2a), approximately 70% of the glacier surface is buried by a thin layer (5–15 cm) of debris. At around 4100 m (Urdukas), the debris cover is almost 100% and is 30–40 cm thick, whereas the debris is up to 1 m deep close to the glacier terminus (∼3450 m a.s.l.; Reference MihalceaMihalcea and others, 2008). Semi-permanent surface meltwater ponds punctuate the debris cover across the lower ablation area (Fig. 2b), occasionally reaching sizes of ∼100 × 100 m or more. Water discharge from the glacier occurs primarily via a single outlet at the glacier terminus, where large volumes of very heavily debris-laden subglacial water are released in the summer (Fig. 2c). According to historical data, the glacier terminus position has gently fluctuated since 1913, with a 200 m advance in the early 20th century, followed by a similar recession since 1954. Repeat photographs suggest that there has been negligible surface thickening or downwasting over this same period (Reference Mayer, Lambrecht, Belò, Smiraglia and DiolaiutiMayer and others, 2006).

Fig. 2. Baltoro Glacier showing (a) Concordia, the confluence of Baltoro South and Godwin Austen tributaries; (b) the debris-covered tongue viewed from Urdukas base camp, ∼14 km up-glacier from the terminus (ice flow is from right to left); and (c) a view of the heavily debris-covered terminus from the proglacial outwash area.
Previous velocity measurements in the Karakoram
There have been several previous measurements of seasonal ice velocity variability in the Karakoram, predominantly focusing on the largest glaciers in this region. For example, on Batura Glacier, the Batura Glacier Investigation Group (1979) used a combination of terrestrial stereophotography and control survey to measure the surface motion across the ablation area of the glacier at a total of 129 locations in 1974/75. They found average velocities of ∼100 m a−1,with a peak of 517.5 m a−1. Velocities were higher from June to September than the mean annual rate, although typical summer increases were <20%. In contrast, the motion at the glacier terminus varied little between summer and winter.
On Biafo Glacier, Reference Hewitt, Wake, Young and DavidHewitt and others (1989) used a theodolite to measure the position of a network of nine stakes across the middle of the glacier’s ablation area in 1985/86, with summer velocities of 128–226 m a−1. Winter velocities were only recorded at two stakes, although these measurements indicated that the glacier moved about half as fast in the winter as in the summer. Reference CoplandCopland and others (2009) used satellite image feature tracking to determine velocities over the period 2006–07 at these same locations, and found that annual motion was consistent with the earlier measurements (within error limits).
Previous measurements on Baltoro Glacier
In summer 2004, a combined Italian/German expedition performed extensive measurements across the ablation zone of Baltoro Glacier, assessing the production of meltwater on debris-covered glacier tongues (Reference Mayer, Lambrecht, Belò, Smiraglia and DiolaiutiMayer and others, 2006). Ablation was measured at more than 50 stakes spread across the central part of the ablation area from 4000 m up to 5000 m. At 32 of these stakes, the surface velocity of the glacier was also determined by repeated differential global positioning system (DGPS) measurements (Reference Mayer, Lambrecht, Belò, Smiraglia and DiolaiutiMayer and others, 2006). Maximum velocities of 214 m a−1 were found close to Concordia, while typical summer velocities of ∼100 m a−1 were recorded across most of the rest of the central ablation area. In contrast, annual velocities derived from manual feature tracking showed values approximately half of the measured summer velocities. This large seasonal velocity variation was attributed to strong basal sliding, at least during the summer months.
Reference CoplandCopland and others (2009) measured annual velocities over the lowermost 13 km of Baltoro Glacier using feature tracking of 2006–07 Advanced Spaceborne Thermal Emission and Reflection Radiometer (ASTER) satellite scenes, with velocities ranging from ∼75 m a−1 near the upper part of the study region (around Urdukas; Fig. 1) to <15 m a−1 close to the glacier terminus. Transverse velocity profiles showed strong lateral shearing indicative of basal sliding at a distance of ∼12 km from the glacier terminus, but transverse profiles more indicative of internal deformation ∼5 km from the terminus. Comparison with summer DGPS measurements indicated that summer speed-ups occurred close to the upper transverse profile, but there was little evidence for summer speed-ups close to the lower transverse profile. This lack of seasonal velocity variations in the near-terminus region is similar to that described by the Batura Glacier Investigation Group (1979; see above).
Data and Methods
ERS-1 and -2 and Envisat ASAR
The European Remote-sensing Satellites have provided the glaciological community with fine-resolution radar data since the launch of ERS-1 in 1992. More recently, the launch of the advanced synthetic aperture radar (ASAR) sensor (on board the Envisat satellite) has continued the systematic collection of C-band data (wavelength 5–7 cm), giving a well-stocked archive for the Karakoram region for the previous 16 years. In the current study, six ERS-1 and -2 scenes were selected for the period 1992–2000, and eight ASAR scenes were selected for the period 2003–present. The resolutions of the raw data were approximately 7.9 m (range) × 4.0 m (azimuth), equating to 20–30 m in ground range at scene centre. Images were selected to provide pairs covering annual (single year), summer (March/April to August/September), and winter (August/September to March/April) periods (Table 1). All data were selected from the same orbit, ensuring the minimum spatial baseline and consistent imaging conditions.
Table 1. Remote-sensing data used

Cross-correlation and feature tracking (including error estimations)
Surface-displacement measurements are made using cross-correlation feature tracking and are used here as a surrogate for glacier velocity. Cross-correlation feature tracking relies on the identification of displaced features across two time-separated synthetic aperture radar (SAR) images (Reference Lucchitta, Rosanova and MullinsLucchitta and others, 1995). Image patches are defined at a size commensurate with the feature patterns to be tracked, and the search area is defined on the basis of the likely displacement over the imaged period. In the current study, the windows were sized at 30 × 150 pixels (pattern size) and 64 × 320 pixels (search area), equating to ∼600 m and 1280 m, respectively, on the ground. Sampling of the displacement field was made on a much finer grid (4 × 20 pixels, equating to ∼50 m on the ground). The relatively large window size is necessary to capture sufficient ground features in the presence of image speckle, and may result in a degree of smoothing of the displacement fields. However, the spatial resolution of the technique can be considerably higher than the window size might imply. This is because the correlation field does not identify the average displacement but finds the displacement of the dominant features within the search window (in terms of area and contrast). Thus sharp gradients in velocity (e.g. between the glacier and its lateral moraines) are not problematic.
The cross-correlation method was implemented using a transformation of the SAR images to spatial frequencies using the fast Fourier transform (Reference Strozzi, Luckman, Murray, Wegmuller and WernerStrozzi and others, 2002). Feature matches are made based on the peak of the cross-correlation results and each match is assigned a signal-to-noise ratio (SNR) calculated from the height of the correlation peak relative to the average level of correlation. Matches below a specified SNR (7.0 in the present study) are rejected. Further noise is removed from the displacement map before projection in Universal Transverse Mercator (UTM) coordinates by masking areas of shadow and radar layover.
Error in the remaining data is caused by changes in surface features over time (thereby causing small-scale errors in the matching) and image distortions introduced by the processing chain (e.g. projection from SAR to UTM coordinates). Although it is difficult to quantify the error exactly, previous studies have shown that by using well-separated image pairs (of the order of a year or more), the uncertainty in the data can be kept as low as 2–3 m a−1 (Reference Luckman, Quincey and BevanLuckman and others, 2007). It is possible to validate these estimates by collecting measured displacement data over known stable areas; in the current study, the error in the data was consistently less than ±17 m a−1 for the annually separated data, and ±11 m a−1 for the seasonal (∼4–6 months separation) data. Such errors are small compared with the magnitude of displacement recorded over the glacier surface, and well within the observed trends in the seasonal and annual comparisons.
DGPS
DGPS data were collected during the summer months of 2004 and 2005 by two separate field teams.
During the 2004 field season, stake position measurements were performed with Trimble 5700 geodetic GPS receivers, and differentially corrected using a network of benchmarks installed at camps along the glacier margin. Ice velocities were measured at cross-sections at Urdukas, Gore I, Concordia and across the two main glacier tributaries: Godwin Austen and Baltoro South (Fig. 1). In addition, a longitudinal profile was collected along a central flowline from Urdukas to the highest stake on the Baltoro South tributary (∼4640 m). Revisit periods varied from 1 day in the upper elevation areas to 13 days for the cross-profile at Urdukas (Table 2). Error in the horizontal displacement recorded over a single day was calculated to be ∼4 m a−1. For the longest revisit period at Urdukas, the accuracy of the velocity data is calculated to be better than 0.3 m a−1.
Table 2. Comparison of DGPS vs satellite-derived velocities. Points 1–14 surveyed by Copland; all other points surveyed by Mayer

During summer 2005, ice-motion data were collected along the length of Baltoro Glacier from repeated measurement of poles drilled into the ice (upper ablation area), or of crosses painted on large, stable supraglacial boulders (lower ablation area). Positions were recorded with a Trimble R7 DGPS unit, with site occupation of ≥30 min per visit and periods of 6–28 days between revisits (Table 2). Differential correction was undertaken using the Precise Point Positioning (PPP) method, or by comparison with base stations set up in nearby camps (located on bedrock) or in Skardu (∼80 km southwest). Errors in positioning are estimated to be ∼6 m a−1 for the shortest time interval data and ∼1.5 m a−1 for the longest time interval (28 day) data.
ERA-40 climate re-analysis data
Climate re-analysis data refer to the processing of meteorological observations by use of a physical model, in which data are produced in a physically consistent way and interpolated to a three-dimensional (3-D) grid. The ERA-40 monthly time-series data represent a second-generation analysis produced by the European Centre for Medium-Range Weather Forecasts, Reading, UK. Although the ERA-40 model resolution is relatively fine from a global perspective, it is quite coarse when examining results on spatial scales of hundreds of kilometres. For this reason, spatial averaging over the K2 region was used to describe regional climate fluctuations since the averaging procedure produces statistically more significant and robust results, although it does not account for spatial differences in temperature and precipitation resulting from topographic variability within the region.
A monthly time series was generated for our region to examine the long-term trends in temperature and precipitation. For temperature, the summer trend was considered most important, as melting dominates during the summer ablation season, and despite an increase in winter temperatures observed over our region, they are still below freezing and have little impact on ablation. The summer mean was computed by averaging June, July and August temperatures, and a Gaussian filter was used to produce a low-frequency trend from 1958 to 2001.
For precipitation, the annual mean data were considered most important, as snowfall occurs during all seasons of the year. A seasonal analysis was also performed to determine which seasons contribute most to the annual precipitation trend. A Gaussian filter was used to produce a low-frequency trend from 1958 to 2001. The annual precipitation data best characterize total snowfall and potential accumulation.
Tropical Rainfall Measuring Mission (TRMM) precipitation data
Regional observational precipitation data were acquired from the TRMM data visualization and analysis website (http://lake.nascom.nasa.gov/tovas/). Specifically, the 3B43 V6 rainfall data product was used. This product is considered the ‘best’ estimate of rainfall based upon satellite observational data as well as rain gauge data (Reference HuffmanHuffman and others, 2007). TRMM estimates of the monthly accumulated precipitation were employed to generate a spatially averaged time series using 0.25° × 0.25° data. The annual mean precipitation data from 1998 to 2007 are most relevant to this study, although we also conducted a seasonal analysis to better elucidate climate/velocity variations.
Results
Spatial patterns in flow
Derived velocity data demonstrate that Baltoro Glacier is currently active across its entire ablation and debris-covered area, with displacements of ∼15–20 m a−1, well in excess of the estimated noise in the data (±17 m a−1), detected immediately up-glacier of the terminus (Fig. 3). There is a general pattern of increasing motion with distance from the terminus, with the maximum velocity just below Concordia. This maximum of ∼180 m a−1 is located at the peak of a steep flow gradient (Fig. 3 inset). Up-glacier, the velocity drops steeply as the profile extends up the Baltoro South tributary, reaching a maximum of ∼170 m a−1, until the feature-tracking algorithm is no longer able to track features reliably over the clean-ice area.

Fig. 3. Average velocity field, 2003–08, derived from six annual pairs (cf. Table 1) and orthoprojected using Shuttle Radar Topography Mission (SRTM) digital elevation model (DEM) data. Inset: centre-line velocity profile; location as depicted by dashed yellow line in the main image.
Transverse velocity profiles extracted from annually averaged data are in agreement with the general trend of increasing flow with distance from the terminus (Fig. 4). The lowermost profile (t1) lacks displacement data towards the glacier margins, but shows uniform velocity across the glacier width and a gradual reduction in flow with distance from the centre line. Profiles t2–t5 are of a distinctly ‘blocky’ nature, with little variation in flow speed across almost the entire width of the glacier, and a rapid decrease in velocity at the glacier margins from rapidly flowing to almost stagnant ice.

Annual fluctuations (1992–2008)
Annual velocity profiles show a strong consistency in the spatial variability of flow across the entire glacier snout (Fig. 5). The greatest consistency is in the lowermost 16 km of the glacier, where multi-annual profiles largely replicate one another. Up-glacier, the profiles separate into two approximate groups: one group reflecting dynamics through the 1990s to 2004/05; and the second group reflecting conditions from 2004/05 to 2008. Within the latter group, velocities during 2005 were greatest, with an apparent speed-up of ∼20–25% immediately down-glacier of Concordia compared with earlier measurements. In recent years, velocities appear to have decreased again, although locally they remain ∼15–20% greater than displacements measured through the 1990s and early 2000s. Up-glacier of Concordia, all profiles display a more consistent pattern, with very little detectable interannual variability.

Fig. 5. Annual centre-line velocity profiles, 1993–2008. Date format is day/month/year.
Seasonal fluctuations (‘winter’ vs ‘summer’ pairs)
Summer and winter velocity data are in agreement with previous reports of a strong seasonal velocity gradient on Baltoro Glacier (Reference Mayer, Lambrecht, Belò, Smiraglia and DiolaiutiMayer and others, 2006; Fig. 6). There is a strong consistency in flow profiles for the lowermost 10 km of the glacier snout, beyond which the summer motion significantly exceeds winter motion. The greatest differences are apparent in the area around Concordia, where the summer velocities exceed the winter velocities by up to 65%. Further up-glacier, the seasonal speed-up is still evident, with summer velocities consistently exceeding winter velocities by up to ∼35%.

Fig. 6. Seasonal centre-line velocity profiles, 1996–2006. Date format is day/month/year.
A notable feature of the seasonal velocity data is the apparent speed-up of Baltoro Glacier during winter months in recent years. Centre-line profiles demonstrate that the data collected over winter 2007/08 exceed those collected over winter 2003/04 by as much as 25%, with a gradual increase in the intervening years (Fig. 6). Again, the greatest differences are recorded around Concordia, with, significantly, little annual variability detectable up-glacier on the Baltoro South tributary.
Summer-only velocity data confirm a significant speed-up of the glacier during summer 2005, with velocities exceeding those during the similar period in 2004 by approximately 20% in the area immediately below Concordia.
DGPS measurements (2004 and 2005)
Surface velocities measured by DGPS in summer 2004 are characterized by a pattern of increasing motion with distance from the terminus, up to a maximum of >200 m a−1 close to Concordia (Fig. 7; Table 2). Further up-glacier, measured surface displacements decrease markedly on both tributaries of the main Baltoro tongue, with a reduction in flow of >50% within 3.6 km upstream of Concordia. Local velocity increases are also observed, in particular where main tributaries (e.g. Biarchedi and Yermanendu Glaciers; Fig. 1) contribute to the ice flux.

Fig. 7. DGPS data collected during summer 2004 and summer 2005 field seasons. Inset: summer 2004/05 velocity profiles in grey, with field measurements for comparison.
Cross-profiles acquired at Concordia, on the Baltoro South tributary and on the Godwin Austen tributary, are restricted to the central part of the glacier and therefore exhibit little lateral variability. In contrast, cross-profiles at Gore I and Urdukas extend close to the glacier margin, where the surface velocities are shown to be 40–50% lower than ice velocities in the middle of the glacier (∼70 m a −1 compared with ∼125 m a−1 at Gore 1, and ∼50 m a−1 compared with ∼100 m a−1 at Urdukas).
A comparison between DGPS measurements in both study years indicates that velocities were consistently higher in 2005 than in 2004 for stakes at nearby locations, despite the measurements having been made over nearly identical periods in each summer (Table 2; Fig. 7). For example, velocities at Gore II were 245.0 and 239.4 m a−1 at points 8 and 9 over the period 6–14 July 2005, but only 181.9 m a−1 at a nearby location (blo4) for 5–12 July 2004. Similarly, for the two overlapping points on the Urdukas transect, measured ice motion was (a) 117.1 m a−1 for 1–15 July 2005 (point 6) compared with 95.7 m a−1 for 2–15 July 2004 (point u3), and (b) 91.5 m a−1 for 30 June– 15 July 2005 (point 5) compared with 82.9 m a−1(point u2) for 2–15 July 2004. For all these data, ice-flow direction varied by <3.5° between stake pairs, indicating that velocity changes cannot be attributed to differences in flow direction.
Overall, the field measurements from both 2004 and 2005 compare well with the data extracted by feature tracking (Table 2; Fig. 7 inset), confirming the large seasonal velocity variations on the glacier as well as the increased velocities in summer 2005 compared with summer 2004. For all of the feature-tracking points provided in Table 2, average annual velocities were ∼12% higher in 2005/06 than 2004/05, and ∼14% higher in summer 2005 than in summer 2004.
ERA-40 temperature and precipitation
The ERA-40 summer mean temperature data of 1958–2001 depict a negative summer temperature trend from 1958 to 1990, and a positive trend from 1990 to 2001 (Fig. 8a). This finding is in general agreement with the work of Reference Archer and FowlerArcher and Fowler (2004), although their analysis was based upon linear regression. The increase in temperatures during the 1990s suggests an increased influence of the southwest monsoon, possibly related to El Niño, which would have brought in warmer air currents, thereby increasing precipitation during the summer. Our seasonal analysis of ERA-40 summer precipitation trends indicates increasing precipitation during the 1990s.

Fig. 8. (a) Mean summer temperature, (b) mean annual precipitation, and (c) mean summer precipitation, all derived from ERA-40 reanalysis data. (d) Mean annual precipitation, derived from TRMM estimates.
The ERA-40 mean annual precipitation trend is positive from 1970 to 1990, and negative during the 1990s (Fig. 8b). Seasonal analysis indicates that the positive trend is primarily due to precipitation during the spring (westerlies) and summer. Other seasons show a negative trend during this time frame. Collectively, the precipitation and summer temperature trends support the interpretation of positive mass-balance conditions from 1970 to 1990. The negative trend in the 1990s is partially confirmed in the TRMM precipitation time series (Fig. 8d). Furthermore, a positive trend in summer precipitation from 1970 to 2001 demonstrates the potential influence of the summer monsoon given the temperature trend (Fig. 8c). Over this region, the westerlies provide the majority of the precipitation, and summer precipitation can also come from the westerlies. It is expected, however, that an increase in summer precipitation from the westerlies is associated with a decrease in temperatures.
TRMM precipitation
The TRMM mean annual precipitation data reveal a decrease in precipitation in the late 1990s, and non-linear smoothing reveals a positive trend from 2000 to 2005, followed by a negative trend (Fig. 8d). The highest annual accumulation occurs from 2003 to 2006. Consequently, the region experiences increases in precipitation during different time frames, due to variations in the influence and magnitude of the westerlies and the summer monsoon. Collectively, increases in annual precipitation and decreasing summer temperatures indicate that Baltoro Glacier is accumulating more mass at higher altitudes. It is important to note, however, that the region lacks direct mass-balance data, and that the spatio-temporal variations in ablation and snow accumulation are highly governed by multi-scale topographic influences.
Discussion
Several glaciers in the Karakoram are reported to have been thickening and advancing since the mid- to late 1990s (Reference HewittHewitt, 2005), in contrast to the trends of stagnant ice and surface downwasting observed in most other areas of the Himalaya (Reference Berthier, Arnaud, Kumar, Ahmad, Wagnon and ChevallierBerthier and others, 2007; Reference Bolch, Buchroithner, Pieczonka and KunertBolch and others, 2008; Reference Quincey, Luckman and BennQuincey and others, 2009). Modelled climate data presented here indicate that, in recent years, accumulation at high altitude has increased in the Karakoram, leading to positive mass balances and, ultimately, ice thickening and advance. In the specific case of Baltoro Glacier, field observations, centre-line velocity profiles presented here and by Reference CoplandCopland and others (2009), surface topographic information, and observed glacier morphology all indicate that it is currently gaining mass. There is only modest evidence of frontal fluctuations (Reference Mayer, Lambrecht, Belò, Smiraglia and DiolaiutiMayer and others, 2006; Reference Belò, Diolaiuti, Mayer, Mihalcea, Smiraglia, Vassena and BonardiBelò and others, 2008), but this is unsurprising given the estimated glacier response time, which is of the order of at least several decades for such a large ice mass (cf. equation (1b) of Reference Jóhannesson, Raymond and WaddingtonJóhannesson and others (1989)).
In general terms, the pattern of linearly increasing flow with distance upstream from the terminus is typical of debris-covered glaciers observed elsewhere in the wider Himalaya (e.g. Reference Scherler, Leprince and StreckerScherler and others, 2008; Reference Quincey, Luckman and BennQuincey and others, 2009). In several places, the velocity profile is complicated by the contributions of smaller tributary glaciers to the main Baltoro tongue, as well as the varying valley morphology. For example, the confluence of the two major glaciers at Concordia is one of the most interesting parts of the velocity profile, with the steep increase in flow clearly related to the convergence of the two masses. The decrease in flow immediately down-glacier is equally as steep, however, perhaps reflecting the wide valley morphology at this point. Similarly, another area of locally decreased flow, at around 19 km from the terminus, appears to reflect wide valley walls before the tributary of Yermanendu Glacier constricts the main glacier tongue again, increasing the velocity profile accordingly.
These general flow patterns are repeated year-on-year across the glacier surface, but with varying magnitude. Medium-term (i.e. >5 years) patterns in flow are likely to reflect local climatic trends, but validating such linkages is difficult. There is a general paucity of climate station data available in the Karakoram, particularly at high elevations. Modelled climate data are therefore a useful source of precipitation and temperature information (Reference Radiá and HockRadiá and Hock, 2006). However, their accuracy is dependent upon the quality of observational data (coverage and volume), model parameterization schemes, and data assimilation methods. Several investigations have indicated concern associated with using ERA-40 re-analysis data (e.g. Reference Allan, Ringer, Pamment and SlingoAllan and others, 2004; Reference Bengtsson, Hagemann and HodgesBengtsson and others, 2004; Reference Hagemann, Arpe and BengtssonHagemann and others, 2005), particularly because regional biases in temperature and precipitation are known to occur. The regional bias for the Himalaya does not tend to vary seasonally, but positive precipitation biases have been found and appear to be more pronounced in the summer (Reference Hagemann, Arpe and BengtssonHagemann and others, 2005).
A number of studies have attempted to validate ERA-40 data specifically for assessing climate trends and glacier response to climate in high-altitude environments. Strong correlations between observed and modelled precipitation and temperature data have been found in alpine Switzerland (Reference Kunz, Scherrer, Liniger and AppenzellerKunz and others, 2007), the French Alps (Reference MartinMartin, 2004) and alpine Sweden (Reference Radiá and HockRadiá and Hock, 2006). There is no longterm climate station record for the high-altitude K2 region, other than that of the Skardu valley climate station at a much lower altitude. Consequently, there are no representative observational data to compare with ERA-40. Observational estimates of precipitation are available from TRMM data of the region from 1998 to 2001. There is good correlation between the two time series, indicating the reliability of our ERA-40 precipitation data. Furthermore, ERA-40 temperature trends correspond well with regional climate station temperature trends reported by Reference Fowler and ArcherFowler and Archer (2006), indicating the ERA-40 temperature data are also of good quality.
Our seasonal analysis of ERA-40 data indicates that winter precipitation increased from 1958 to the early 1970s, and then decreased systematically. These data suggest that the medium-term speed-up of Baltoro Glacier is related to the increase in spring precipitation from the westerlies from 1970 to 1990, as precipitation rates are much higher than in winter, and the increase in precipitation during the summer can also add to the overall accumulation. For more recent years, seasonal analysis of TRMM data indicates an increase in winter precipitation from 1998 to 2006. An increase in precipitation also occurred during spring months from 2000 to 2006, with more accumulation observed in spring vs winter. In contrast, a decrease in summer precipitation was found for this time period. Therefore, increasing precipitation from the westerlies during the winter and spring may explain the non-summer speed-up of Baltoro Glacier since the mid-1990s.
Previous work has also shown statistically significant increases in winter and summer precipitation in the Karakoram since the early 1960s (Reference Archer and FowlerArcher and Fowler, 2004), although widespread mass loss was observed in Karakoram glaciers for the majority of the 20th century, until the mid-1990s (Reference Yao, Pu, Liu and KnightYao and others, 2006; Reference HewittHewitt, 2007). The frequently heavy debris cover of these glaciers is likely to have provided a muted response to climatic effects (Reference Benn and LehmkuhlBenn and Lehmkuhl, 2000), and it is possible that recent changes are a symptom of the lag-time associated with the surface cover. As stated, simple response time theory (e.g. Jóhannesson, 1989) suggests that geometric changes on Baltoro Glacier may be possible from mass-balance perturbations on the timescale of decades, and modelling studies elsewhere have shown that rapid areal and volumetric changes (albeit recessional) can take place under certain temperature–precipitation scenarios (e.g. Reference OerlemansOerlemans and others, 1998). Nevertheless, glacier expansion in the Karakoram has occurred on a temporal scale less than the estimated response time of Baltoro Glacier. It has also occurred non-uniformly (Reference HewittHewitt, 2005), indicating that factors other than, or in addition to, changing mass balance are influential in changing glacier velocities over the longer term.
The sudden speed-up of Baltoro Glacier observed during summer 2005 is an interesting departure from the gradual trend of increasing flow in recent years, and supplies evidence for meltwater playing an important role in glacier flow. Fluctuations in surface velocity have long been linked to the volume of meltwater available to the subglacial drainage system (Reference WillisWillis, 1995; Reference Kavanaugh and ClarkeKavanaugh and Clarke, 2001; Reference Purdie, Brook and FullerPurdie and others, 2008), particularly in cases where sliding is the predominant flow mechanism. Weather during the winter of 2004/05 was particularly anomalous in this region, with the international media reporting periods of record cold and prolonged snowfall that produced the deepest accumulations for decades, resulting in the burial of entire villages, emergency air drops of food supplies, >1000 deaths from hypothermia, house collapses and widespread avalanching (www.unicef.org/infobycountry/pakistan_25386.html; http://edition.cnn.com/2005/WORLD/asiapcf/02/24/asia.cold.snap). TRMM results presented here confirm that accumulation has been increasing in the region since 2000, and seasonal analyses show the precipitation increase has been particularly strong during winter months.
Our data indicate that, in the specific case of summer 2005, the rapid melting of the deep winter snowpack is likely to have introduced large volumes of meltwater to the glacier bed, thus increasing water pressure in subglacial channels and conduits that were not sized for such anomalously large water flows. In turn, this would have led to increased basal sliding and surface ice motion (cf. Reference Kavanaugh and ClarkeKavanaugh and Clarke, 2001). At Concordia in particular, there are many large and deep supraglacial streams in the summer, especially where Baltoro South and Godwin Austen glaciers join. These streams are large enough to make navigation between these glaciers difficult, and field observations in summer 2005 indicate that they descend to the glacier bed via moulins a few kilometres downstream of Concordia. These moulins coincide with the start of the locations where the highest overall velocities are recorded (Fig. 3), and where the most marked speed-ups occurred in summer 2005 (Fig. 6). Overall, therefore, it is possible that the flow regime of the glacier is heavily influenced by both long-term mass variations and periodic summer meltwater availability.
Previous work on the seasonal variability in flow of Baltoro Glacier concluded that basal sliding plays a major part in ice transport (Reference Mayer, Lambrecht, Belò, Smiraglia and DiolaiutiMayer and others, 2006). Data presented here support this assertion, at least for the upper parts of the ablation area where the difference between summer and winter velocities is at its greatest. Up-glacier transverse velocity profiles are also indicative of a dominantly sliding flow regime, with their ‘blocky’ nature indicating the down-glacier movement of ice en masse, termed elsewhere as plug flow (Reference KickKick, 1962). The strong consistency of summer and winter profiles in the lowermost 10 km of the glacier tongue indicates that deformation dominates there, rather than basal sliding. Similar conclusions were reached by Reference CoplandCopland and others (2009).
Conclusions
The seasonal and temporal variability in surface ice motion exhibited by Baltoro Glacier over a 15 year period has been quantified by a combined field and remote-sensing based approach. The two datasets are highly complementary, with point-based field data revealing local variations in flow over short periods and image-based feature tracking providing glacier-wide flow fields over longer temporal windows. These data demonstrate that Baltoro Glacier is very active, even immediately up-glacier of its terminus. The highest surface velocities occurred during summer 2005, following a peak in precipitation the previous winter. These data indicate that the flow regime of the glacier is heavily influenced by meltwater availability as well as local-scale mass variability. Furthermore, large seasonal velocity gradients indicate a flow regime dominated by basal sliding, at least in parts. Winter velocities reveal a gradual speed-up of the glacier year-on-year since 2003, implying a glacier in positive mass balance, which is supported by our climate data showing increasing accumulation in the region since 2000.
In the wider Himalayan context, the Karakoram is certainly anomalous, at least because the glaciers here do not show evidence of stagnation over their lower reaches (Reference CoplandCopland and others, 2009). However, the finer spatial and temporal variabilities in glacier dynamics in this region remain poorly understood, and their anticipated impact on water resources is largely unknown. Further work is required to establish the degree to which reported positive mass balances and glacier acceleration in the region have resulted in ice thickening (or possibly thinning, in response to extension) and terminal fluctuations. With information on both horizontal and vertical surface changes, the accurate modelling of glacier responses to continued climatic forcing should become possible, and the implications for water resources better understood.
Acknowledgements
Remote-sensing data were supplied under a European Space Agency (ESA) Category-1 agreement (5033-Quincey), and funding for D.J. Quincey was provided by Research Councils UK. Funding for L. Copland was provided by the US National Science Foundation, the US National Geographic Society, the Natural Sciences and Engineering Research Council of Canada, the Canadian Foundation for Innovation, the Ontario Research Fund and the University of Ottawa. Field assistance was provided by the K2 2005 medical and science teams, Nazir Sabir Expeditions and dedicated porters and guides. Funding for M. Bishop was provided by the US National Science Foundation (BCS-0242339), the US National Geographic Society, and the National Aeronautics and Space Administration (NNG04GL84G). The expedition 2004 was generously supported by the Ev-K2-CNR ‘Scientific and Technological Research in Himalaya and Karakorum’ project. We thank reviewers A. Kääb and T. Bolch, whose comments helped to improve the quality of the paper.