


1. INTRODUCTION
Glacier surges are cyclic oscillations in glacier behaviour consisting of a switch from a slow-flowing ‘quiescent’ to a fast-flowing ‘active’ regime on timescales of years--decades (Meier and Post, Reference Meier and Post1969; Sharp, Reference Sharp1988). During the active surge phase, glacier velocities can increase by up to two orders of magnitude and large volumes of ice are transferred down valley, often accompanied by an advance of the terminus (Eisen and others, Reference Eisen2005; Frappé and Clarke, Reference Frappé and Clarke2007). In certain instances, glacier surges may advance to block river valleys causing lakes to form, and thereby increasing the risks of glacier lake outburst floods (Haemmig and others, Reference Haemmig2014; Round and others, Reference Round, Leinss, Huss, Haemmig and Hajnsek2017). For individual glaciers, surge features such as surge cycle length and flow velocity are often relatively consistent, but there is a high diversity in surge behaviour both between (Dowdeswell and others, Reference Dowdeswell, Hamilton and Hagen1991; Murray and others, Reference Murray, Strozzi, Luckman, Jiskoot and Christakos2003; Sevestre and Benn, Reference Sevestre and Benn2015) and within (Grant and others, Reference Grant, Stokes and Evans2009; Herreid and Truffer, Reference Herreid and Truffer2016; Bhambri and others, Reference Bhambri, Hewitt, Kawishwar and Pratap2017) regions.
Commonly, this diversity is classified into two primary groups. The first, hydrologically regulated surges, are caused by the subglacial hydrological system preferentially switching from a dominant channelised system operating at low water pressure during quiescence, to a governing high water pressure linked-cavity system during the surge (Kamb, Reference Kamb1987; Björnsson, Reference Björnsson1998; Jiskoot and others, Reference Jiskoot, Pedersen and Murray2001). These surges are characterised by short surge cycles (typically with 1--3 decades between surges); rapid active phases of <2 years (often beginning in the winter and/or terminating in summer); and high flow velocities (order 10–100 m d−1, compared with 0.1–10 m d−1 during the quiscent phase) (Björnsson and others, Reference Björnsson, Pálsson, Sigurdsson and Flowers2003; Eisen and others, Reference Eisen2005). In contrast, thermally regulated surges occur following a switch from predominantly cold-based ice during quiescence to the warm-based ice during the surge. These surges are more common in polythermal regimes, such as Trapridge Glacier, Canada (Clarke and Blake, Reference Clarke and Blake1991; Frappé and Clarke, Reference Frappé and Clarke2007), and Bakaninbreen, Svalbard (Murray and others, Reference Murray, Dowdeswell, Drewry and Frearson1998, Reference Murray, Strozzi, Luckman, Jiskoot and Christakos2003); have active phases lasting >10 years and quiescent phases that may last for centuries; peak ice velocities as low as 1–10 m d−1; and initiation and termination of the active phase independent of season (Dowdeswell and others, Reference Dowdeswell, Hamilton and Hagen1991; Jiskoot and others, Reference Jiskoot, Murray and Boyle2000; Jiskoot and Juhlin, Reference Jiskoot and Juhlin2009). A unified model of surging remains elusive, but recent attempts have been made to harmonise these two processes into an enthalpy framework with some success (Sevestre and Benn, Reference Sevestre and Benn2015). Part of the difficulty in producing a unified surge model is that the classification of glaciers is not strictly Boolean (surge-type vs. non-surge type), with speedup events varying greatly in terms of magnitude, duration and the total proportion of glaciers experiencing speedup (Herreid and Truffer, Reference Herreid and Truffer2016).
Surges occur on ~1% of glaciers globally (Jiskoot and others, Reference Jiskoot, Boyle and Murray1998), but are unevenly distributed, with two major ‘superclusters’: the ‘Arctic Ring’ and High Mountain Asia (HMA) (Sevestre and Benn, Reference Sevestre and Benn2015). In HMA, surge incidence can reach >10% (Barrand and Murray, Reference Barrand and Murray2006) and surge-type glaciers can cover 43% of glacierised area (Bhambri and others, Reference Bhambri, Hewitt, Kawishwar and Pratap2017). Despite the high incidence and coverage of surge-type glaciers in HMA, the region is understudied with regard to glacier change generally, and surge activity in particular. Testing existing surge theories in the context of glaciers in HMA is difficult given the diverse altitudinal ranges and accumulation/ablation patterns in the region that contrast with other areas where surges are relatively well understood (Hewitt, Reference Hewitt2014; Quincey and others, Reference Quincey, Glasser, Cook and Luckman2015). This factor is compounded by a lack of knowledge concerning glacier thickness, thermal regime and subglacial hydrology of HMA glaciers. Surges have been interpreted in terms of both the hydrological (Mayer and others, Reference Mayer, Fowler, Lambrecht and Scharrer2011; Paul and others, Reference Paul, Strozzi, Schellenberger and Kääb2017) and thermal (Quincey and others, Reference Quincey2011) switching mechanisms, although recent studies have concluded that controls may be more complex (Quincey and Luckman, Reference Quincey and Luckman2014; Quincey and others, Reference Quincey, Glasser, Cook and Luckman2015; Yasuda and Furuya, Reference Yasuda and Furuya2015) and studies continue to identify a great diversity of surge-type and surge-like glaciers (Bhambri and others, Reference Bhambri, Hewitt, Kawishwar and Pratap2017). In a study of eight Karakoram glaciers by Quincey and others (Reference Quincey, Glasser, Cook and Luckman2015), the dynamic evolution of surges displayed characteristics of both the hydrological and the thermal switching models, leading to the suggestion that no single mechanism is responsible for their instability, and that surge events in the region might lie on a spectrum of underlying causes, with the pure hydrological and pure thermal mechanisms representing the two end members of the spectrum.
It is apparent that the basal processes of surge-type glaciers in HMA are still very poorly understood, mostly limited by a lack of relevant field evidence from the region. Recently, an increase in remote-sensing studies has begun to fill in the record of surging in HMA, especially in the Karakoram (Hewitt, Reference Hewitt2007; Copland and others, Reference Copland2011; Quincey and others, Reference Quincey2011, Reference Quincey, Glasser, Cook and Luckman2015; Gardelle and others, Reference Gardelle, Berthier and Arnaud2012, Reference Gardelle, Berthier, Arnaud and Kaab2013; Heid and Kääb, Reference Heid and Kääb2012; Bhambri and others, Reference Bhambri, Hewitt, Kawishwar and Pratap2017), Pamir (Kotlyakov and others, Reference Kotlyakov, Osipova and Tsvetkov2008; Heid and Kääb, Reference Heid and Kääb2012; Gardelle and others, Reference Gardelle, Berthier, Arnaud and Kaab2013) and Tien Shan (Osmonov and others, Reference Osmonov, Bolch, Xi, Kurban and Guo2013; Pieczonka and Bolch, Reference Pieczonka and Bolch2015; Mukherjee and others, Reference Mukherjee2017). However, the West Kunlun Shan (WKS) remains notably understudied, with only one detailed study of surge dynamics (Yasuda and Furuya, Reference Yasuda and Furuya2015). This is particularly notable given the recent observations that the ‘Karakoram Anomaly’ of stable and positive glacier mass balances extend to, and may even be centred over, the WKS (Kääb and others, Reference Kääb, Treichler, Nuth and Berthier2015; Cogley, Reference Cogley2016; Brun and others, Reference Brun, Berthier, Wagnon, Kääb and Treichler2017; Wang and others, Reference Wang2018).
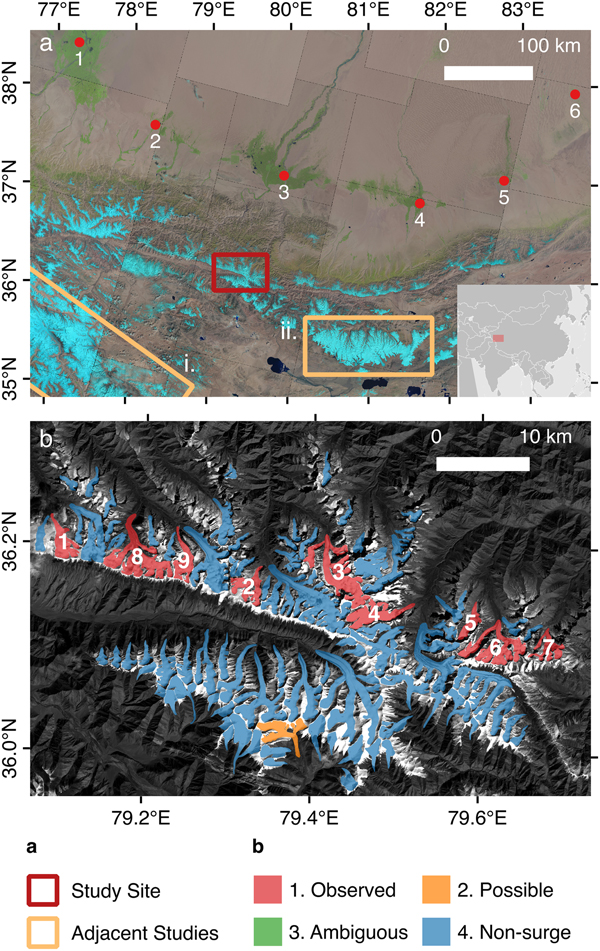
Here, we aim to expand the record of surging in the WKS by using the 1972–2017 Landsat record to identify recent surge events in a previously unstudied area, and to examine the dynamics of any surge events found in an attempt to better understand their causal mechanisms. The study area lies between two other areas where two previous studies of surge incidence and dynamics were centred: one in the Karakoram (Quincey and others, Reference Quincey, Glasser, Cook and Luckman2015, box (i) in Fig. 1) and one in the WKS (Yasuda and Furuya, Reference Yasuda and Furuya2015, box (ii) in Fig. 1). We identify nine new surges, considerably smaller in area than previous surge-type events identified in the region, expanding the record of surge-type glaciers in the WKS.
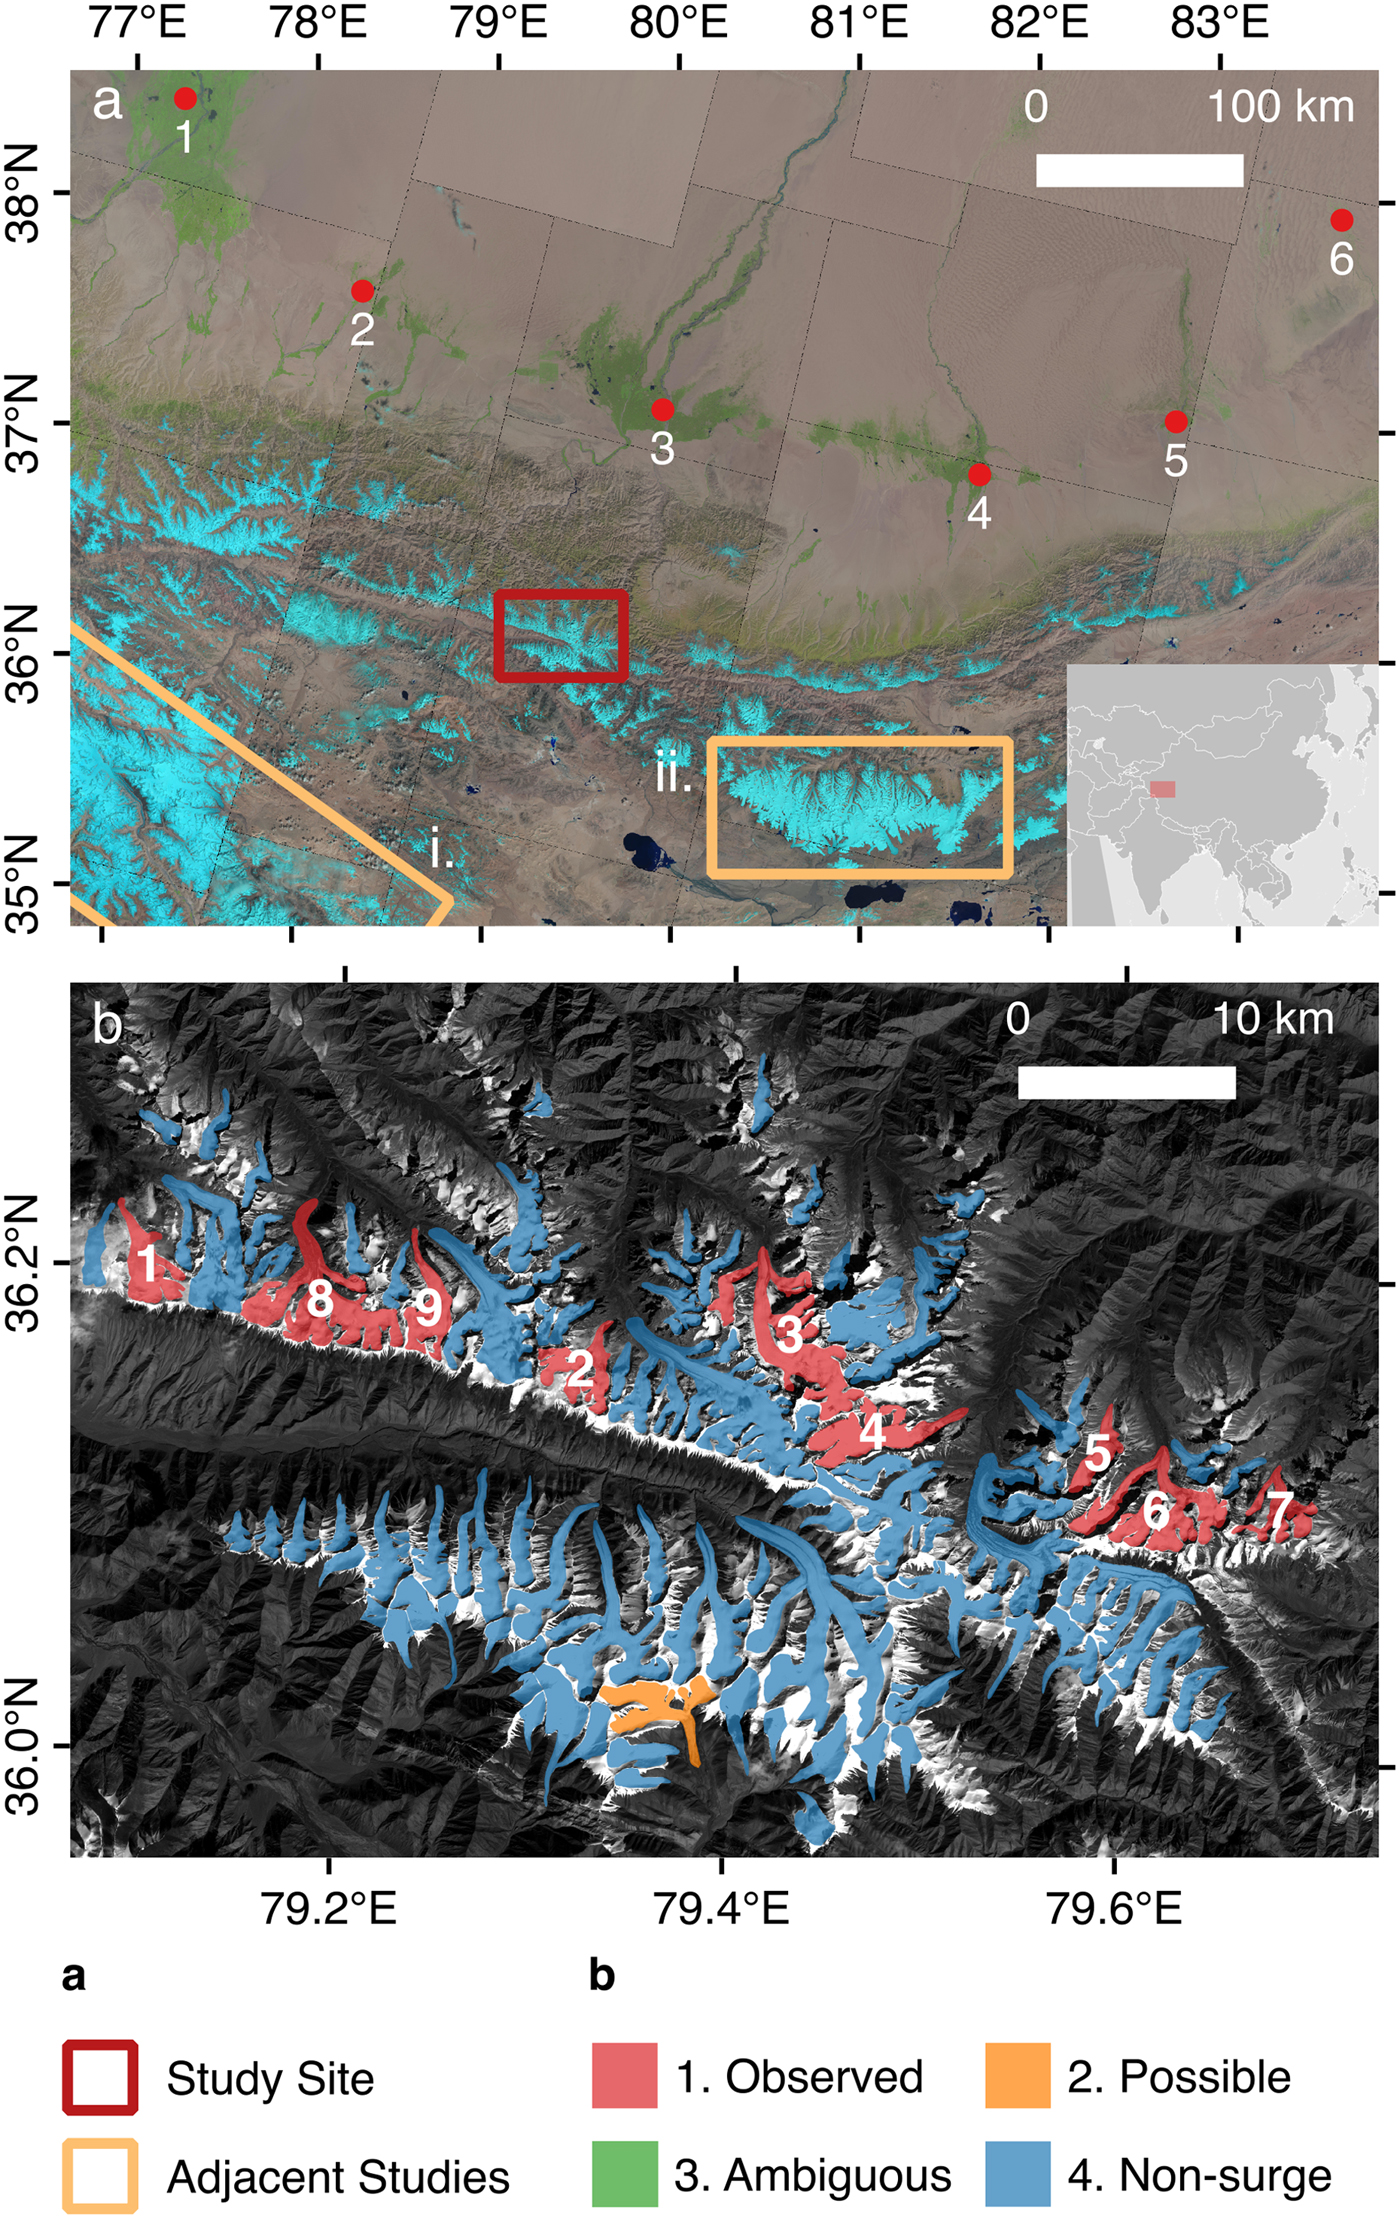
Fig. 1. (a) Location of study site within the WKS (red box), as well as the adjacent relevant studies of (i.) Quincey and others (Reference Quincey, Glasser, Cook and Luckman2015) and (ii.) Yasuda and Furuya (Reference Yasuda and Furuya2015). Numbered red circles show the locations of the meteorological stations used in this study, which are detailed in table S1. Location of study region within Asia is shown in the inset. (b) Manually delineated outlines of all glaciers >1 km2 for the year 2000. Red glaciers are type one (observed); orange glaciers are type two (possible); and blue glaciers are type three (non-surging). No glaciers of type three (ambiguous) are identified. Explanations of classifications can be found in methods section.
2. STUDY REGION
We examine a ~ 40 km × 60 km zone of the WKS in the Hotan Prefecture of Xinjiang Autonomous Region, China (Fig. 1). The one named peak in the study area is Qierlizuoke Feng (6802 m a.s.l.), and the nearest village is Dahongliutan (to the southwest of the study glaciers). The area contains 88 glaciers larger than 1 km2, none of which are currently accorded surge status in the global inventory of Sevestre and Benn (Reference Sevestre and Benn2015). Glaciers in the study area feed the Hotan River, one of the major tributaries of the Tarim River. Shangguan and others (Reference Shangguan2009) report that glaciers in the Hotan river basin retreated just 0.7% between 1970 and 2000, the smallest retreat of any Tarim river basin (where the overall retreat was 3.3%). This small shift in mass balance for the Hotan basin is consistent with recent observations that the ‘Karakoram Anomaly’ of neutral or positive glacier mass balances extends towards or into the WKS (Kääb and others, Reference Kääb, Treichler, Nuth and Berthier2015; Cogley, Reference Cogley2016).
The study region lies ~ 150 km to the west of the most glacierised area in the WKS (outline (ii.) in Fig. 1), a dense collection of glaciers between Aksayqin and Keriya Pass, centred around the highest peak in the WKS, Liushi Shan (7167 m a.s.l.). This region (hereafter the Liushi region) has attracted the majority of glacial research in the WKS (Shangguan and others, Reference Shangguan2007; Yasuda and Furuya, Reference Yasuda and Furuya2013, Reference Yasuda and Furuya2015; Bao and others, Reference Bao, Liu, Wei and Guo2015; Wang and others, Reference Wang2018) by virtue of it containing the largest glaciers – such as the Duefeng Glacier – and the 120 km2 Guliya Ice Cap, the largest ice cap in China. Given the cold, dry, continental climate of the Liushi region, it is thought that glaciers there are mostly cold-based (Shi and Liu, Reference Shi and Liu2000; Bao and others, Reference Bao, Liu, Wei and Guo2015), although there are very few direct field measurements and Yasuda and Furuya (Reference Yasuda and Furuya2013) observed summer speed-ups on some glaciers, which, they argued, is inconsistent with a strictly cold bed.
Studies of surge dynamics of glaciers in the WKS are limited to those of Yasuda and Furuya (Reference Yasuda and Furuya2013, Reference Yasuda and Furuya2015) for the Liushi region, where nine of the 31 major valley glaciers were identified as surge type. These were confirmed by Wang and others (Reference Wang2018) in a study focused on mass-balance changes of the region since the 1970s. Similar to reports from the nearby study of the Karakoram by Quincey and others (Reference Quincey, Glasser, Cook and Luckman2015) (outline (i) in Fig. 1a), surge characteristics did not clearly align with either hydrological or thermal switch theories, showing slow build-ups to the active phase and peak velocities 0.2–1 km a−1 (suggestive of a thermal switch), but with clear seasonal influences of hydrology on glacier dynamics (suggestive of a hydrological switch – e.g. Round and others, Reference Round, Leinss, Huss, Haemmig and Hajnsek2017). Quincey and others (Reference Quincey, Glasser, Cook and Luckman2015) suggested that the colder and drier climates of the Karakoram (compared with, for example, Alaska or Iceland) reduce meltwater supply and can extend the length of the active phase relative to traditional hydrological surges of more temperate glaciers.
3. DATA SOURCES AND METHODS
3.1. Data sources
We use satellite imagery from the Landsat MSS, Landsat TM, Landsat ETM+ and Landsat OLI to form a complete suite of available Landsat imagery from 1972 to 2017. We downloaded all available level 1 T (terrain corrected) Landsat scenes (path 146, row 035) with <40% cloud cover from earthexplorer.usgs.com (for a full list of Landsat scenes used, see Table S1). Visual analysis confirmed that the level 1 T orthorectification was correct to within a pixel for the study area, which matches the assessment made by Quincey and others (Reference Quincey, Glasser, Cook and Luckman2015).
3.2. Surge identification
We identified surges based on a systematic analysis of all available summer Landsat imagery, following pre-existing descriptors and classifications of surge-type glaciers (Copland and others, Reference Copland, Sharp and Dowdeswell2003; Yasuda and Furuya, Reference Yasuda and Furuya2015). As in these previous studies, we distinguish four types of surge status: (1) confirmed: the active phase is clearly observed, with distinct surface features (including severe crevassing, surge bulge and/or rapid advance of glacier front) and rapid terminus advance (>200 m in the span of less than a decade); (2) likely: multiple lines of distinct geomorphic evidence of previous surge activity are present (e.g. looped moraines, surface crevassing, rapid retreat unrelated to the surrounding glaciers) but no active phase is observed; (3) possible: two or fewer surge features are present, and the active phase is not observed; (4) non-surging: no features indicative of surging are present within the study period. We have not found any evidence of glaciers in the region being named: as a result, type 1 glaciers receive numbered IDs, which we have identified in Figure 1 and refer to in the text.
3.3. Terminus positions
We assessed changes in terminus position from 1990 to 2017 for glaciers 1–7 (i.e. identified type 1 glaciers for which regular, high-quality satellite imagery was available through the active phase). Assessment of terminus changes followed a standardised box measurement method (Moon and Joughin, Reference Moon and Joughin2008). The ‘box’ extended from an arbitrary reference gate upglacier, and approximately delineated the sides of the glacier. We manually digitised the ice front position and the mean length of the box was calculated by dividing box area by box width (Fig. 2 of Moon and Joughin, Reference Moon and Joughin2008). Total glacier length was then calculated by adding the mean box length to the remaining length of glacier centreline from reference gate to headwall. Compared with alternative methods of length terminus change measurement (e.g. using a single reference flowline), this method has the advantage of averaging errors across multiple pixels over the entire ice front width. This long-term dataset exists for all glaciers but glacier 1, where decaying ice at the front of the glacier made it difficult to identify its terminus position prior to the surge. Instead, for glacier 1, we tracked the position of the surge bulge. Glacier 1 was the only one to display such a feature during the surge (See Fig. 3c below). Although we continue to refer to the generic term ‘terminus advance’ below, for glacier 1 this strictly refers to the surge bulge advance. The error was estimated by digitising a stationary feature across the study period, assuming all changes are due to manual digitisation error. We digitised ~400 m (approximating the average width of glaciers in the dataset) of ridgeline in the bedrock across the 1990–2017 study period. Calculating the standard deviation of all stationary measurements provided a subpixel error estimate of ±9.3 m.
The identification of the surge initiation period is difficult, particularly as surges begin in the Landsat 7 SLC-off period for which velocity data cannot be derived via feature tracking. However, it has been shown previously for surge-type glaciers in northwest Svalbard that periods of fast glacier velocity correlate closely with periods of rapid terminus advance (Mansell and others, Reference Mansell, Luckman and Murray2012). Hence, we can use terminus position to infer surge period. We use the strucchange package for R (Zeileis and others, Reference Zeileis, Leisch, Hornik and Kleiber2001) to quantify the beginning of each surge period using the terminus position data. This software can quantify structural changes in time series data (Zeileis and others, Reference Zeileis, Kleiber, Krämer and Hornik2003) by implementing the algorithm described by Bai and Perron (Reference Bai and Perron2003) to compute optimal ‘breakpoints’ in linear regression models, where a continuous data series can be divided into multiple stable regression relationships. Multiple breakpoints were identified through the asymptotic advance of the terminus position through surge active phases, from which we chose the first and last to represent the beginning and end of each surge (and hence included pre- and post-surge phases within the definition of ‘surge period’). Given the relatively coarse temporal resolution of terminus position (averaging four per year between 2000 and 2017) the specific month identified by the method represents no more than a guide.
3.4. Velocity tracking
We derive velocity fields for pairs of Landsat 7 ETM + (SLC-on) imagery between 1999 and 2003 and Landsat 8 OLI band 8 (15 m panchromatic) imagery between 2013 and 2017 using cross-correlation feature tracking methods. Images were pre-processed by applying a high-pass filter to highlight high-frequency signals (i.e. crevasses). Following this, we used the open-source ‘Image GeoRectification and Feature Tracking’ (ImGRAFT) toolbox for MATLAB (Messerli and Grinsted, Reference Messerli and Grinsted2014) to derive velocity fields. The template size was set to 21 × 21 pixels and optimal search areas were manually determined for each image, between 41 × 41 and 71 × 71 pixels. Subsequent velocity fields were filtered to identify robust measurements. First, pixels with a signal-to-noise ratio (SNR) <3.5 were removed. Second, extreme velocity anomalies were removed by applying a realistic upper threshold based on the highest-quality velocity fields for each period (varying between 100 and 1500 m a−1 depending on whether the glaciers were in quiescent or active phases). Third, data were filtered to remove those deviating from dominant flow directions beyond a set threshold (between 45° and 90° dependent on glacier geometry). After filtering, an estimate of the final uncertainty (σ) was made using a standardised assessment (McNabb and others, Reference McNabb2012; Quincey and others, Reference Quincey, Glasser, Cook and Luckman2015).
 $$\sigma = {{(C_{\rm pix} + C_{\rm match})\Delta x}\over {\Delta t}}$$
Where C pix is the uncertainty in co-registration and C match is the uncertainty of the matching algorithm (both assigned typical values of 0.5 pixels), x is the image resolution (15 m), and t is the time interval between the image pair in days. Full uncertainties for each scene are presented in the supplementary material (Table S2).
3.5. Climate data
To place surge activity into a wider climatic context, we use monthly climate data from the Chinese Meteorological Administration (CMA), obtained from six meteorological stations across southern Xinjiang. Locations of the six stations are shown in Figure 1, and detailed in the supplementary material (Table S3). Data collection starts in the 1950s, but in the interests of a continuous dataset, we use only data from January 1960 until June 2016, bar for the Andehe station (station six), for which data terminates in December 1998. In order to identify trends, a non-parametric Mann-Kendall test is used to assess changes in temperature and precipitation data, for: (i) the nearest station to the study site (Hotan); and (ii) the average of the six stations across the region. Additionally, we perform linear regression analysis on the Hotan dataset, identifying seasonal and annual trends in mean, minimum and maximum annual temperature, as well as mean precipitation. We perform this across three timescales: the full climate dataset (1960–2016); and two subsets, 1960–86 and 1987–2016. We use this breakpoint as climate literature focussing on the Tarim Basin has previously identified a shift to a warmer and wetter climate occurring ~1986/87 (e.g Chen and others, Reference Chen, Takeuchi, Xu, Chen and Xu2006; Shi and others, Reference Shi2007), due to (i) a switch to an atmospheric pattern favouring enhanced southern wind and water vapour transport to the north from the Indian ocean; or (ii) an enhanced water cycle resulting from increased Indian Ocean temperatures (Shi and others, Reference Shi2007).
4. RESULTS
4.1. Surge incidence
From a total of 88 glaciers larger than 1 km2, we classify nine (10.2%) as type 1 (observed surge) (Fig. 1b; Fig. 2; Table 1), a proportion that aligns well with the 12.6% incidence reported in the adjacent Karakoram (Barrand and Murray, Reference Barrand and Murray2006). By area, surging glaciers occupy 20.2% of the total glacierised area, a figure smaller than the ~ 43% area reported by Bhambri and others (Reference Bhambri, Hewitt, Kawishwar and Pratap2017) for the Karakoram. The glaciers have a mean area of 9.2 km2, ranging in size from 17.0 km2 to as small as 3.5 km2. Glaciers generally consist of clean ice with little debris (the 88 glaciers have a median 1.41% debris covering), so geomorphic markers such as looped moraines were of little help in identifying previous surges. This has resulted in no occurrences of type 3 glaciers (those identified through limited geomorphic evidence). We identify only one glacier as type 2 based on geomorphic evidence and a dramatic observed retreat of ~ 600 m between the beginning and the end of the study period, which we interpret as a retreat following the termination of the active phase (a feature also observed in the dataset preceding the surges of glacier 1 and 3). In the quiescent phase, surge-type glaciers displayed minimal crevassing or other notable geomorphic features (Fig. 4a–c) and were indistinguishable from non-surging glaciers. Based on the general lack of available geomorphic evidence, we consider it highly likely that false negatives exist in the Landsat-derived dataset.
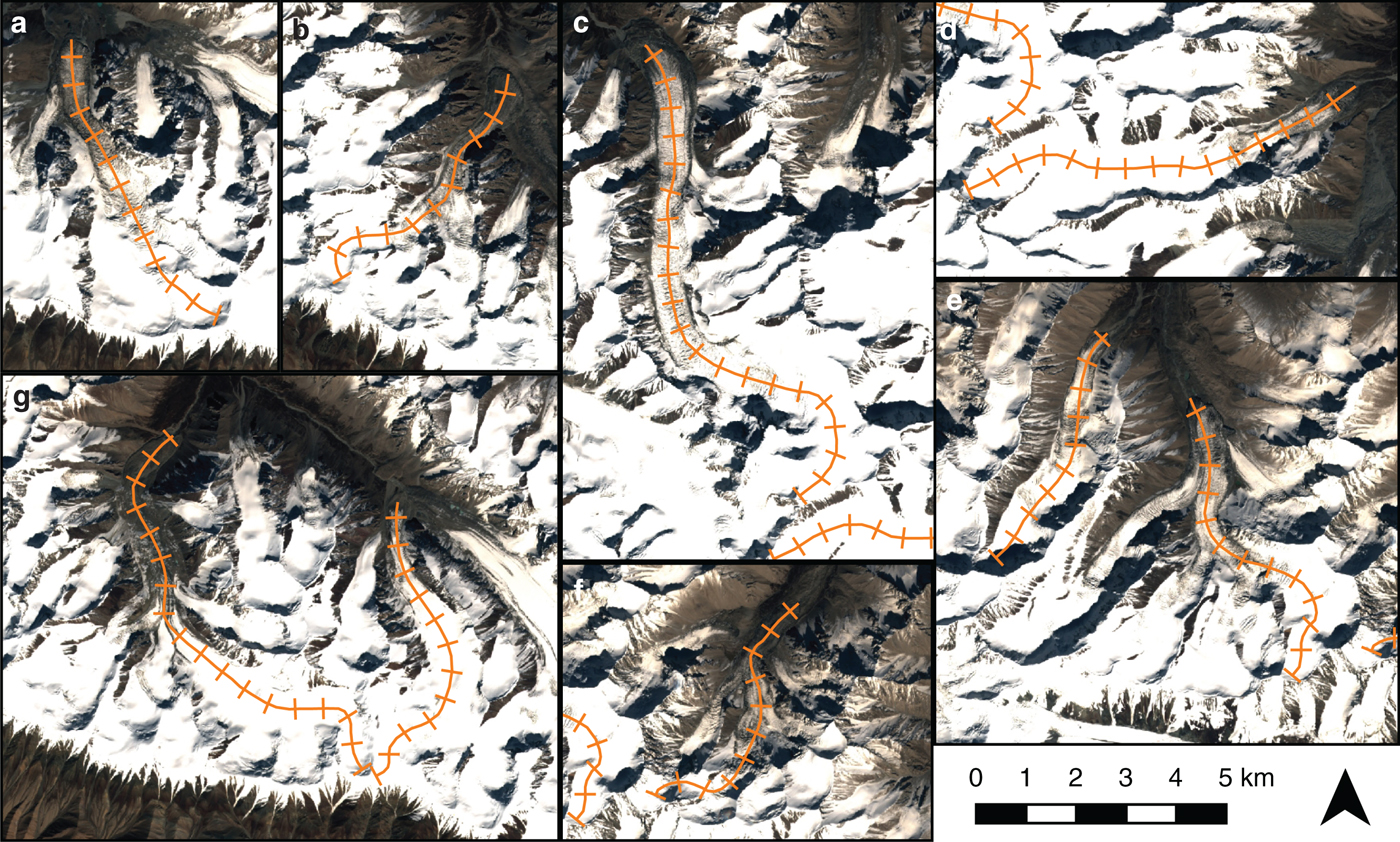
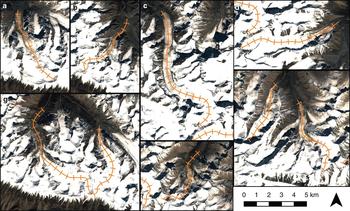
Fig. 2. Close-up and centreline profiles of the nine surge-type glaciers in detail. Clockwise from top left: (a) Glacier 1; (b) Glacier 2; (c) Glacier 3; (d) Glacier 4; (e) Glaciers 5 and 6; (f) Glacier 7; (g) Glaciers 8 and 9. Centreline profiles have tick marks every 1 km.
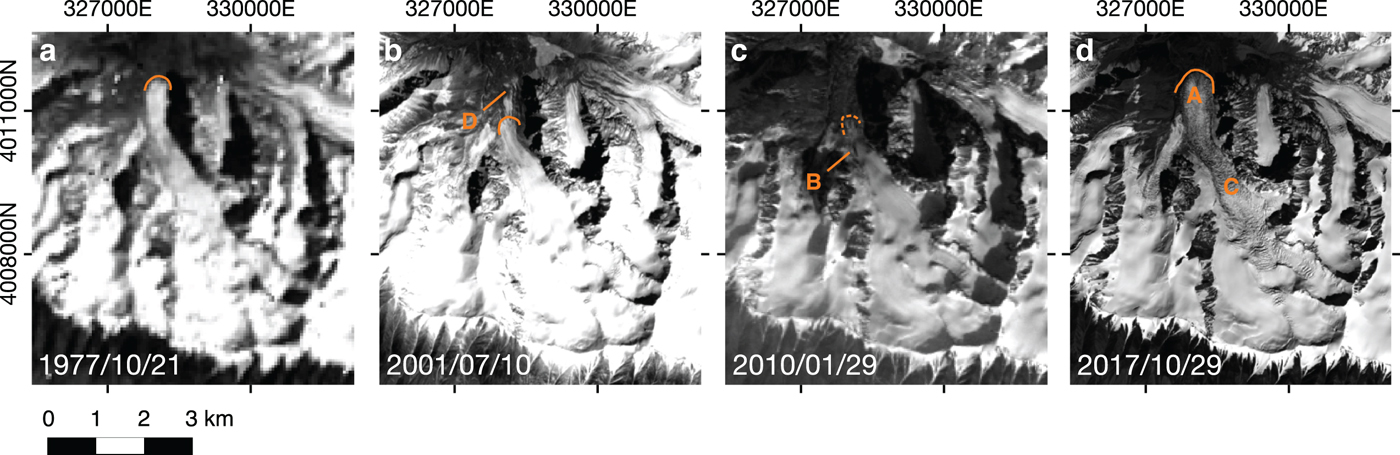
Fig. 3. Evolution of the surge of glacier 1, identifying (a) the previous maximum extent (1977-10-21 Landsat 2 MSS image), (b) decaying frontal ice (D) (2001-07-10 Landsat 7 ETM+ image), (c) the development of the surge bulge (B) (2010-01-29 Landsat 5 TM image) and (d) subsequent readvance in the active phase (A) and widespread crevasse development across the surface (C) (2017-09-29 Landsat 8 OLI image).
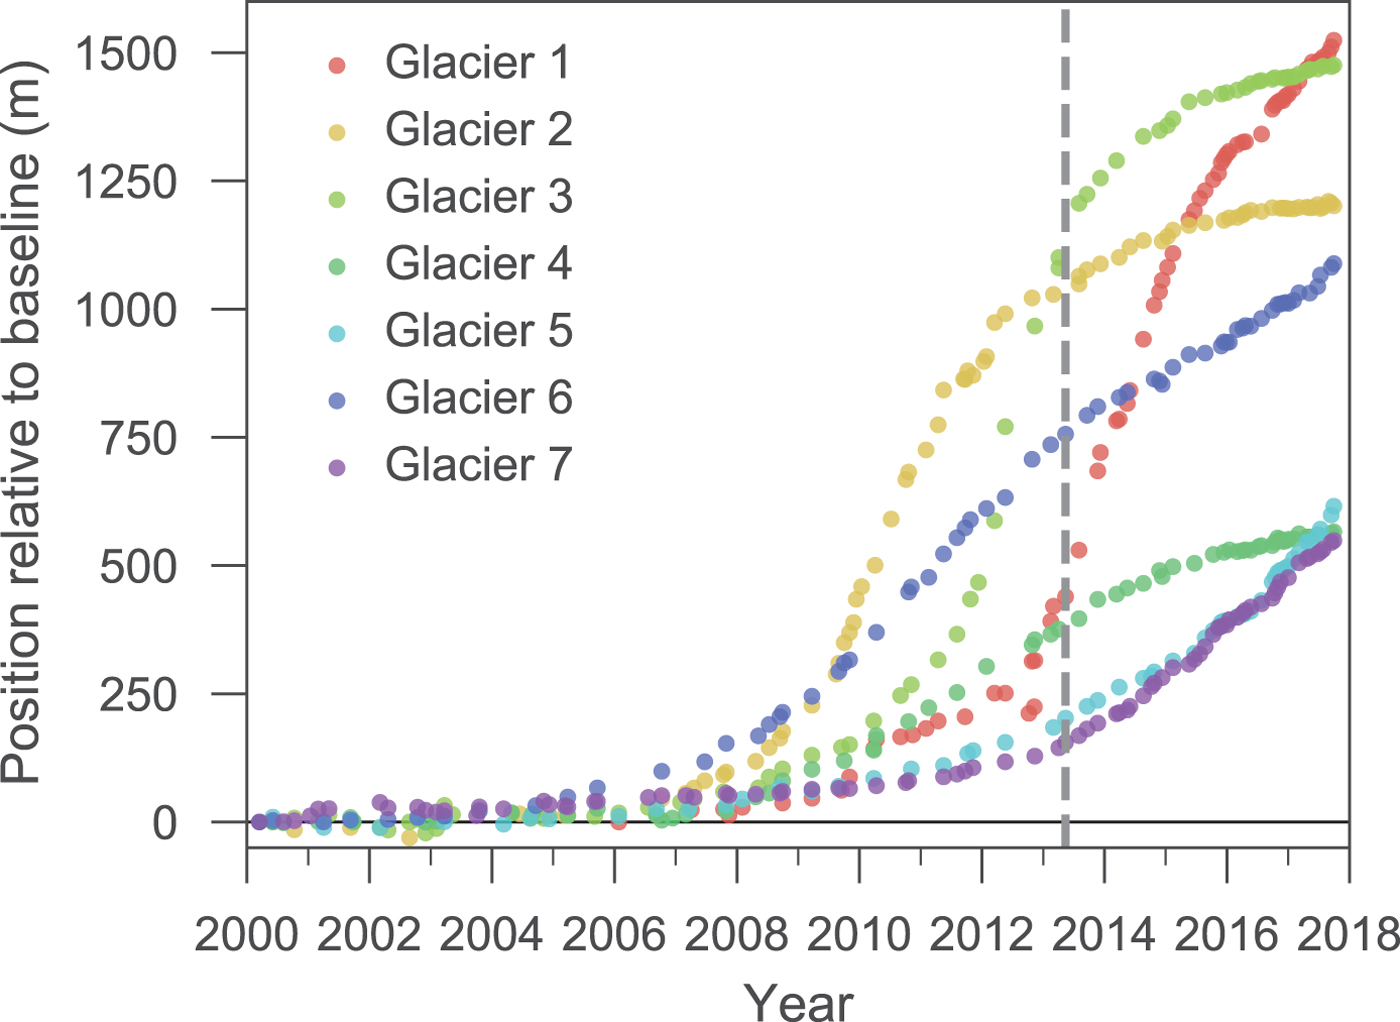
Fig. 4. Terminus advance of surge-type glaciers relative to 2000 baseline. For Glacier 1, the advance of the surge bulge relative to 2006 is plotted due to the difficulty of identifying the prior terminus position. Measurements are accurate to ±10.4 m. The dotted line marks the commencement of Landsat 8 OLI records, and thus feature tracking capability following the SLC-off phase.
Table 1. Locations and glacier characteristics for the nine identified surge-type glaciers.
Of the nine surges observed, only two (glaciers 8 and 9) occurred prior to 2000. These are identified by significant terminus advances between 1977 and 1990 (300 m for glacier 8 and 280 m for glacier 9), although due to sparse image availability the surge progressions themselves are missed in the Landsat record. The remaining seven glaciers (glaciers 1–7) display surges beginning after 2006. No prior active phases are visible for glaciers 1–7 in the Landsat record back to 1972, although we can observe the retreat of glaciers 1 and 3 from their previous maximum extent (cf. Fig. 3a-b). The extents of glaciers 1 and 3 in 1972 are very close to their (post-surge) extents today, suggesting that the glaciers may have recently surged shortly prior to the 1972 imagery. If this were the case, the return period of these glaciers would be of the order of 4 decades. This would be comparable with the Karakoram, where observational studies commonly report surge return periods of between 2 and 4 decades (Copland and others, Reference Copland2011; Quincey and others, Reference Quincey, Glasser, Cook and Luckman2015; Bhambri and others, Reference Bhambri, Hewitt, Kawishwar and Pratap2017). However, this is not uniform, and the other five glaciers that began surging after 2006 (glaciers 2, 4, 5, 6 and 7) do not exhibit such obvious signs of recent surge activity in the oldest imagery: indeed, the terminus position of glacier 6 is identical (within error) in 1972 and 2003, suggesting that either: (i) the previous surge occurred decades prior to 1972 and retreated to a ‘stable’ quiescent phase position before the modern satellite observation period; (ii) the glacier has not surged before; or (iii) the previous surge was not associated with terminus advance – which seems unlikely given the ~1 km advance associated with the recent observed surge.
4.2. Surge dynamics
For the seven most recent surges, we obtained 495 measurements of terminus position between 2000 and 2017 (averaging 71 per glacier) (Fig. 4). Glacier termini advanced between 500 and 1500 m in the latest surge period, reaching maximum rates of advance between 70 and 360 m a−1. For each glacier, the plotted terminus advance (Fig. 4) displays a distinct asymptotic curve, which we interpret not just as the active phase but also the pre-surge acceleration and post-surge deceleration phases described by Jiskoot (Reference Jiskoot2011). These pre- and post-surge phases last a few years, and are similar to those identified in the Karakoram: for example, Shingchukpi Glacier displayed a 3-year pre-surge phase prior to the main active phase in 2005 (Bhambri and others, Reference Bhambri, Hewitt, Kawishwar and Pratap2017), and Kygar Glacier displayed a 2-year pre-surge phase before the 2014 active phase (Round and others, Reference Round, Leinss, Huss, Haemmig and Hajnsek2017).
The results of breakpoint analysis to identify surge initiation/termination are shown in Table 2. Glaciers 1–6 began surging between 2006 and 2008, and glacier 7 began surging in 2010. Glaciers 2, 3 and 4 have reached the end of their active phase, and have surge periods of 7 (glaciers 2 and 3) and 8 (glacier 4) years respectively. The remaining glaciers have yet to terminate, and have been surging for 7 (glacier 7), 9 (glacier 5) and 11 (glaciers 1 and 6) years.
Table 2. Characteristics of surge dynamics in this study. Dates in format YYYY-MM.
aBetween 2000 (baseline) and 2017.
Consistent velocity tracking was successful for glaciers 3 and 6, the two largest glaciers, as well as for the smaller glacier 1. The Landsat 7 ETM+ SLC-off phase (2003–13) limited our ability to capture velocities during surge initiations, and in the future, it would be desirable to use additional radar imagery to provide velocity data in the 2003–13 data gap, such as the ENVISAT ASAR and ALOS PALSAR datasets used by Yasuda and Furuya (Reference Yasuda and Furuya2015). However, the 1999–2003 SLC-on phase allowed for the derivation of quiescent phase velocities. The 2013–17 imagery allowed for observation of the active phase and early termination of glacier 1, the termination of glacier 3 and the ongoing active phase of Glacier 6. We obtained a total of 69 velocity fields: 22, 28 and 19 velocity fields for glaciers 1, 3 and 6, respectively (full details including uncertainties are shown in supplementary material in table S2).
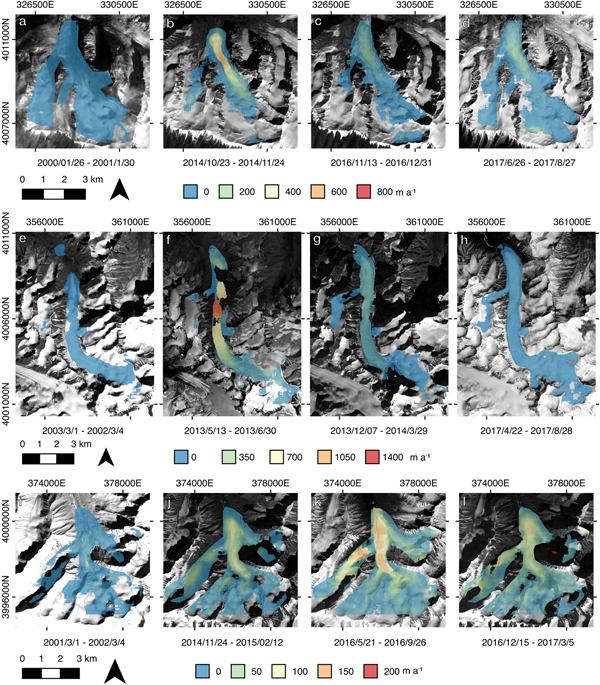
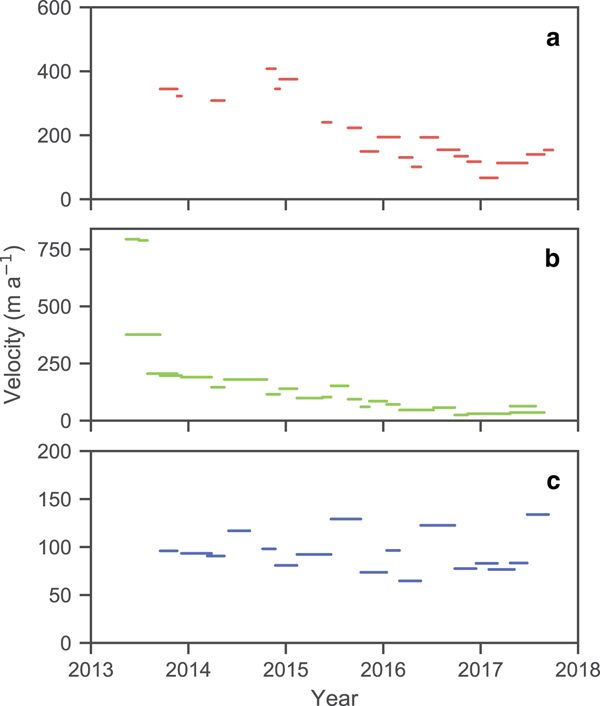
Quiescent phase velocities were universally low, always <50 m a−1 across the observed glaciers (Table 2; Figs. S1–S3). Peak velocities in the active phase were ~ 600 m a−1 for glacier 1, ~ 1200 m a−1 for glacier 3 and ~ 200 m a−1 for glacier 6. The three glaciers display maximum active phase accelerations of between one and two orders of magnitude but also display a sixfold difference in maximum active phase velocities between the glaciers. Acceleration was heterogeneous, and regions of fast flow were limited to the lower sections of the glaciers: ~3–5.5 km from the headwall for glacier 1, ~6–11 km for glacier 3 and ~3.5–6.5 km for glacier 6 (see Fig. 6). Peak accelerations were reached 1–2 km from the glacier termini (Fig. 5). Glaciers 3 and 6 display higher active phase velocities in the summers (Fig. 7b and c, 5k cf. 5j, 5l), indicative of seasonal changes in subglacial hydrological conditions.
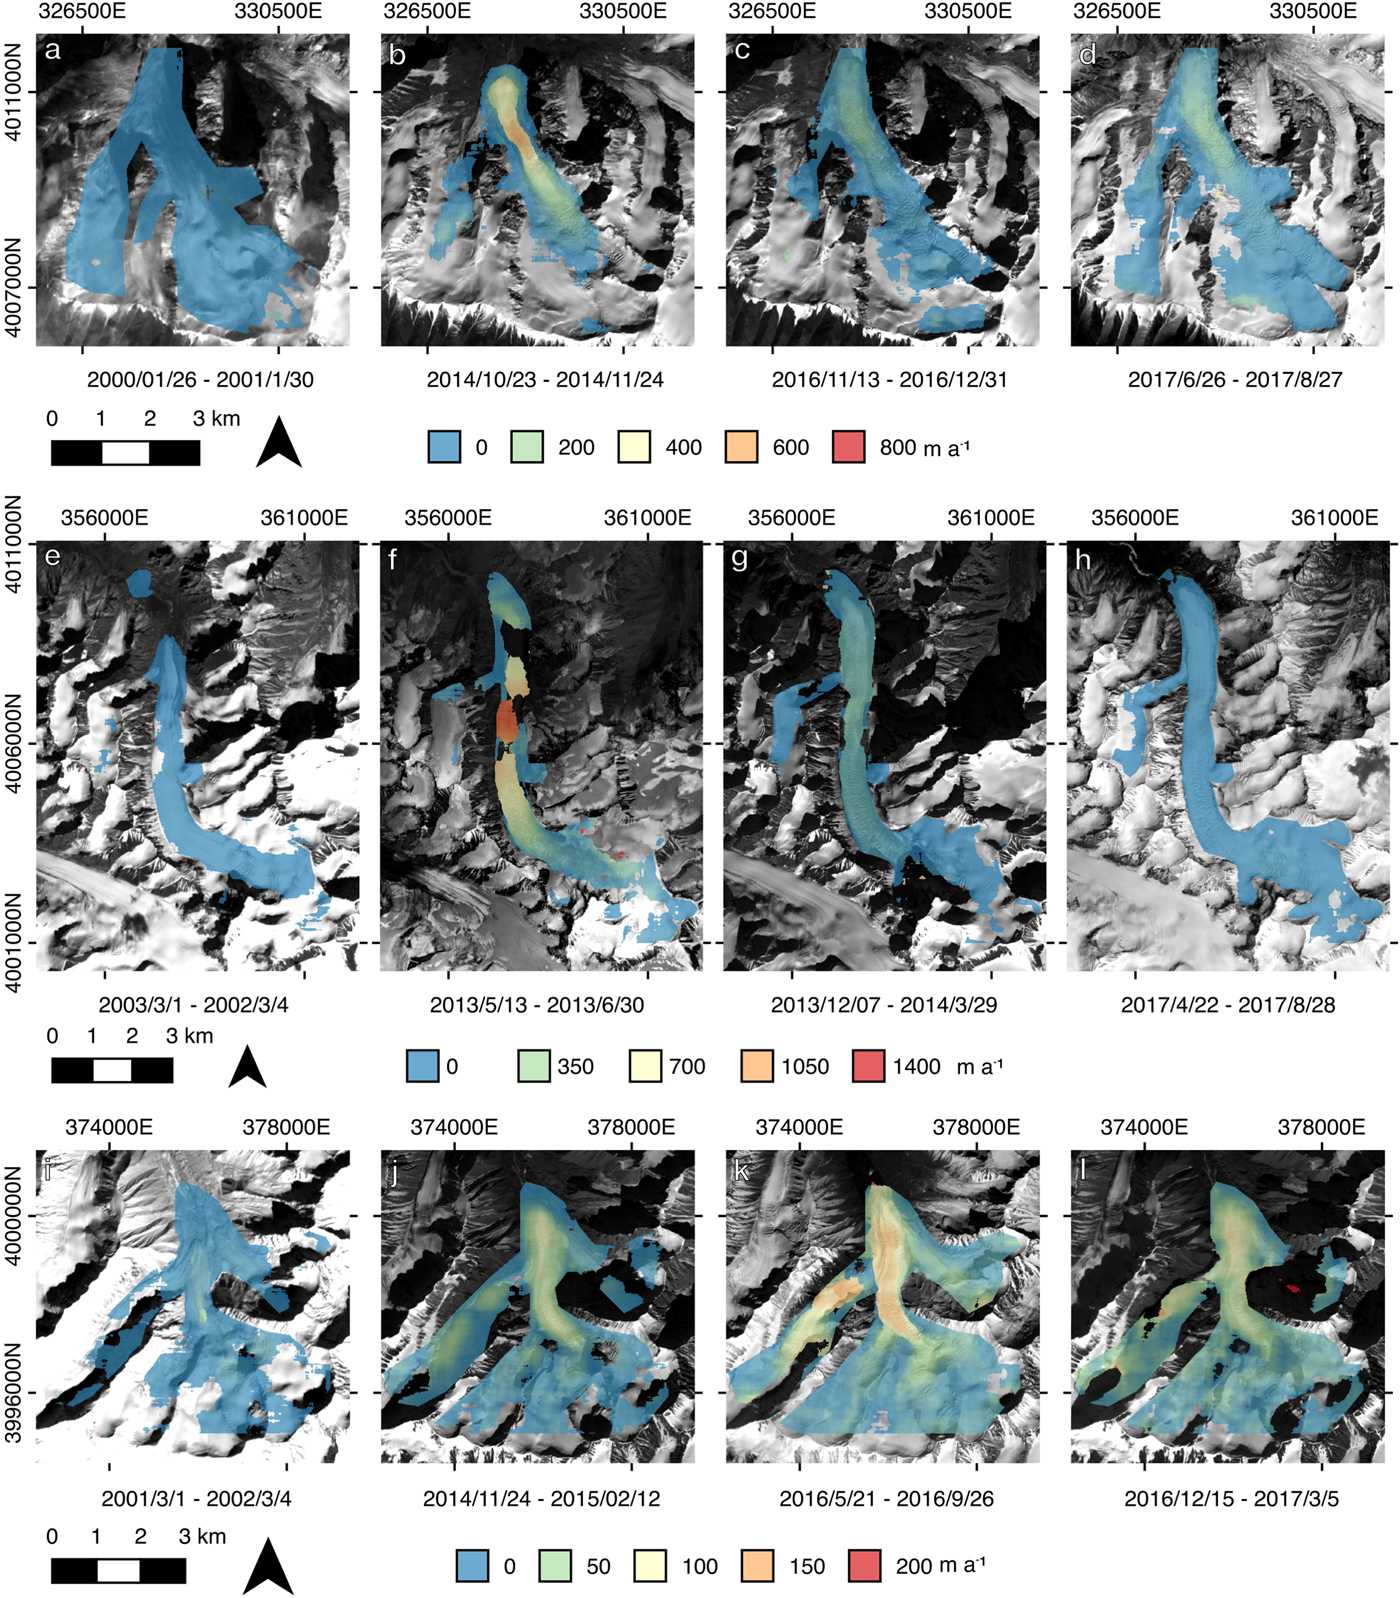
Fig. 5. Selected velocity fields for Glacier 1 (a–d), Glacier 3 (e–h) and Glacier 6 (i–l). Coordinates in UTM 44N.
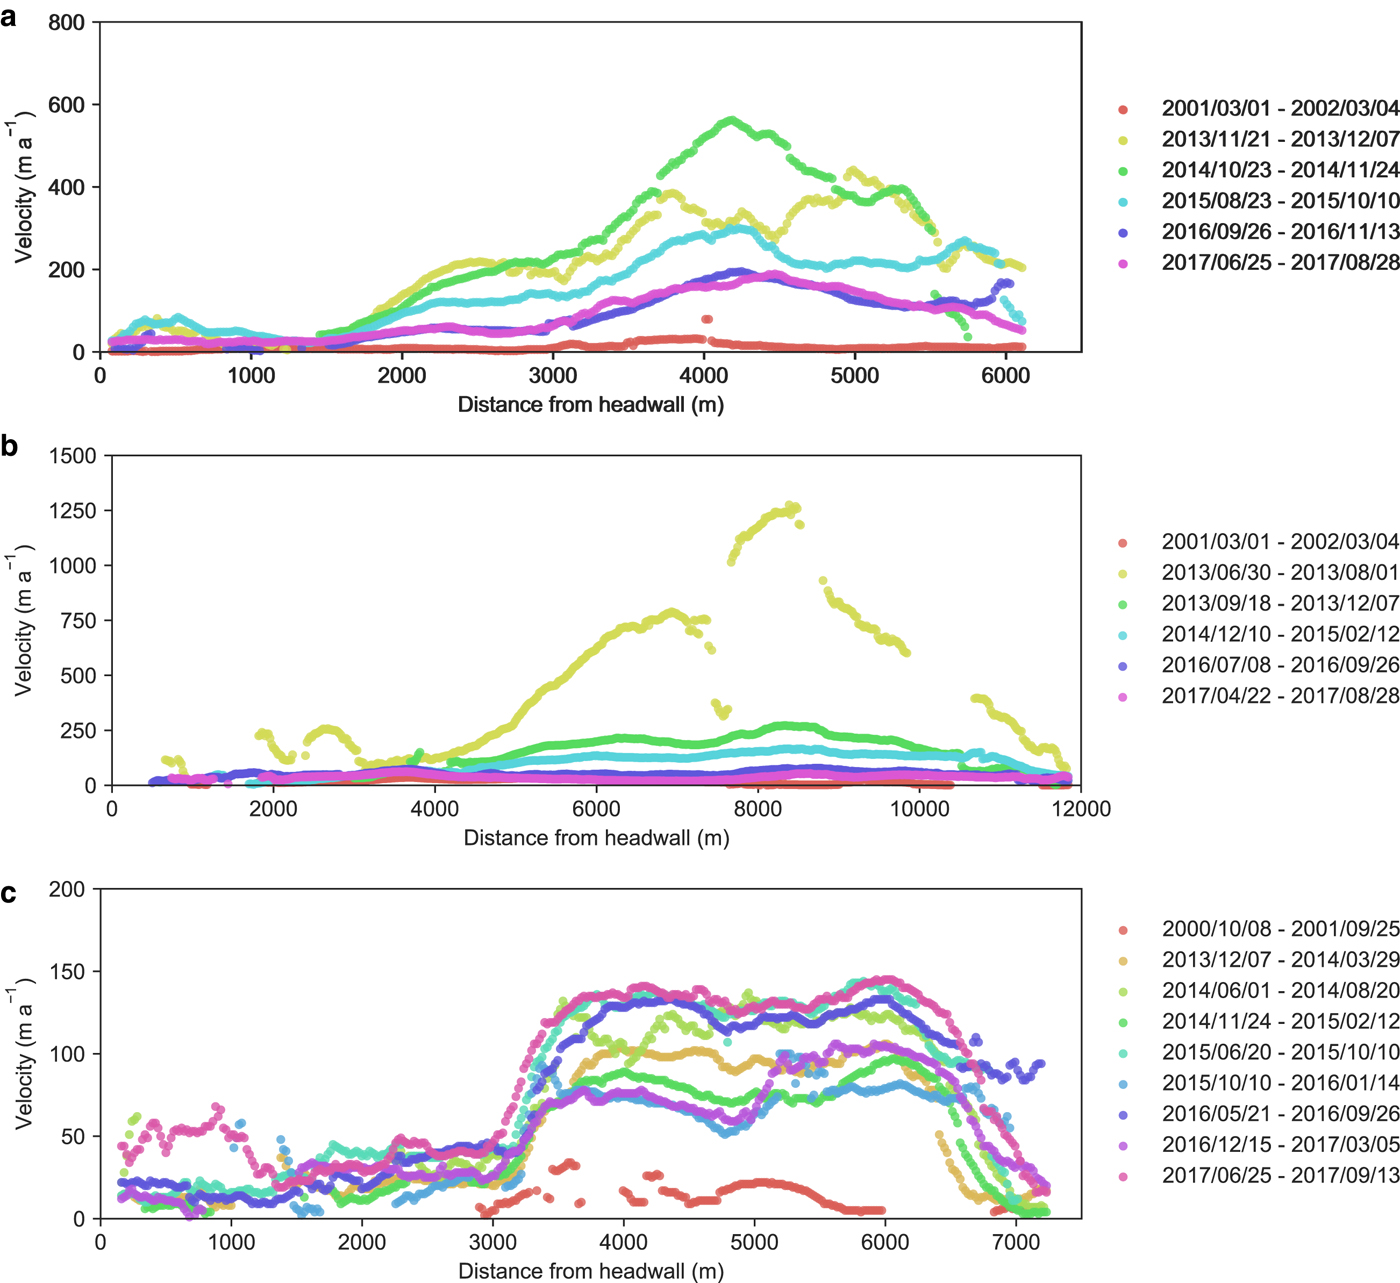
Fig. 6. Selected velocity transects for: (a) Glacier 1; (b) Glacier 3; and (c) Glacier 6. Route of transects are shown in Fig. 2.

Fig. 7. Mean observed glacier velocity in the fast flow zones of (a) Glacier 1 (3–5.5 km down flowline), (b) Glacier 3 (6–11 km down flowline) and (c) Glacier 6 (3.5–6.5 km down flowline).
Velocities during terminations are also variable between glaciers. The surge of glacier 3 terminates rapidly from its highest velocities (>1000 m a−1) observed between 13 May and 30 June 2013 (Fig. 5f, 6b) down to velocities <300 m a−1 in winter 2013/14 (Fig. 5g). From here, velocities continue to decline (Fig. 6b, 7b) until they have returned to levels comparable with quiescent phase values by summer 2017 (Fig. 5h). Terminus position data suggest that the surge of glacier 1 did not fully terminate in the observation period (Fig. 4), and the velocity time series data (Fig. 7a) show that glacier 1 does not undergo the same dramatic collapse in speeds as glacier 3. Instead, velocities reach an observed peak in winter 2014/15 (although given a lack of observations in summer 2014, velocities may have peaked in the summer). This is followed by a sustained monotonic decline that continues until winter 2016/17, and then a small increase in observed velocities through 2017 (Fig. 5). Velocities remain >100 m a−1 in the fast flow zone, still an order of magnitude greater than quiescent phase observations (Fig. 6a).
4.3. Climatic context
Prior long-term studies of HMA surge activity have previously proposed a potential link between increased or clustered surge activity (as observed here in the post-2006 period) and a changing climate. Proposed mechanisms include increased high-altitude warming (Hewitt, Reference Hewitt2007), and increased annual precipitation and decreasing summer temperatures (Copland and others, Reference Copland2011). The meteorological data in Figure 8 suggest an increase in temperature in all seasons across the region over the 1960–2016 period, with the 2006–10 interval, where surge activity is clustered, containing particularly high temperatures. Results of the non-parametric Mann-Kendall tests confirm that temperature increases across all seasons between 1960 and 2016 are statistically significant (Table S4). Examining the meteorological data in detail (Fig. 8) shows that the 2006–10 period, where surge activity is clustered, overlaps with a period of extremes in temperature in the region. This observation is not replicated in the precipitation data, for which a statistically significant increase in precipitation is observed only for regional averages in the summer only (p < 0.05 averaged across all stations; p < 0.10 for Hotan Station). Linear regression analysis shows that the statistically significant increases in temperature for the Hotan weather station are concentrated in the post-1986 period, with 1960–86 mean annual temperatures displaying no significant trend and post-1986 mean annual temperatures increasing at 0.05°C a−1 (Table S5). Furthermore, the temperature increases are focused in spring, summer, and autumn, rather than winter, with spring temperatures increasing at the highest rate (0.11°C a−1 between 1986 and 2016).

Fig. 8. Chinese Meteorological Administration meteorological station data 1960–2015, divided into seasonal means for the: (a) summer (JJA); (b) autumn (SON); (c) winter (DJF) and (d) spring (MAM). The black line marks the temperature data from the Hotan weather station, the nearest weather station to the study site and the grey line marks the regional average of six weather stations including Hotan. The 2006–10 period of interest is highlighted in grey. Station locations are given in Figure 1, and station information is given in Table S3.
5. DISCUSSION
Prior to this study, the work of Yasuda and Furuya (Reference Yasuda and Furuya2013, Reference Yasuda and Furuya2015) was the only reported study of surge dynamics in the WKS, identifying nine glaciers in the Liushi region. This study has identified an additional nine glacier surges from an 88-glacier sample from the north-west WKS located between the Liushi region and the Karakoram. Despite the high incidence of surging identified in these two studies, a lack of debris cover and moraines (i.e. geomorphic evidence of surges) make glaciers that have not actively surged in the satellite era difficult to identify. This means there are likely to be a number of false negative identifications, and that surge-type glaciers are even more numerous than reported. However, the fact that the surge incidence observed in this study is on par with that identified by Barrand and Murray (Reference Barrand and Murray2006) in the adjacent Karakoram suggests that we have not under-identified relative to other studies using the same method. The utilisation of additional data sources, such as declassified CORONA imagery, could extend records back into the 1960s, although if surge intervals approach centennial scales these may not reveal any further evidence of surging, and new evidence may not be uncovered until future active phases begin.
Given the additional surge-type glaciers identified in this study, it is apparent further work is needed to identify and characterise surging in the Kunlun Shan. No large-scale inventories are available analogous to those produced for the adjacent Karakoram (Copland and others, Reference Copland2011; Bhambri and others, Reference Bhambri, Hewitt, Kawishwar and Pratap2017), and the region is conspicuously absent from global geodatabases of surge activity (Sevestre and Benn, Reference Sevestre and Benn2015). Therefore, undocumented surge-type glaciers likely remain in other regions of the Kunlun Shan. Recent high-resolution radar interferometry-derived elevation change measurements clearly show a number of additional glacier surges between 2000 and 2014, yet to be documented fully, that lie between our study region and the Liushi region (Lin and others, Reference Lin, Li, Cuo, Hooper and Ye2017), and the surge of Yulinchuan Glacer at Ulugh Muztagh in the Central/East Kunlun Shan (Guo and others, Reference Guo, Liu, Wei and Bao2013) suggests that the conditions suitable for surging may continue to exist east of the Liushi region. Continuing to build a database of surge-type glaciers in the range is particularly important, given recent reports of apparently stable glaciers (an extension of the ‘Karakoram Anomaly’) extending into the WKS (Kääb and others, Reference Kääb, Treichler, Nuth and Berthier2015; Cogley, Reference Cogley2016; Brun and others, Reference Brun, Berthier, Wagnon, Kääb and Treichler2017). Given that surge activity can be a complicating factor in aggregate measures of both area change (Shangguan and others, Reference Shangguan2009; Bhambri and others, Reference Bhambri2013; Cogley, Reference Cogley2016) and surface elevation change (Gardelle and others, Reference Gardelle, Berthier, Arnaud and Kaab2013; Kääb and others, Reference Kääb, Treichler, Nuth and Berthier2015; Brun and others, Reference Brun, Berthier, Wagnon, Kääb and Treichler2017), a full and accurate database of surge activity in the WKS would be useful for contextualising such measurements.
As with other studies in surrounding areas of the Karakoram and WKS (Quincey and others, Reference Quincey, Glasser, Cook and Luckman2015; Yasuda and Furuya, Reference Yasuda and Furuya2015; Bhambri and others, Reference Bhambri, Hewitt, Kawishwar and Pratap2017), the surge characteristics observed here are highly heterogeneous, and it is difficult to classify the surges straightforwardly into either the hydrological or the thermal models of surging. Much initial evidence points towards thermal surging. First, surge phase glacier velocities range between 0.2 and 1.5 km a−1, a figure higher than the very slow thermal surging velocities of small glaciers in Yukon (Frappé and Clarke, Reference Frappé and Clarke2007; Flowers and others, Reference Flowers, Roux, Pimentel and Schoof2011) but more in line with the moderately fast thermal surging in Svalbard (Murray and others, Reference Murray, Strozzi, Luckman, Jiskoot and Christakos2003) than with rapid hydrological surge velocities which can reach in excess of 20 km a−1 (Kamb and others, Reference Kamb1985). Second, the asymptotic shapes of the terminus advance data (Fig. 4) suggests that glaciers display a months-, or even years-long buildup phase prior to the main active phase, and a similarly extended surge termination period. The length of time it takes to initiate and terminate the active phase period is suggestive of a thermal model of surging. These characteristics have previously been reported elsewhere in HMA, and have been suggested to conflict with the hydrological model (Mayer and others, Reference Mayer, Fowler, Lambrecht and Scharrer2011; Quincey and others, Reference Quincey, Glasser, Cook and Luckman2015), where a much shorter transition period between the dominance of low-pressure channelised drainage and high-pressure distributed drainage would be expected. The velocity data support this conclusion: glacier 1 displays a monotonic decline in surface velocity over multiple years, and even glacier 3, which shows a collapse in velocity between summer 2013 and winter 2013/14, takes 3 further years to return to pre-surge velocities. Finally, considering the wider context of the range, a thermal surge would also align with the consensus that glaciers in the WKS are cold or polythermal (Shi and Liu, Reference Shi and Liu2000; Bao and others, Reference Bao, Liu, Wei and Guo2015).
However, there are also surge characteristics observed in this study that align with previously reported surge behaviour linked to the hydrological mechanism. First, incidental evidence from the oldest satellite imagery suggests that at least some return periods are of the order of several decades, in line with observations of hydrologically induced surging (Björnsson and others, Reference Björnsson, Pálsson, Sigurdsson and Flowers2003; Eisen and others, Reference Eisen2005). Second, although the period of time from the start of the pre-surge buildup to the end of the post-surge deceleration lasted for up to 8 years for the glaciers present in this study, the active phases appear to be short: in particular, glacier 3 appears to undergo the majority of rapid terminus advance in only 2 years (2011–13). This time period aligns with that associated with hydrologically-induced surging glaciers. However, this behaviour is not universal: the surges that have not yet terminated have been advancing for periods >5 years. Finally, glaciers 3 and 6 displays increase in observed velocity during the summer months. This has been similarly observed for surge-type glaciers in the Karakoram (Mayer and others, Reference Mayer, Fowler, Lambrecht and Scharrer2011; Quincey and others, Reference Quincey, Glasser, Cook and Luckman2015; Round and others, Reference Round, Leinss, Huss, Haemmig and Hajnsek2017; Usman and Furuya, Reference Usman and Furuya2018). Seasonal variations in velocity are indicative of an active subglacial hydrological system, and as such should be indicative of a hydrological surge.
It is apparent that no single classical model of surging describes the observations reported here. However, the behaviour we observe aligns with that from other studies of surging glaciers in the surrounding ranges. Contrasting evidence of thermal and hydrological controls on surge initiation is a common theme reported in studies of Karakoram surge-type glaciers, ~250 km west-southwest of the study area (Mayer and others, Reference Mayer, Fowler, Lambrecht and Scharrer2011; Quincey and others, Reference Quincey2011, Reference Quincey, Glasser, Cook and Luckman2015). Glacier velocities of the order of 1 km a−1 align well with observations from both the Liushi region of the WKS (Yasuda and Furuya, Reference Yasuda and Furuya2015) and the Karakoram (Mayer and others, Reference Mayer, Fowler, Lambrecht and Scharrer2011; Quincey and others, Reference Quincey, Glasser, Cook and Luckman2015; Bhambri and others, Reference Bhambri, Hewitt, Kawishwar and Pratap2017; Paul and others, Reference Paul, Strozzi, Schellenberger and Kääb2017). The potential for decadal-scale return periods also is comparable with that for Karakoram glaciers, where surge periods have been reported to be anywhere between 8 and 90 years (Bhambri and others, Reference Bhambri, Hewitt, Kawishwar and Pratap2017). As in previous studies of both the Karakoram and WKS, accelerations occur in the lower regions of the glaciers (Quincey and others, Reference Quincey2011; Yasuda and Furuya, Reference Yasuda and Furuya2015), although with a lack of velocity data covering the initiation of the surges we are unable to comment on: (i) the seasonality, if any, of surge initiation; and (ii) whether the accelerations were in the form of a progressing surge front down glacier or more spatially uniform acceleration across the glacier. Both have been observed in the Karakoram (Quincey and others, Reference Quincey, Glasser, Cook and Luckman2015).
There are two primary differences between the surge glaciers explored here and those in comparable studies in adjacent ranges. First, although surge-type glaciers here are among the larger glaciers in the study sample (e.g. trunk glaciers, large valley glaciers), they are still smaller than surge-type glaciers in adjacent studies. With lengths ranging from 4.7 to 10.3 km and areas ranging from 3.5 to 17.0 km2, glaciers in this study are much smaller than those in other studies – for instance, lengths of 9.5–40.5 km are identified in the Karakoram (Quincey and others, Reference Quincey, Glasser, Cook and Luckman2015), and 18.5–23.4 km in the Liushi region of the WKS (Yasuda and Furuya, Reference Yasuda and Furuya2013) – although Bhambri and others (Reference Bhambri, Hewitt, Kawishwar and Pratap2017), with reported lengths of 1.9–70.0 km and areas of 0.4–807.3 km2, include surge-type glaciers with far smaller areas than our study as well as far larger. As all the glaciers in our study region are relatively small, we suggest that some surges in HMA risk being overlooked if the focus remains solely on regions with the largest trunk glaciers.
Second, the surge dynamics observed here display some differences from those reported for the WKS Liushi region (Yasuda and Furuya, Reference Yasuda and Furuya2015), despite the close proximity of the two regions. Surging glaciers in both regions display a seasonality to active phase velocities, indicative of hydrological control. However, the pattern of seasonality differs between the studies. Yasuda and Furuya (Reference Yasuda and Furuya2015) observe that surge-type glaciers in the active phase display a typical winter acceleration and subsequent summer deceleration as observed for hydrologically surging glaciers (Kamb and others, Reference Kamb1985). This contrasts with the velocity record from glaciers 3 and 6 which instead display distinct summer accelerations during the surge phase (note that these annual accelerations are distinct from the seasonality of the surge initiation, which we cannot derive in this study). This aligns with observations of surging glaciers in the Karakoram (Mayer and others, Reference Mayer, Fowler, Lambrecht and Scharrer2011; Quincey and others, Reference Quincey, Glasser, Cook and Luckman2015; Round and others, Reference Round, Leinss, Huss, Haemmig and Hajnsek2017): Quincey and others (Reference Quincey, Glasser, Cook and Luckman2015), in particular, noted the contrast with behaviour expected from hydrologically surging glaciers.
Looking at the temporal distribution of surge activity, seven of the nine surge events occur after 2006 (Table 2), very late into the observational period. This resembles surge studies in the adjacent Karakoram that have identified an increase in surge activity since the late 20th century (Hewitt, Reference Hewitt2005, Reference Hewitt2007, Reference Hewitt2014; Copland and others, Reference Copland2011), which could not be attributed in an increasing satellite observational capacity (Copland and others, Reference Copland2011). Studies provide different hypotheses as to the source of this apparent increase in surge activity: Hewitt (Reference Hewitt2007) argues that increases in surge incidence in the Panmah basin were related to increased melting at high altitudes, forced by long-term warming, which would affect glacier thermal regimes. In contrast, Copland and others (Reference Copland2011) propose that an increase in surge activity is a response to positive mass balances in the Karakoram, following a long-term increase in annual precipitation and decrease in summer temperatures since the 1960s. The Mann-Kendall analysis presented in this study found a positive trend in temperatures between 1960 and 2016, and the linear regression analysis shows that this change is concentrated in the post-1986 period; and focused in the spring, summer and autumn months. These observations validate previous climatological studies that have found the southern Xinjiang climate to be shifting to a warmer state (Chen and others, Reference Chen, Takeuchi, Xu, Chen and Xu2006; Shi and others, Reference Shi2007; Peng and others, Reference Peng2014). Thus, the fact that climate changes are predominantly present in the form of warmer temperatures, rather than increased precipitation, support the hypotheses of Hewitt (Reference Hewitt2007), relating to long-term warming, over Copland and others (Reference Copland2011), relating to increases in mass balance. However, a limitation of these climate data analyses is that climate data for the specific study area is unavailable, and broader regional trends are inferred from data collected at lower elevations.
Finally, we note that the surges of glaciers 1–7 all begin between 2006 and 2010 (Table 2). This is noteworthy considering that surging is classically understood to be an internally-driven phenomenon operating independently of external forcing (Meier and Post, Reference Meier and Post1969; Sharp, Reference Sharp1988). It is also notable that the nearest observed surge-type glaciers to the study area (the West Kunlun and ‘N2’ glaciers, ~100 km to the southeast) also began surging in 2008 (Yasuda and Furuya, Reference Yasuda and Furuya2015). A precedent for a sudden concentration in surge observations exists in the tributaries of Panmah Glacier in the Karakoram, where three tributary glaciers surged in quick succession between 2001 and 2005 (Hewitt, Reference Hewitt2007). As with our study, these glaciers were not contiguous, and historic imagery did not suggest that the glacier surge cycles were previously in phase. Hewitt (Reference Hewitt2007) suggested that intense, short-term melting episodes could act to accelerate surge cycles in this context. Quincey and others (Reference Quincey2011) suggested also that recent surges in the Karakoram could have been triggered by an upward shift in thermal conditions, regulated by climate changes. Given the climate data presented here, and, in particular, the peak in temperatures reached in the 2000s (Fig. 8), these hypotheses may also be applicable to our study region. Hence, on top of the long-term warming influence outlined above, it is possible that the concentration of surging found across our study region could have occurred because the glaciers responding to short-term increases in surface temperature, although a lack of further ground data for the region limits any further inferences, particularly of any causal mechanism. The glaciers in this study may provide a useful additional case study for any future studies investigating possible links between climate change and HMA surging.
Although the dynamics of surging across HMA remain debated and currently cannot be explained by one of the classic models alone, the surge characteristics observed in this study display marked similarities to those in the Karakoram, in terms of both their dynamics (Quincey and others, Reference Quincey, Glasser, Cook and Luckman2015) and their pacings and potential links to climate (Hewitt, Reference Hewitt2007; Quincey and others, Reference Quincey2011). We recommend that glaciers in the WKS should be considered part of the same dynamic regime as the Karakoram when considering surge-type glaciers in HMA. Glaciers in the WKS, together with those in the Karakoram, likely have a continued role to play in better understanding surge dynamics in HMA.
6. CONCLUSIONS
Our observations have expanded the record of surging in the notably under-researched WKS. We identify an additional nine surge-type glaciers (constituting 10% of glaciers in the study site), seven of which occurred in the last decade and allow for detailed assessments of glacier dynamics using a combination of terminus position and feature-tracked velocity data. Glaciers in the study display relatively low active phase velocities (~0.2–1.5 km a−1) that accelerate in the summer, active phase periods as short as 2 years (but with some glaciers still surging after more than 5 years), and buildup and deceleration phases of months-years. Although these observations display characteristics indicative of both the classic hydrological and thermal switch mechanisms, WKS surging displays a very close resemblance to surges in the adjacent Karakoram, and we suggest that the two systems should be considered part of one larger regime when discussing surge dynamics in HMA. This is particularly true if the pacing of surging in our study is linked to the climate, as has been suggested for the Karakoram. Given the paucity of surge dynamic studies in the WKS, and our finding that surging occurs in glaciers that are much smaller than those typically reported in previous studies from HMA, the WKS likely still has a number of surging glaciers that have not yet been identified, and we suggest that there remains a continued role for exploratory remote-sensing studies of surging glaciers in the area. A better understanding of surging in the West Kunlun Shan will be of value in the ongoing effort to better understand the surge dynamics of High Mountain Asia.
SUPPLEMENTARY MATERIAL
The supplementary material for this article can be found at https://doi.org/10.1017/jog.2018.94
ACKNOWLEDGMENTS
TRC acknowledges the support of Masters studentships provided by the Isaac Newton Trust and Downing College, Cambridge and a Natural Environment Research Council Doctoral Training Partnership Studentship (Grant number: NE/L002507/1). We are grateful to Shiyin Liu, who provided meteorological station data from the Chinese Meteorological Administration, and to Masato Furuya and a second anonymous reviewer, whose comments greatly improved the manuscript.
AUTHOR CONTRIBUTIONS
T.R.C. designed the study and conducted the analysis. Both authors contributed to discussions, interpretations and writing the paper.


 Open access