


1. Introduction
The Antarctic Ice Sheet (AIS) is the world's biggest reservoir of fresh water in the solid state. Degradation of the AIS is the largest and most uncertain potential contributor to the future rise in sea level. The range of 21st-century sea level rise projections for AIS by Sixth Assessment Report of the Intergovernmental Panel on Climate Change (IPCC) varied in the wide range from 0.04 to 0.34 m (Fox-Kemper and others, Reference Fox-Kemper and Masson-Delmotte2021). Even though the main AIS losses come from ice shelf basal melt and ice shelf disintegration of the West Antarctic Ice Sheet (WAIS), parts of the East Antarctic Ice Sheet (EAIS) have significantly lost mass over the last 20 years (Rignot and others, Reference Rignot2019).
Studying and measuring ice-sheet basal conditions is a challenging task, and of all parameters affecting ice-sheet dynamics and melting at the base, geothermal heat flow (GHF) is one of the key factors (Llubes and others, Reference Llubes, Lanseau and Rémy2006; Burton-Johnson and others, Reference Burton-Johnson, Dziadek and Martin2020). Although modern studies of Antarctic GHF widely employ models based on geophysical methods (variations in Antarctic GHF models are discussed by Reading and others, Reference Reading2022), direct observation by drilling is still considered the only valid method to verify the expectation hypothesis (Burton-Johnson and others, Reference Burton-Johnson, Dziadek and Martin2020). However, local GHF values from the boreholes may not be representative of the regional averages, as local geology, hydrothermal circulation and topographic effects can result in localized heat flow variability. Thus, direct validation of thermal modeling and geological–geophysical studies would require drilling of a grid of holes, which is extremely complicated, time-consuming and expensive. Such field research should be combined with the careful study of subglacial context at each drilling site.
Until now, only a few GHF estimates have been made from the borehole temperature measurements in the ice-free areas (Risk and Hochstein, Reference Risk and Hochstein1974; Decker and Bucher, Reference Decker and Bucher1982), and none have been made from subglacial bedrock boreholes (Burton-Johnson and others, Reference Burton-Johnson, Dziadek and Martin2020). The GHF can be estimated from ice boreholes that do not reach bedrock using different estimation models (Dahl-Jensen and others, Reference Dahl-Jensen, Morgan and Elcheikh1999; Zagorodnov and others, Reference Zagorodnov2012; Mony and others, Reference Mony, Roberts and Halpin2020; Talalay and others, Reference Talalay2020). Furthermore, in the EAIS penetrating to the only upper 20% of the total ice-sheet thickness may be enough to determine the GHF with sufficient accuracy for many practical applications (Hindmarsh and Ritz, Reference Hindmarsh and Ritz2012). In this paper, we present GHF estimations from direct measurements of temperature in a borehole drilled in the margin of the Princess Elizabeth Land (EAIS).
2. Methods
The Jilin University (JLU) drilling site (69°28.18'S 076°20.79′E; 306 m a.s.l.) is located in the northwestern marginal part of Princess Elizabeth Land, ~12 km south of Zhongshan Station (Fig. 1). The borehole was drilled using an electromechanical cable-suspended IBED drill with drill head having an outer diameter of 136 mm, in January–February 2019 (Talalay and others, Reference Talalay2021). Drilling resulted in 198.8 m long continuous ice core and 6 cm of bedrock core containing metamorphosed gneiss. The ice sheet is solidly frozen to a rock-bed.

Figure 1. Google Earth satellite image of the area near Zhongshan Station in the margin of the Princess Elizabeth Land (East Antarctic Ice Sheet), ground-penetrating radar profile (left inset) through JLU drilling site obtained via ‘Snow Eagle’ airborne radar servicing (ice thickness at the drilling site determined by radar measurements is 196.4 m) and map of Antarctica (right inset), showing the location of the JLU drilling site.
In February 2022, the temperature profile was measured using a battery-powered portable temperature recorder (SSN-23E) with a measuring temperature range of −40 to +125°С and measurement accuracy of ±0.3°С (Fig. 2). A delay of ~3 years between drilling and temperature measurement is sufficient for the thermal disturbance from the drilling to dissipate. The liquid level in the borehole was at ~60 m. The recorder can collect temperature data according to the set time interval and store it in the recorder. The stored temperature data can be read using a computer after recovery. A single battery can support the continuous acquisition of 16 000 sampling points. If the sampling interval is set to 2 min, a single battery can support the continuous operation of the recorder for ~22 days. The thermal equilibration of the sensor took ~20–30 min in the borehole. To obtain more reliable data, measurements at each depth were taken during 1–2 h. The temperature was measured at each meter for the first 69 m and at each 2 m deeper than 69 m. To prevent the surface airflow from interfering with the temperature data in the hole, the borehole mouth was closed with a cover plate. Unfortunately, the temperature recorder could only be lowered to a depth of 97 m (~50% of the ice-sheet thickness) because an ice plug ultimately prevented the lowering of the instrument. The attempt to remove this ice plug by melting it with a hotpoint with an outer diameter of 50 mm was unsuccessful.
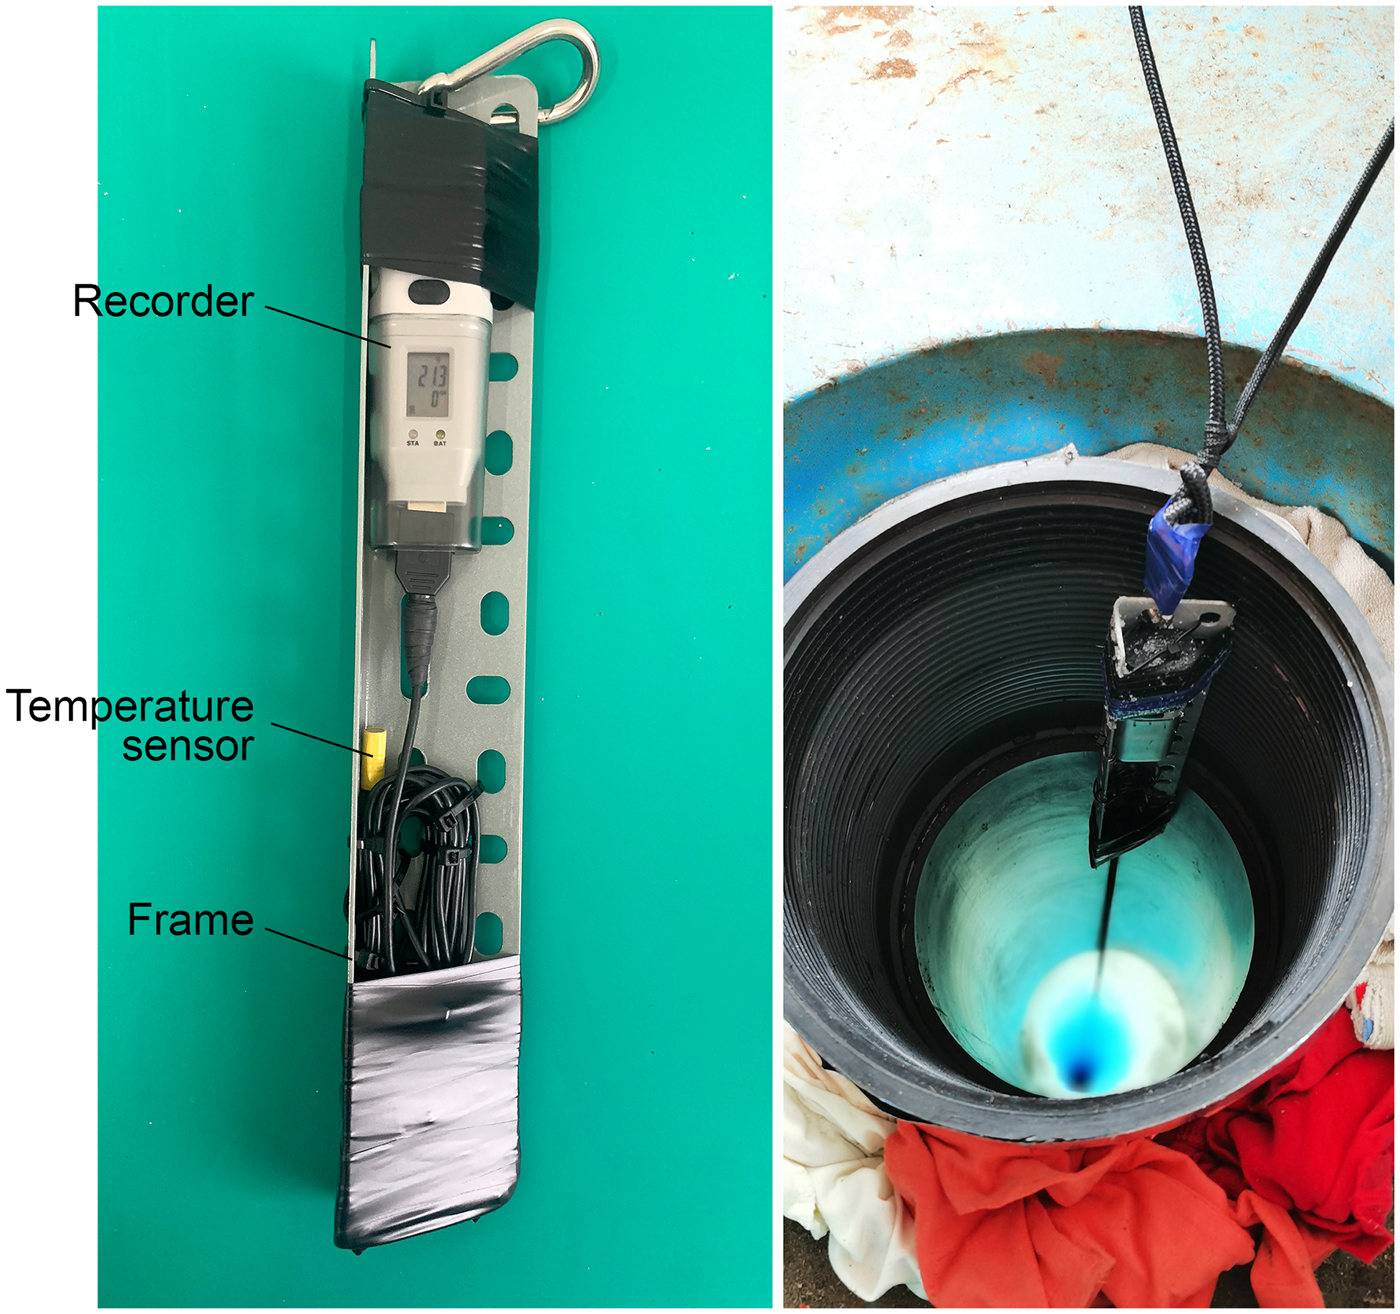
Figure 2. Temperature sensor (on the left) and temperature measurement in the JLU borehole.
To extrapolate the ice temperature profile, a 1-D time-dependent energy-balance equation can be adopted by neglecting horizontal advection and horizontal heat conduction (Johnsen and others, Reference Johnsen, Dahl-Jensen, Dansgaard and Gundestrup1995; Dahl-Jensen and others, Reference Dahl-Jensen, Gundestrup, Gogineni and Miller2003). During the 3 years between drilling and logging, the borehole mouth moved 34 m, which corresponds to a surface horizontal velocity of only 11.3 m a−1. Thus, as a preliminary estimation, the ice flow and heat convection at the JLU drilling site were assumed to be in a steady state. Consequently, the time-dependent energy-balance equation was reduced to a steady-state form. A genetic algorithm (GA) to solve the energy-balance equation using MATLAB was developed for GHF estimation by fitting the measured ice borehole temperature (Talalay and others, Reference Talalay2020). In the calculations, we used the widely adopted expression for ice thermal conductivity introduced by Yen (Reference Yen1981), which is a function of ice temperature.
We performed five runs to estimate the GHF with form factors of m = 0, m = 0.25, m = 0.5, m = 0.75 and m = 1.0. Each run was repeated five times to eliminate random errors generated by GA. A total of 25 models were required to fit the measured ice temperatures in the upper 97 m. In our fitting, the temperature of the lower ice with thickness slightly over 100 m was extrapolated. At the JLU drilling site, the ice age scale is unknown, and it cannot be used to constrict the best-fitting value of m. Consequently, the GHF was chosen as the average of all the estimated GHF in each model with different m by extrapolating the ice temperature to the ice bed.
The calculating method of the uncertainty is the same as what we presented in our previous work (Talalay and others, Reference Talalay2020). The uncertainty comes from the surface temperature, surface accumulation rate, basal temperature gradient, the form factor m and GA itself, as well as some neglected factors in the assumptions, such as the transient effects associated with climate change and ice-sheet dynamics, the horizontal velocity field, the temperature dependence of the thermal conductivity and error of temperature measurement. In our fitting, the four factors of surface temperature, surface accumulation rate, basal temperature gradient and the form factor m have been contained in the GA. In result, the uncertainty led by the four factors and GA itself are given as the error of the fitting.
3. Results and discussion
From the ice surface to a depth of ~8 m, greater than the likely extent of non-zero annual temperature variation, the temperature gradient in the borehole is negative (Fig. 3). Further down, the measured temperature profile increases with depth almost linearly with an average gradient of 3.39°C/100 m, indicating that the temperature field is quite steady and vertical velocities are small. By extrapolating the ice temperature to the ice bed, we calculated that at the base of the ice sheet, the GHF is 72.6 ± 2.3 mW m−2 and temperature is −4.53 ± 0.27°C. The regional averages estimated for this area are 55–60 mW m−2 based on geophysical data and models (An and others, Reference An2015; Martos and others, Reference Martos2017) and between 60 and 66 mW m−2 using the multivariate approach with higher spatial resolution (Lösing and Ebbing, Reference Lösing and Ebbing2021; Stål and others, Reference Stål, Reading, Halpin and Whittaker2021). All estimations are typical for Mesoproterozoic–Neoproterozoic terrains developed on the Princess Elisabeth Land (Mikhalsky and Leitchenkov, Reference Mikhalsky and Leitchenkov2018). The increased surface heat flow within ancient ice-covered crystalline shields, similar to those in East Antarctica, may be attributed to basal friction, thermal-refractive effects at subglacial boundaries, neotectonics (e.g. hydrothermal heat transfer) and rock composition below the ice (Willcocks and others, Reference Willcocks, Hasterok and Jennings2021; Reading and others, Reference Reading2022).

Figure 3. Measured borehole temperature (red dots) and best-fit temperature profile.
Almost all these phenomena are thought to be insignificant in relation to their influence on the heat flow measured in an ice borehole. Basal friction is negligible in the area of drilling because of the low temperature at the base of ice (well below the melting point) and low ice flow velocity. Refracted heat (Willcocks and others, Reference Willcocks, Hasterok and Jennings2021), arising in concave morphological features and basins that locally focus temperatures, is not considered because the bedrock topography at the site is actually flat (Fig. 1, left inset). Depressions are developed 3 km to the east and to the south below the Dålk outlet glacier and possibly its tributary. Sedimentary rocks that can affect the GHF are most likely absent under the ice in the area of the drilling site because they have not been found anywhere on the nearby coastal outcrops in western Princess Elizabeth Land (Carson and Grew, Reference Carson and Grew2007; Mikhalsky and Leitchenkov, Reference Mikhalsky and Leitchenkov2018). Neotectonic crustal activation in the stable East Antarctica Shield can be caused by isostatic rebound during ice-age cycles and can contribute locally to heat production through, for instance, hydrothermal activity; however, it is nowhere established in the coastal areas of East Antarctica. The total subglacial GHF is the sum of heat from the mantle and radiogenic heat from the crust. High surface heat flow, if observed in ancient terrains, is dominated by heat production from heat-producing elements (HPE) – uranium, thorium (mainly) and potassium, which are concentrated in geological complexes mostly in the upper continental crust (Carson and Pittard, Reference Carson and Pittard2012; Sanchez and others, Reference Sanchez2021). Continental-scale forward models of the GHF based on geophysical data do not consider crustal radiogenic contributions from local geological features in the upper continental crust that may have a significant addition to the total GHF (Carson and others, Reference Carson, McLaren, Roberts, Boger and Blankenship2014). The GHF calculated in the drill hole is greater than GHF estimates from all previous studies (An and others, Reference An2015; Martos and others, Reference Martos2017; Lösing and Ebbing, Reference Lösing and Ebbing2021; Stål and others, Reference Stål, Reading, Halpin and Whittaker2021) and so the relatively high value indicates the effect of local scale length and local context.
The coast of Princess Elizabeth Land shows several places (oases) with relatively well-outcropped geological complexes (Fig. 4) that have been studied for the concentration of HPE in rocks (Carson and Pittard, Reference Carson and Pittard2012; Carson and others, Reference Carson, McLaren, Roberts, Boger and Blankenship2014). These studies showed that the predominant Proterozoic metamorphic rocks in western Princess Elizabeth Land have a low concentration of HPE with median heat production values of ~2 μW m−3 and little contribution to the total GHF. However, metamorphic complexes are widely intruded by HPE-enriched Cambrian granites (Mikhalsky and Leitchenkov, Reference Mikhalsky and Leitchenkov2018) which show heat production ranging between 4 and 65 μW m−3 (26 determinations; Carson and Pittard, Reference Carson and Pittard2012). These rocks can have a strong influence on the heat flow, with estimated average values of 80–90 mW m−2 and maximum values up to 120 mW m−2 (Carson and others, Reference Carson, McLaren, Roberts, Boger and Blankenship2014). The increased heat flow measured in the drill hole is well explained by the occurrence of such rocks in the subglacial bedrock (upper crust) below the drilling site. Gneisses sampled by drilling from the bedrock and corresponding to the Proterozoic complexes exposed on the Larsemann Hills do not contradict this conclusion. These gneisses may represent host rocks in the vicinity of the granite intrusion or xenoliths within the intrusion, similar to those observed in the eastern part of the Larsemann Hills, where the granites and host rocks have been well studied and mapped in detail (Carson and others, Reference Carson, Fanning and Wilson1996).

Figure 4. Distribution of Cambrian HPE-enriched granitic intrusions (red circles) in the northwestern Princess Elizabeth Land; brown-colored areas are outcrops composed of Proterozoic metamorphic rocks with low concentration of HPE.
This study allowed to estimate GHF at the single site in the margin of the Princess Elizabeth Land, ~12 km south of Zhongshan Station, and compare with GHF models which used geophysical approaches. Estimated GHF is higher than the regional averages for this area what can be explained by the occurrence of metamorphic complexes intruded by HPE in the subglacial bedrock. It is obvious that estimated GHF for the given location cannot be considered as representative value for the entire area around the drilling site. Nevertheless, we believe that our estimations have a considerable scientific value for improving predictions of the bedrock thermal state in the study area.
Acknowledgements
This research was funded by grants from the National Natural Science Foundation of China (Nos. 41941005 and 41906192). We thank CHINARE for logistical and financial support of field operations in Antarctica. This work would not have been completed without the continuous support and valuable help of Jingxue Guo and Xu Yao, the leaders of Zhongshan Station. We are grateful to Zhe Li and Wenbi Xie for their help with temperature measurements in the JLU borehole. We are also grateful to the ‘Snow Eagle’ aircraft team members, Xiaosong Shi, Xiangbin Cui, Changwei Hou, Xiaowen Liao, Gan Su, Duanran Zhao, Qingzhong Yao, Gang Qiao, Lin Li and Yukai Zhao, for providing ground-penetrating radar profile through JLU drilling site. We also thank reviewers, Anya M. Reading, Mareen Lösing and anonymous reviewer for fruitful comments and advice.


 Open access