


1. INTRODUCTION
Since Mercer's (Reference Mercer1978) paper heralding the threat of sea-level rise from a collapsing West Antarctic ice sheet, glaciologists have sought to characterise how Antarctica's ice shelves, which buttress the ice sheet, respond to rising air and ocean temperatures. Recent observations show that surface meltwater is pervasive around the ice sheet (Kingslake and others, Reference Kingslake, Ely, Das and Bell2017) and its presence is predicted to increase with future climate change (Trusel and others, Reference Trusel2015; Bell and others, Reference Bell, Banwell, Trusel and Kingslake2018). In sufficient quantities, meltwater on ice shelves can promote ice-shelf instability, as evidenced by the behaviour of ~3000 meltwater lakes on the surface of the Larsen B Ice Shelf prior to its collapse in 2002 (Glasser and Scambos, Reference Glasser and Scambos2008; Banwell and others, Reference Banwell2014). This has led to the notion that meltwater-driven hydrofracture (Scambos and others, Reference Scambos, Hulbe, Fahnestock and Domack2003, Reference Scambos2009) and flexure (Banwell and others, Reference Banwell, MacAyeal and Sergienko2013) can be strong destabilising factors for ice shelves. Studies of meltwater-induced flexure have focused on forcing by surface lake filling and drainage (Banwell and others, Reference Banwell, MacAyeal and Sergienko2013; Banwell and MacAyeal, Reference Banwell and MacAyeal2015) and movement of surface meltwater (Banwell and others, Reference Banwell, Willis, Macdonald, Goodsell and MacAyeal2019). Ice-shelf flexure may also be forced by ocean tides (Vaughan, Reference Vaughan1995; Walker and others, Reference Walker2013; Rack and others, Reference Rack, King, Marsh, Wild and Flordicioiu2017), swell (Massom and others, Reference Massom2018) and other processes such as basal crevassing (McGrath and others, Reference McGrath2012) and ice flow over grounding lines (Walker and others, Reference Walker2013). Here we propose that large spatial contrasts in surface ablation rates, which lead to contrasting and evolving hydrostatic buoyancy forces, may also have an effect on ice-shelf flexure, and therefore ice-shelf stability.
Previous studies of ice-shelf surface hydrology and mass balance have focused on relatively ‘clean’ (debris-free) Antarctic and Greenlandic ice shelves, such as Larsen B (Banwell and others, Reference Banwell2014), Larsen C (Bevan and others, Reference Bevan2017), Langhovde Glacier (Langley and others, Reference Langley, Leeson, Stokes and Jamieson2016), Roi Baudouin (Lenaerts and others, Reference Lenaerts2016), Nansen (Bell and others, Reference Bell2017), Petermann Glacier (Macdonald and others, Reference Macdonald, Banwell and MacAyeal2018) and others (Kingslake and others, Reference Kingslake, Ely, Das and Bell2017; Bell and others, Reference Bell, Banwell, Trusel and Kingslake2018). In the current study, however, we report on the 20-year surface evolution of the debris-covered McMurdo Ice Shelf (McMIS). Part of this evolution involves the emergence of previously undocumented pedestalled, relict lakes that we refer to as ‘pedestals’ because of their topographic expression. These features develop over interannual timescales, beginning as surface lakes, then becoming shallow subsurface lakes and finally developing into raised areas of high albedo/low ablation compared with their surroundings.
Here, we document the development of specific pedestals on the McMIS and present a conceptual model for their formation (there may be others in this area, but we focus on those for which we have field observations). We do this primarily by analysing satellite image data collected over the period 1999–2018. Additionally, we analyse field-based topographic surveys, field photographs and in situ field observations from the 2016/2017 austral summer, with supplementary observations and photographs from the 2015/2016 austral summer.
2. STUDY SITE
The McMIS is a ~1500 km2 ice shelf in the northwest corner of the Ross Ice Shelf. Its ice front faces McMurdo Sound to the north and it abuts the southern tip of Ross Island, where the US McMurdo Station is situated, to its northeast (Fig. 1a). The ice shelf is relatively thin and in the study area (Fig. 1b) is at its regional minimum, ~10–30 m (Rack and others, Reference Rack, Haas and Langhorne2013; Campbell and others, Reference Campbell, Courville, Sinclair and Wilner2017). The ice flow is slow (~28 m a−1) and oblique to the ice front (Banwell and others, Reference Banwell2017). Surface accumulation occurs in the east of the McMIS (Paige, Reference Paige1968) and subsurface accumulation occurs through basal freezing (Kellogg and others, Reference Kellogg, Kellogg, Stuiver and Bentley1990; Fitzsimons and others, Reference Fitzsimons, Mager, Frew, Clifford and Wilson2012).
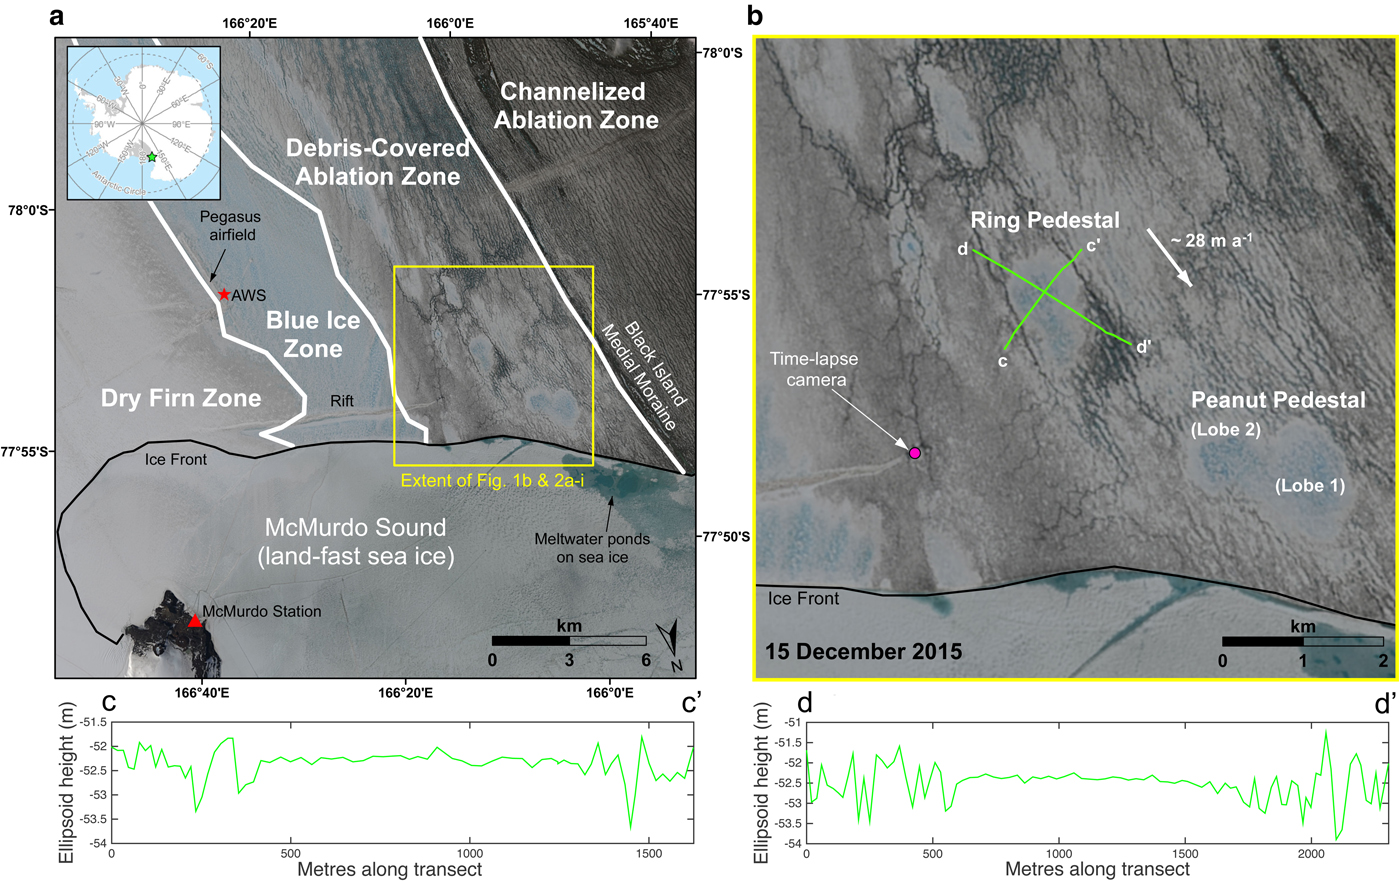
Fig. 1. (a) Part of the McMIS (green star in top-left inset shows location); (b) close up of the study region (yellow box in (a)); (c, d) surface topography of Ring Pedestal and its surrounding area (green lines in (b)). The background image is a pan-sharpened true-colour Landsat 8 OLI image dated 15 December 2015. White lines on (a) mark boundaries between different zones of the ice shelf (see text for explanation). The location is displayed for the automatic weather station (AWS) used for analysis (data displayed in Fig. S4). The white arrow in (b) indicates the local ice flow direction and speed (~335° True at ~28 m a−1 based on GPS velocity data from the 2016/2017 austral summer; Banwell and others, Reference Banwell2017). The location is displayed for the time-lapse camera (data displayed in Fig. S2). Green lines on (b) indicate the location of the topographic surface profile transects shown in (c, d) that were measured by roving GPS ground survey. Ring and Peanut Pedestals can be seen in their advanced, pedestalled states.
3. OBSERVATIONS
Observations were made from the ground and helicopter during three field deployments; December 2015–January 2016, October–November 2016 and January–February 2017. Additionally, a time-lapse camera (location in Fig. 1b) captured images of the surface every 30 min between 25 November 2016 and 27 January 2017 (see Supplementary Material for further details). In November 2016, two approximately perpendicular transects across Ring Pedestal and its immediate surroundings were surveyed using a roving differential GPS (5–10 cm vertical uncertainty, see Supplementary Material), with locations indicated in Figure 1b.
A time series of completely- or partially-cloud-free Landsat 7 and 8 images over the study site (Fig. 1b) was acquired for the period 13 December 1999 to 19 January 2018 (Table S1). Moderate Resolution Imaging Spectroradiometer (MODIS) images were also analysed in NASA's Worldview application for January–February 2002, when there was a gap in the Landsat 7 record. Analysis of the evolution of the study region was carried out by visual inspection of the images, with a particular focus on the evolution of Ring Pedestal, and the two lobes of Peanut Pedestal (Fig. 1b).
To assess the evolution of surface features in response to changes in temperature, mean monthly air temperatures were calculated for our study period (when data were available). Data were obtained from the Pegasus North AWS (location in Fig. 1a, see the Supplementary Material).
To place observations made in the study region (Fig. 1b) into a wider perspective, we first classified a larger area of the McMIS (Fig. 1a) into distinct zones based on surface cover. This was done by assessing the output of a supervised classification of a Landsat 8 image (Fig. S1), dated 12 December 2016 (see Supplementary Material for further details of this process), in combination with qualitative visual inspection of the 1999–2018 imagery for the larger area, and consideration of reports in the literature.
4. ICE-SHELF ‘ZONES’
From East to West, across a distance of ~12 km, the McMIS transitions from a ‘Dry Firn Zone’, through a ‘Blue Ice Zone’ and a hydrologically-dynamic ‘Debris-Covered Ablation Zone’, to, finally, a debris-covered ‘Channelised Ablation Zone’ (Fig. 1a). Our study site is situated in the ‘Debris-Covered Ablation Zone’.
The Western portion of the McMIS includes the Debris-Covered Ablation and the Channelised Ablation Zones (Fig. 1a). The area is widely covered in gravel-size, or finer, debris that has a large influence on the surface energy balance (Fig. 1; Glasser and others, Reference Glasser, Goodsell, Copland and Lawson2006, Clendon, Reference Clendon2009). Due to the low albedo of the debris, which across most of the area is too thin to thermally insulate the ice (cf. Østrem, Reference Østrem1959), the debris-covered areas experience high rates of ablation (Glasser and others, Reference Glasser, Goodsell, Copland and Lawson2006). The surface debris is dispersed and redistributed from the Black Island Medial Moraine (BIMM) that runs from south to north (Fig. 1a; Glasser and others, Reference Glasser, Goodsell, Copland and Lawson2006, Reference Glasser, Holt, Fleming and Stevenson2014). On and around the patches of surface debris, meltwater has been observed as early as November and as late as March (Debenham, Reference Debenham1965), with most melt occurring in December and January (Banwell and others, Reference Banwell, Willis, Macdonald, Goodsell and MacAyeal2019) when air temperatures reach or surpass 0 °C.
Immediately east of the BIMM is the Debris-Covered Ablation Zone (Fig. 1a), an area of more heterogeneous debris cover (and hence albedo) than in the Channelised Ablation Zone to the west of the BIMM. The Debris-Covered Ablation Zone is the area where the biggest changes in surface hydrology appear to have taken place and new surface lakes (at least those ≳150 m in diameter) and pedestals have developed exclusively in this zone over the last ~20 years as we report below. Currently, complex networks of anabranching channels exist in this zone, which pass through lakes or flow around pedestals. Melt ponds that form annually on the sea ice and abut this ice-shelf zone suggest that at least some of the streams export meltwater over the ice-shelf front. There is also evidence, in this zone, of subsurface melting (MacAyeal and others, Reference MacAyeal2018) and subsurface water flow during the melt season, as late as March (Banwell and others, Reference Banwell2017).
In contrast, the Channelised Ablation Zone (Fig. 1a) appears not to have undergone such marked changes in surface hydrology over the last ~20 years. The channels are more linear, and appear more incised and in a fixed-ice position compared with those in the Debris-Covered Ablation Zone.
Similarly, the Blue Ice Zone (Fig. 1a) appears not to have undergone marked changes over the last ~20 years. There are no surface lakes or streams present but substantial subsurface water has been observed there in summer. For example, Paige (Reference Paige1968) observed subsurface meltwater pools <1 m deep here, as did we in the field in December 2015. Further evidence of subsurface water in this area comes from observations of ice pingos, i.e. mounds of ice that form from the pressure in subsurface water pools as they freeze (Cailleux, Reference Cailleux1962; Paige, Reference Paige1968; Klokov and Diemand, Reference Klokov and Diemand1995).
5. DIFFERENTIAL ABLATION
The presence or absence of a thin surface debris cover is known to have a substantial effect on albedo, and therefore ablation rates (Østrem, Reference Østrem1959). Where there was debris, we recorded a mean ablation rate of 11 mm d−1 (std dev.: 3.4 mm d−1) against three stakes between early (5–11 November 2016) and late (21 January–1 February 2017) summer, but a rate of just 1.5 mm d−1 (std dev.: 0.6 mm d−1) against nine stakes over the same time period where the surface was clean. This differential ablation, between patches of debris-covered and clean ice, creates a rough, irregular surface that becomes more pronounced as the summer progresses (Fig. S2). Columns, pinnacles and platforms of clean ice stand tall, raised above surrounding areas of debris-covered ice. Raised, clean areas have horizontal extents of just a few centimetres to several metres. Some of these elevated areas become unstable due to the differential ablation and/or undercutting by meltwater streams, causing them to collapse. New clean-surface, low-ablation patches can form over dirty areas when a thick ice lid forms over a pool of meltwater, and especially if this is supplemented by thick snowdrifting in the low elevation areas during winter. Conversely, in some locations, ablation in a clean area can expose a subsurface debris layer. Differential ablation is therefore highly spatially and temporally variable, producing a constantly changing surface topography and roughness in the Debris-Covered Ablation Zone.
6. PEDESTALLED RELICT LAKES
Ring Pedestal and Peanut Pedestal are conspicuous because of their large horizontal scales and debris-free surfaces (Fig. 1). Ring, and Peanut's two lobes have diameters of ~1 km. Unlike the surrounding area, the pedestals have a highly uniform, high-albedo, smooth, flat surface, suggestive of spatially-uniform and low ablation rates.
Meltwater channels are diverted around the pedestals (Fig. 1b), showing they are raised compared with their surrounding areas. Their pedestalled nature is also illustrated by the topographic surveys conducted across Ring Pedestal and its surroundings (Figs 1c, d). The surveys show the surrounding area has a highly variable topography with an elevation range of ~2 m. This region includes many low areas with relatively high debris cover, some of which have coalesced to form stream channels. The pedestal surface, however, is >1 m higher than the surrounding low points and its elevation varies by <0.20 m over a distance of 900 m, except for where there are ice pingos (Figs 1c, d and S3).
The pingos are typically ~5 m in width and ~1–2 m in height, with fractures radiating from their peak (Fig. S3). That pingos exist on the pedestals indicates that subsurface water has been present below the features (Cailleux, Reference Cailleux1962). We observed subsurface water ~1 m below the frozen surface of at least parts of Peanut Pedestal in January 2016 when we augured into its surface. Pingos are only observed on the pedestals and not elsewhere in the Debris-Covered Ablation Zone, but as mentioned above, they are recorded in the Blue Ice Zone (Paige, Reference Paige1968), which is also characterised by the presence of subsurface water. The pedestals also share the light-blue appearance of the Blue Ice Zone, based on ground observations and satellite imagery (Fig. 1; Fig. S1). Thus, the pedestals can be thought of as isolated, pedestalled Blue Ice Zones within the Debris-Covered Ablation Zone.
7. FORMATION OF PEDESTALLED RELICT LAKES
In our ~20-year satellite record, we observe open-water surface lakes develop, freeze over and evolve into pedestalled, relict lakes (Fig. 2; Video S1). At the beginning of the time series, from December 1999 to December 2001 (Video S1; Fig. 2a), there is no evidence of open-water, frozen-over or relict lakes in the study region. The first evidence of a lake forming is in a January 2002 MODIS image, when an open-water lake becomes visible at Peanut Lobe 1 (Fig. 2b). At the beginning of the following summer (2002/2003), this lake has a thin frozen ice lid, which appears to have melted by 19 November 2002 (Video S1), before the lake freezes over again by 17 December 2002 (Fig. 2c). Peanut Lobe 1 remains frozen over in 2003/2004 (Video S1).
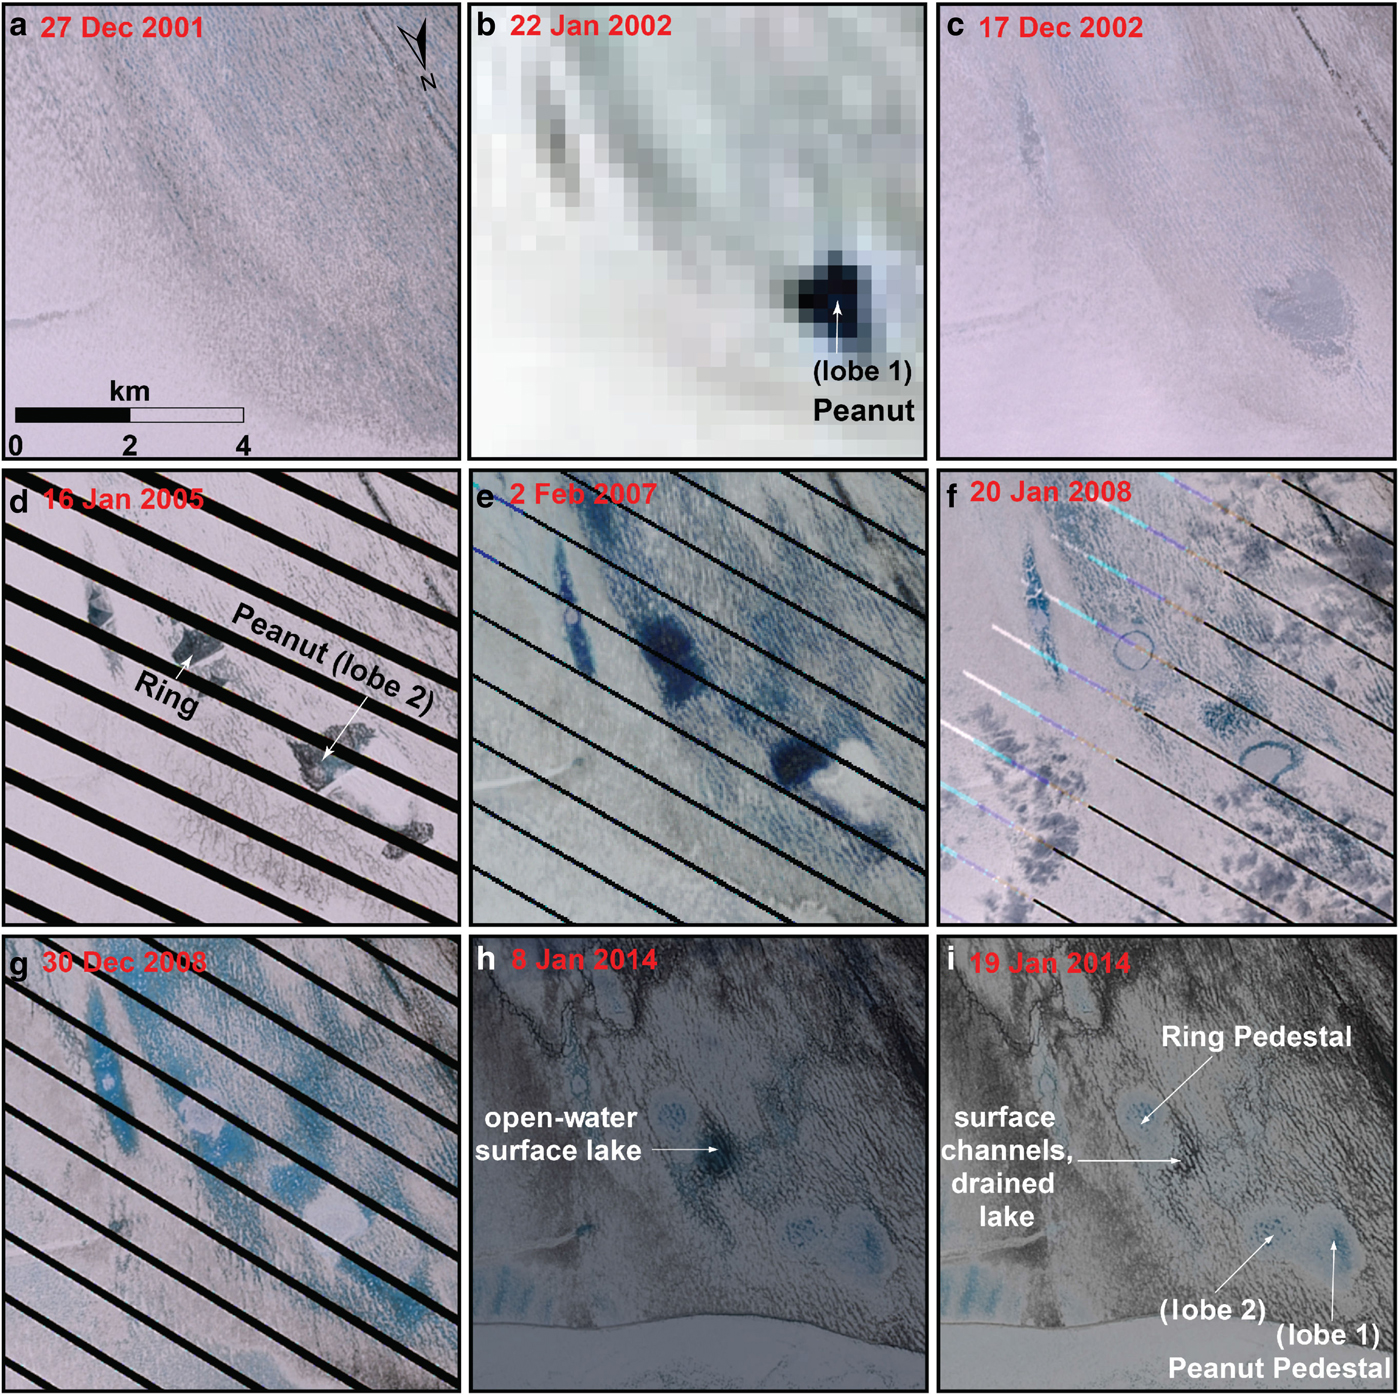
Fig. 2. Formation of Ring and Peanut Pedestals, from open-water surface lakes, to frozen-over surface lakes, to raised pedestals, from December 2001 to January 2014. No lakes are visible in (a). Peanut Lobe 1 is visible as (b) an open-water surface lake, (c) frozen-over surface lake and (d–i) pedestal. Ring and Peanut Lobe 2 are visible as (d–e) open-water surface lakes, (f) frozen-over surface lakes and (g–i) pedestals. Images (a, c–g) are true-colour pan-sharpened Landsat 7, (b) is a MODIS true-colour corrected reflectance image and (h–i) are true-colour pan-sharpened Landsat 8 images. The extent of each image is shown in Figure 1a. The complete time series of all 147 images acquired from 13 December 1999 to 19 January 2018 are given in Video S1.
In July 2004, the mean temperature is −40.5 °C, the lowest for the study period (Fig. S4). In the summer of 2004/2005, despite ponding around it, Peanut Lobe 1 appears as an area of high-albedo ice and meltwater does not pond at or flow through it, during this (Fig. 2d) or subsequent melt seasons. This suggests that Peanut Lobe 1 starts to become a frozen-over, raised pedestal in 2004, possibly as a result of enhanced freezing-through of the lake because of the low winter temperatures. During the summer of 2004/2005, there is also an open-water lake at the Ring site for the first time and Peanut Lobe 2 is an open water lake immediately adjacent to Peanut Lobe 1 (Fig. 2d). Later in the summer, a superimposed ice lid forms over these two previously open-water surface lakes (Video S1).
In 2005/2006 there is a gap in the Landsat imagery and the MODIS images are difficult to interpret. However, open-water lakes form again at the sites of Peanut Lobe 2 and Ring in the 2006/2007 melt season and pedestalled Peanut Lobe 1 stands out as an area of very high albedo (Fig. 2e). These open-water lakes freeze over at the end of that summer (Video S1).
In the 2007/2008 melt season, Peanut Lobe 1 remains completely frozen over. At Peanut Lobe 2 and Ring there are frozen-over surface lakes with a ring of meltwater visible at the edge of each (Fig. 2f), similar to the rings of water that develop around ice-capped lakes on the Greenland ice sheet (e.g. Miles and others, Reference Miles, Willis, Benedek, Williamson and Tedesco2017). The ring could be the result of melting at the edges of the ice cover, revealing water in the lakes (as in Greenland) or, alternatively, the frozen-over lakes may now have become pedestalled, with meltwater ponding in a ring-like depression that forms around them.
The second coldest month during the study period is August 2008 with a mean temperature of −39.6 °C (Fig. S4). In the summer of 2008/2009, despite extensive meltwater ponding across the study region, including immediately adjacent to the Ring and Peanut sites, there appears to be no surface water at Ring or Peanut (both lobes), which have a high-albedo and appear to be frozen over (Fig. 2g). The fact that no water flows onto their apparently frozen surfaces suggests the features are now hydrologically isolated from their surroundings, which is consistent with them now being pedestalled. It is possible that the low temperatures during the preceding winter caused increased freeze-through, preventing melting of the ice surface in the summer and influencing the formation of the pedestals. After this melt season, all three sites retain high albedo, debris-free surfaces and show no evidence of surface water in subsequent satellite images. Furthermore, over the subsequent years (Figs 2h, i), the pedestalled surfaces increasingly come to resemble the appearance of the Blue Ice Zone to the east (Fig. 1a), where blue ice dominates and both surface meltwater and debris are absent. From 2012/2013 onwards, a network of anabranching streams is clearly visible in the study area surrounding the pedestals, with all streams diverting around the pedestals (Figs 2h, i).
We also note that not all surface lakes develop into pedestals. For example, an open-water surface lake forms in the area immediately adjacent to Ring Pedestal on numerous occasions from 2008 onwards (e.g. Fig. 2h). On 8 January 2014, an open-water surface lake is present there (Fig. 2h), but by 19 January 2014 it has drained (Fig. 2i), likely via the dense network of surrounding streams. This suggests that this area does not develop into a high albedo pedestal because the lake is able to drain before freezing over.
8. CONCEPTUAL MODEL
The observations described above lead us to propose the following conceptual model of pedestal formation on ice shelves (Fig. 3). The evidence suggests that a heterogeneous surface debris cover plays a key role in pedestal formation, due to the effects of debris on surface albedo and therefore energy balance.
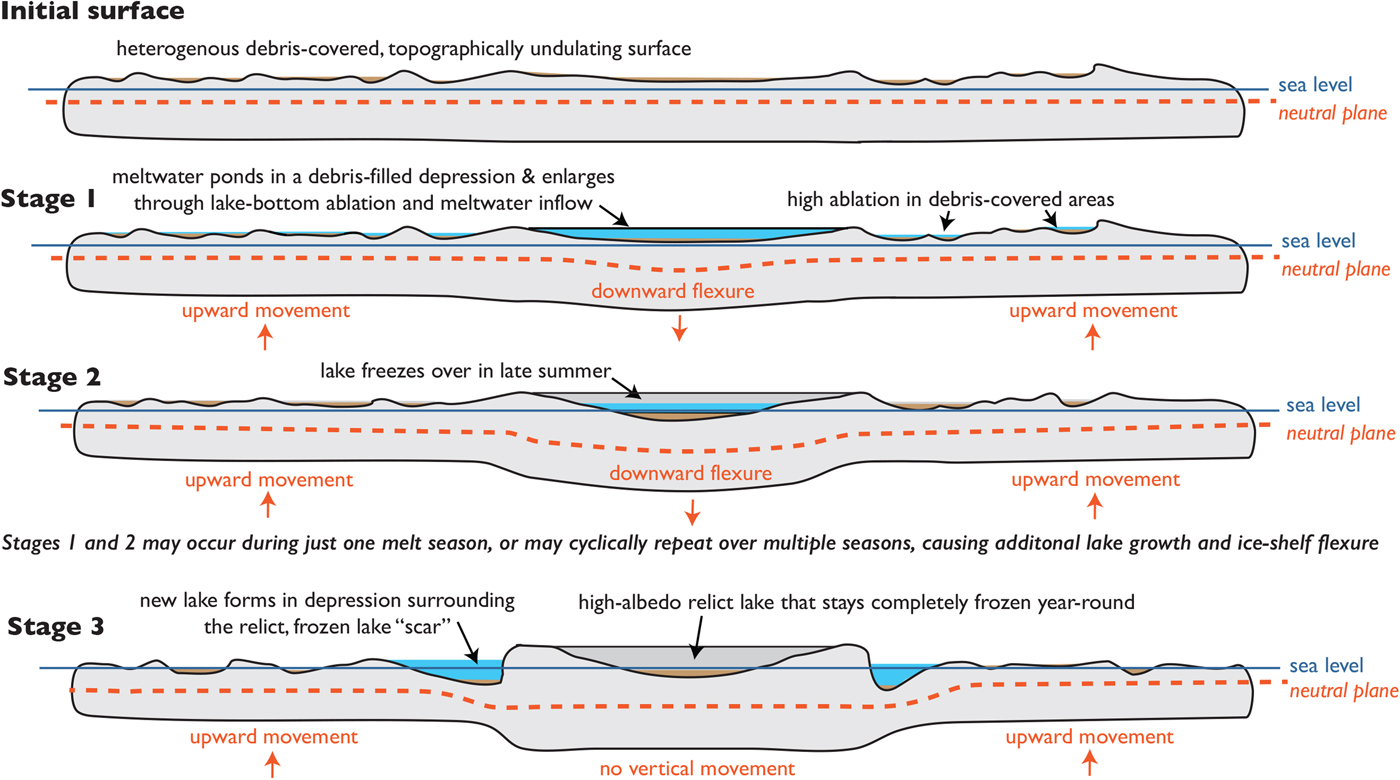
Fig. 3. Schematic illustration of the conceptual model of pedestal formation from debris-covered ice surface (initial surface), to open-water surface lake (stage 1), to frozen-over surface lake (stage 2) to pedestal (stage 3).
Stage 1: In a high melt year, meltwater collects in a depression to form a shallow lake. This water, together with the high debris content, promotes lake-bottom ablation (Lüthje and others, Reference Lüthje, Pedersen, Reeh and Gruell2006; Tedesco and others, Reference Tedesco2012; Miles and others, Reference Miles2018) and enlargement of the lake. The weight of the water causes a flexural response of the ice shelf, depressing it beneath and near to the lake (MacAyeal and Sergienko, Reference MacAyeal and Sergienko2013; Banwell and MacAyeal, Reference Banwell and MacAyeal2015).
Stage 2: The lake freezes over at the end of the melt season and remains frozen during the winter. Debris on the lake bottom is sufficiently far below the frozen surface that it is masked and the lake surface now has a higher albedo than the surrounding, debris-covered areas.
Stages 1 and 2 may occur over just one melt season, or they may repeat over multiple seasons, which will further enlarge the lake and cause additional ice-shelf flexure.
Stage 3: If, in a subsequent summer, the lake surface does not receive sufficient energy to melt its ice cover (which will now be thicker after low temperatures in the preceding winter), it retains this frozen, high-albedo surface. During this time, the frozen lake surface melts more slowly than the surrounding lower albedo, debris-covered areas. This differential ablation initiates the process of the former lake becoming pedestalled and hydrologically isolated. Meanwhile, the surrounding area of dirty ice shelf experiencing high ablation rates rebounds upwards, through ice flexure, to regain hydrostatic equilibrium, producing a ring-like depression around the pedestal in which meltwater ponds.
And beyond: If, during subsequent summers, the lake surface remains frozen, the differential ablation causes the former lake to become increasingly pedestalled. Meanwhile, the ring-like water-filled depression around this pedestal increases in depth as the rapidly ablating area continues to rebound hydrostatically. However, this surrounding area does not become as high as the pedestalled, relict lake because it has a lower ice thickness due to the higher ablation rates. Meltwater streams are diverted around, and ponds form next to, the pedestalled, relict lake (these adjacent ponds may also subsequently develop into pedestals). If, during a subsequent summer, energy receipt is particularly high, the pedestalled relict lake's frozen surface may melt, re-exposing the lake-bottom debris and enabling lake-bottom ablation to re-commence. This will slow the process of pedestal formation but not reverse it. Additional stages may exist but they have not yet been observed.
9. IMPLICATIONS
We suggest that the development of pedestalled relict lakes has a significant influence on the surface energy balance, hydrology and flexure of an ice shelf. First, because pedestal formation reduces the amount of exposed surface debris, it increases the surface albedo and reduces the absorption of solar radiation. Expansion in the number of pedestals across the McMIS could, therefore, progressively lower average ablation rates and reduce surface meltwater runoff rates. This expansion may include the development of directly-adjacent pedestals, such as the two lobes of Peanut. The Debris-Covered Ablation Zone could increasingly resemble the Blue Ice Zone, an area with which the pedestals share certain characteristics. As such, there would also be an expansion of subsurface water in the area. However, the observed expansion of pedestalled areas may be limited if surface lakes drain, over the surface (as observed, Fig. 2i and Banwell and others, Reference Banwell, Willis, Macdonald, Goodsell and MacAyeal2019) or through fractures (not observed to date), before they freeze over in the winter, and by the eventual re-emergence of debris on the former lake bottom through ablation of the pedestal.
Second, because the pedestals are raised, and surrounded by a depression formed by hydrostatic rebound of the surrounding rapidly-ablating area, dense networks of diverted stream channels and intermittent areas of ponding meltwater form. Most notable is the area adjacent to and north-west of Ring Pedestal (Fig. 2h). If debris then becomes concentrated in these relatively low elevation areas, and if flowing meltwater passing through these areas helps prevent them from freezing over, then these areas between pedestalled features may become sites of sustained surface ablation.
Third, concentrated areas of meltwater ponding around pedestals, combined with hydrostatic rebound of the rapidly ablating areas (Fig. 3), could cause potentially significant ice-shelf flexure (e.g. Banwell and MacAyeal, Reference Banwell and MacAyeal2015; Banwell and others, Reference Banwell, Willis, Macdonald, Goodsell and MacAyeal2019), which may lead to fracture. The potential for ice-shelf fracture initiation will increase after multiple years of pedestal formation and associated ice flexure and stress build-up, which could contribute to ice-shelf instability (Banwell and others, Reference Banwell, MacAyeal and Sergienko2013). Preliminary analysis (using the model of MacAyeal and others, Reference MacAyeal, Sergienko and Banwell2015) indicates that the effect of pedestal formation on ice-shelf flexure appears to be strongest for ice shelves that are both thin (<50 m) and have debris-induced differential ablation rates leading to ~10% thickness differences (2–5 m in the case of the 20–50 m thickness of the McMIS). The McMIS is atypical of ice shelves in Antarctica due to its low thickness and high debris cover; so it remains to be determined whether pedestal formation will be a concern for flexure-stress driven ice-shelf fracture on other ice shelves. Modelling the flexural effect of pedestal formation will be the subject of further study in order to determine the potential influence on ice-shelf fracture and stability in more detail.
10. CONCLUSION
This study documents the development of novel ice-shelf features that we call ‘pedestalled relict lakes’, or ‘pedestals’ for short. Although these features require the relatively unusual conditions found on the McMIS (an ice shelf with surface debris and meltwater), other ice shelves may become subject to debris-exposure or aeolian dust transport and enhanced surface melting as the climate changes. Where they develop, pedestals have a strong influence on the surface energy balance, hydrology and potentially ice flexure, and thus could also affect the stability of an ice shelf.
SUPPLEMENTARY MATERIAL
The supplementary material for this article can be found at https://doi.org/10.1017/jog.2019.17
ACKNOWLEDGEMENTS
This work was supported by U.S. National Science Foundation grant PLR-1443126. Additionally, GJM acknowledges support from a NASA Earth and Space Science Fellowship (NNX15AN44H), AFB acknowledges support from a Leverhulme/Newton Trust Early Career Fellowship and a Cooperative Institute for Research in Environmental Sciences (CIRES) Postdoctoral Visiting Fellowship and ICW acknowledges support from a CIRES Sabbatical Fellowship. We are very grateful to the staff of the U.S. Antarctic Program and McMurdo Station that made our successful field campaign possible. We are grateful to UNAVCO, particularly Brendan Hodge, who supplied and helped us with the roving GPS, and to the Polar Geospatial Center for support, particularly Mike Cloutier. We thank Emily Hansen for support in applying the supervised classification of imagery. Finally, we thank the Editor, Carleen Tijm-Reijmer and two anonymous reviewers whose helpful comments enabled us to considerably improve the paper.


 Open access